H24 : An agent-based model to investigate the effects of social segregation around the clock on social disparities in dietary behaviour
Clémentine COTTINEAU, CNRS, Centre Maurice Halbwachs
Julien PERRET, IGN, LaSTIG
Romain REUILLON, CNRS, Institut des Systèmes Complexes / Géographie-cités
Sébastien REY-COYREHOURCQ, Université de Rouen, IDEES
Julie VALLÉE, CNRS, Géographie-cités


EIGHTIES
slides : https://goo.gl/Nrpptu
Modelling human behaviours
Modelling territories
Spatial representation of individuals to understand their behaviours with Agent Based Model
Keep it Simple
Keep it Detailed
[Auchincloss et al., 2011]
[Nagel, Auxhausen et al.]

Spatial representation in ABM
Abstracting the characteristics of space
Space as an input parameter
... What about time?
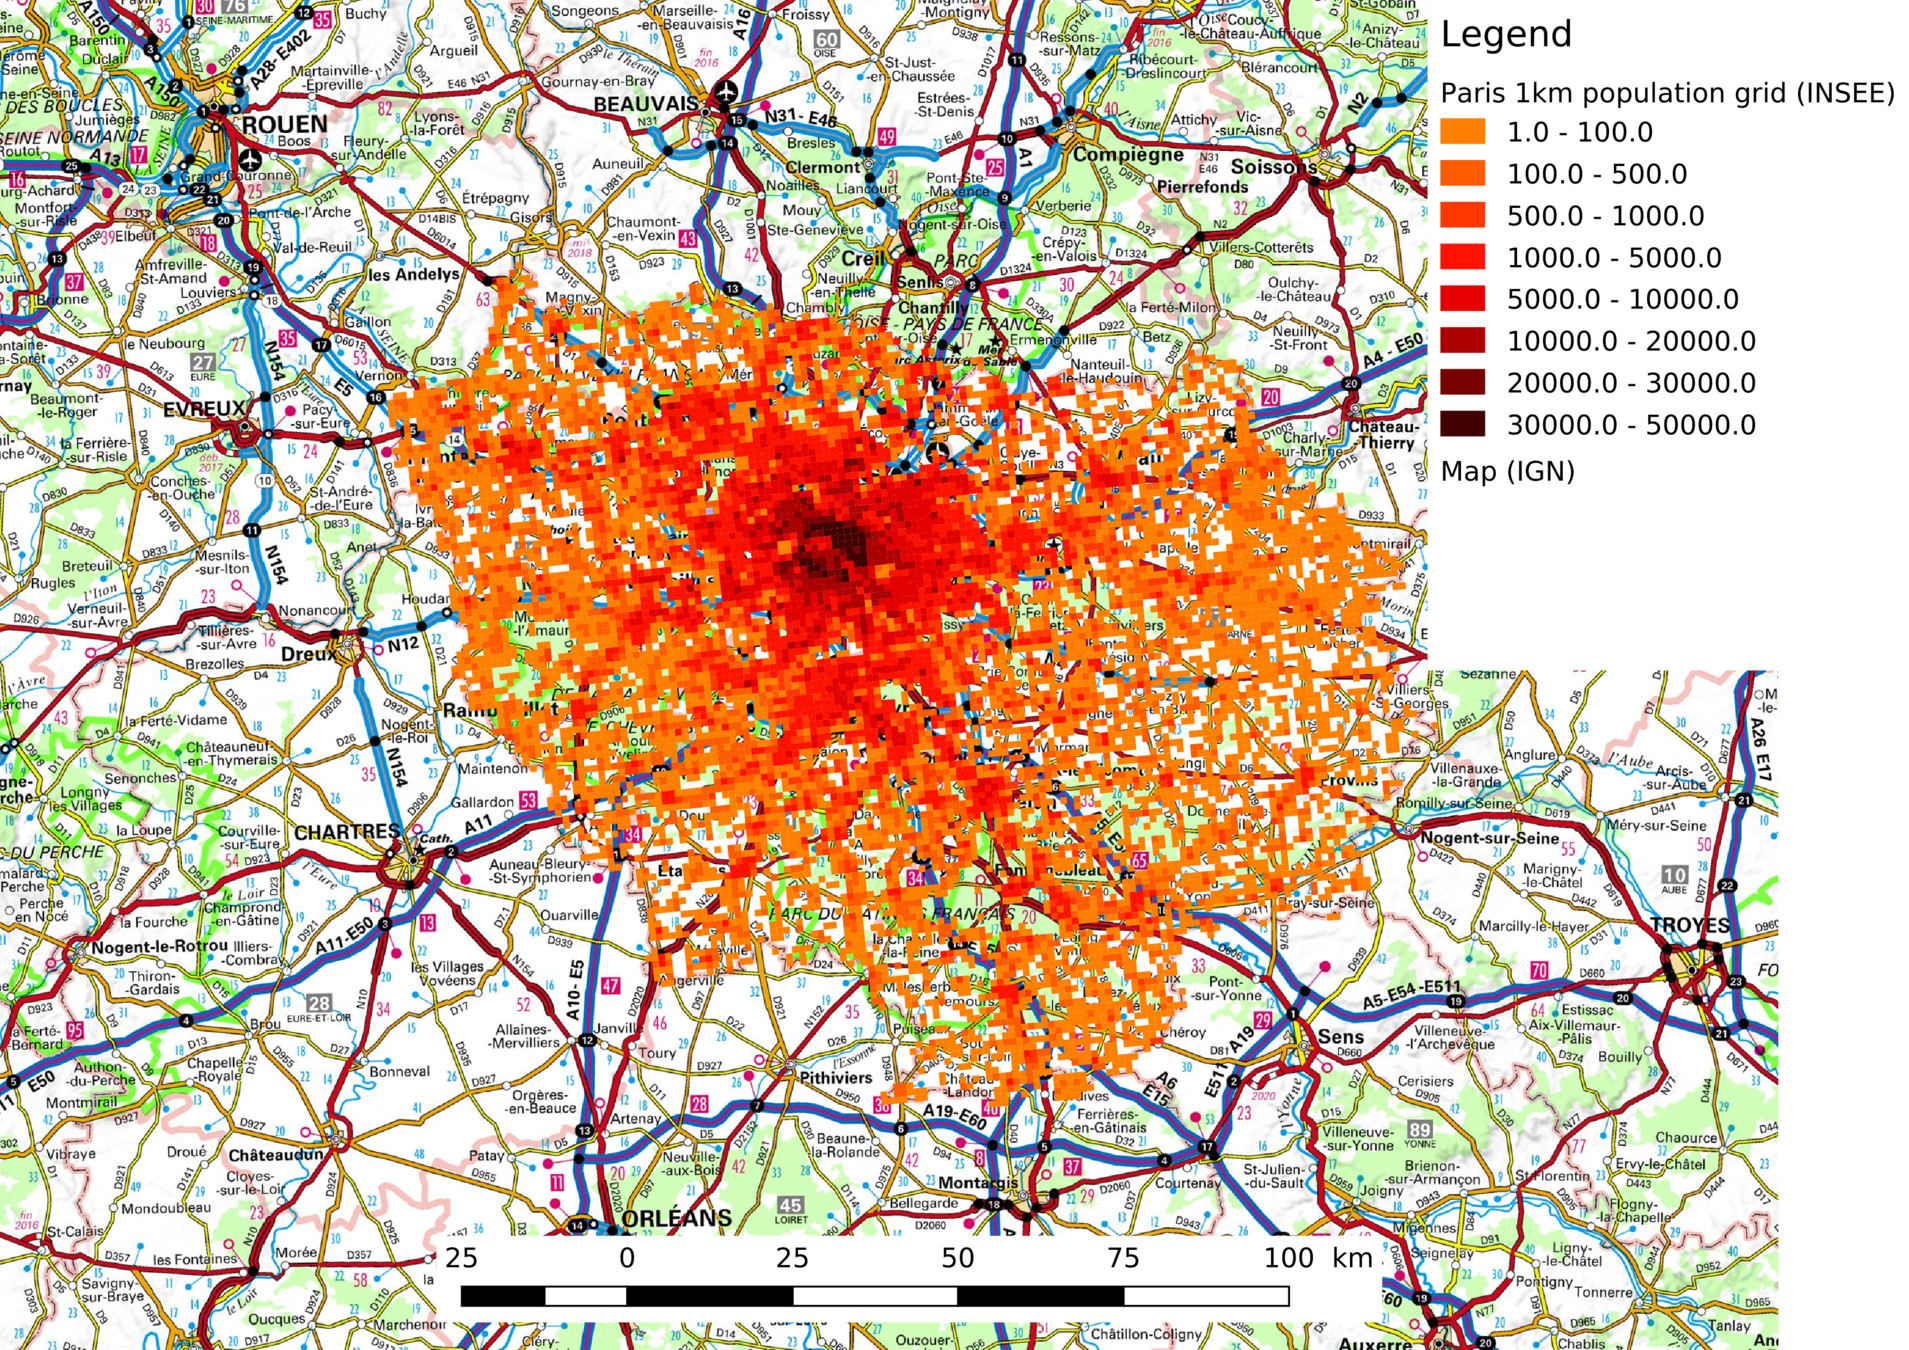
ex: SpaceMatters project with population density grids as varying initial spatial conditions [Raimbault et al., 2017]
Between simplistic simplification and singularity
- Spatio-temporal heterogeneity
- Constraints on interaction
Neutral Landscape Model
Space Matters
J. Raimbault et al.
Thematical challenge
Place /neighbourhood effects :
- matter when exploring human behaviors in health, education, voting etc.
- hard to prove because people (i) adapt to each other, (ii) sort themselves between places and (iii) only live once, which makes alternative spatial scenarios impossible to observe.
Interactions between people & places remain often static in statistical models
- either without including people's daily trajectories
- or with people's daily trajectories but without including place's daily trajectories
Need ABM to explore people's and place's daily trajectories and their impact on human behaviours
Objectives
Explore effets of segregation around the clock on extent of social disparities in human behaviours
Are social disparities in human behaviours greater...
(i) when night locations are spatially segregated rather than randomly attributed ?
(ii) when day locations are taken into consideration besides night locations ?
| Random locations | Survey-based locations | |
| Night only (ie. residence) | Scenario 1 | Scenario 2 |
| Night & day | Scenario 3 | Scenario 4 |
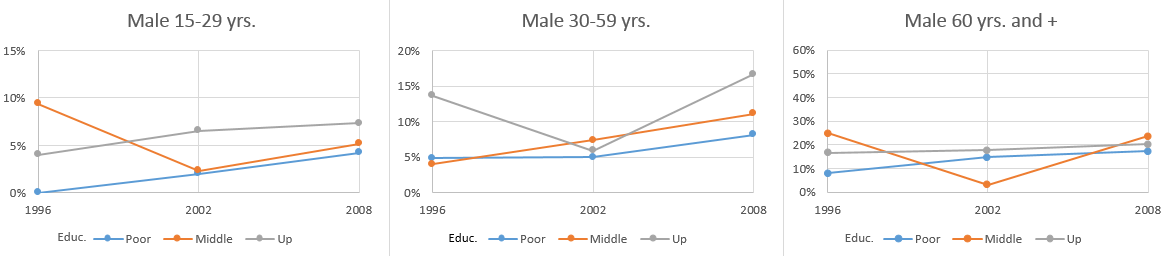
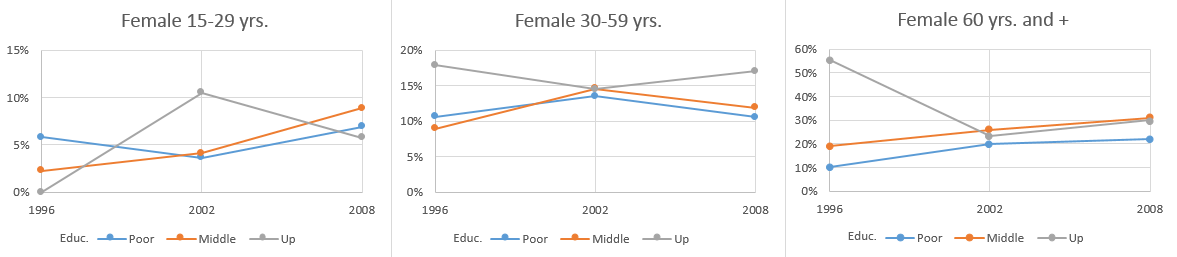
Diet behaviours
Convergent findings about social disparities in fruit and vegetable consumption
Pionner research using ABM to explore social disparities in diet, but only in the context of (simplistic) residential segregation

J Am Diet Assoc. (2008)
J Am Diet Assoc (2010)
National nutrition policies
eg. Programme National Nutrition Santé (PNNS) in France since 2001

SSM - Population Health (2016)
Am J Prev Med (2011)
(French) data
Diet dynamics
Spatio-temporel locations
explored with same sociodemographic groups (18)
Night (ie. residence) : 2012 census
Day & evening : 2010 origin-destination survey
Baromètres Santé Nutrition
(1996 ; 2002 ; 2008)
Sex (male ; female)
X
Age (15-29 yrs.; 30-59 yrs.; 60 yrs. and +)
X
Education (poor ; middle ; up)
Population generation
Agent diet opinion and behaviour initially defined according to sociodemographic category
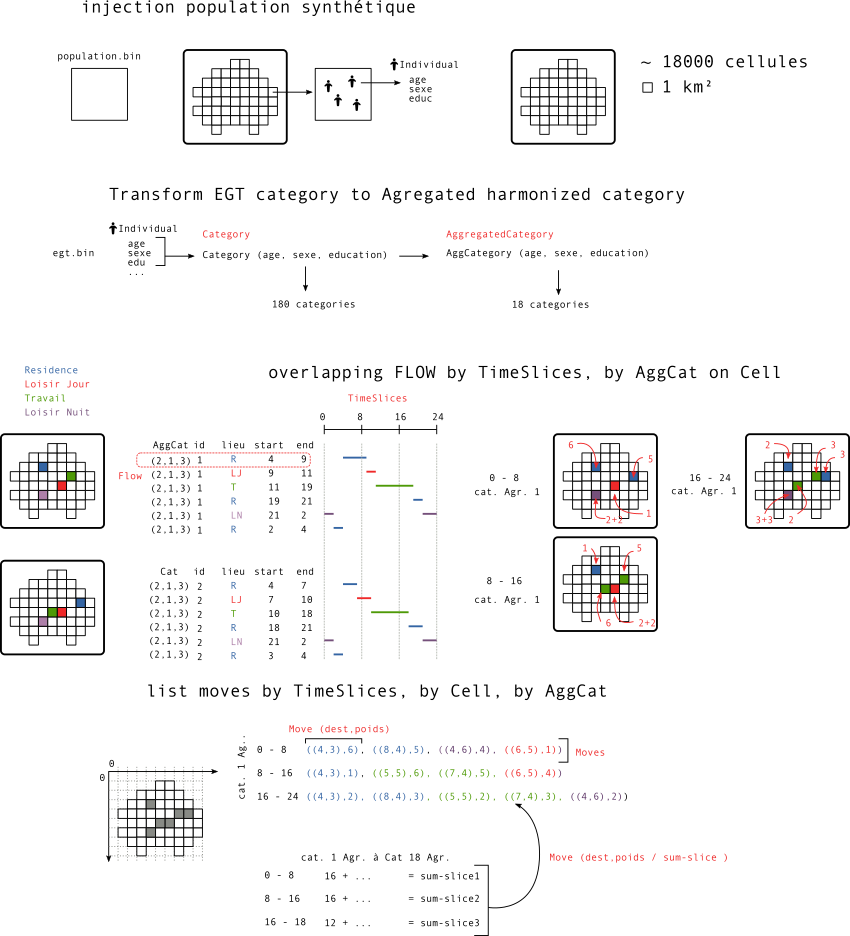
8,16 millions of agents
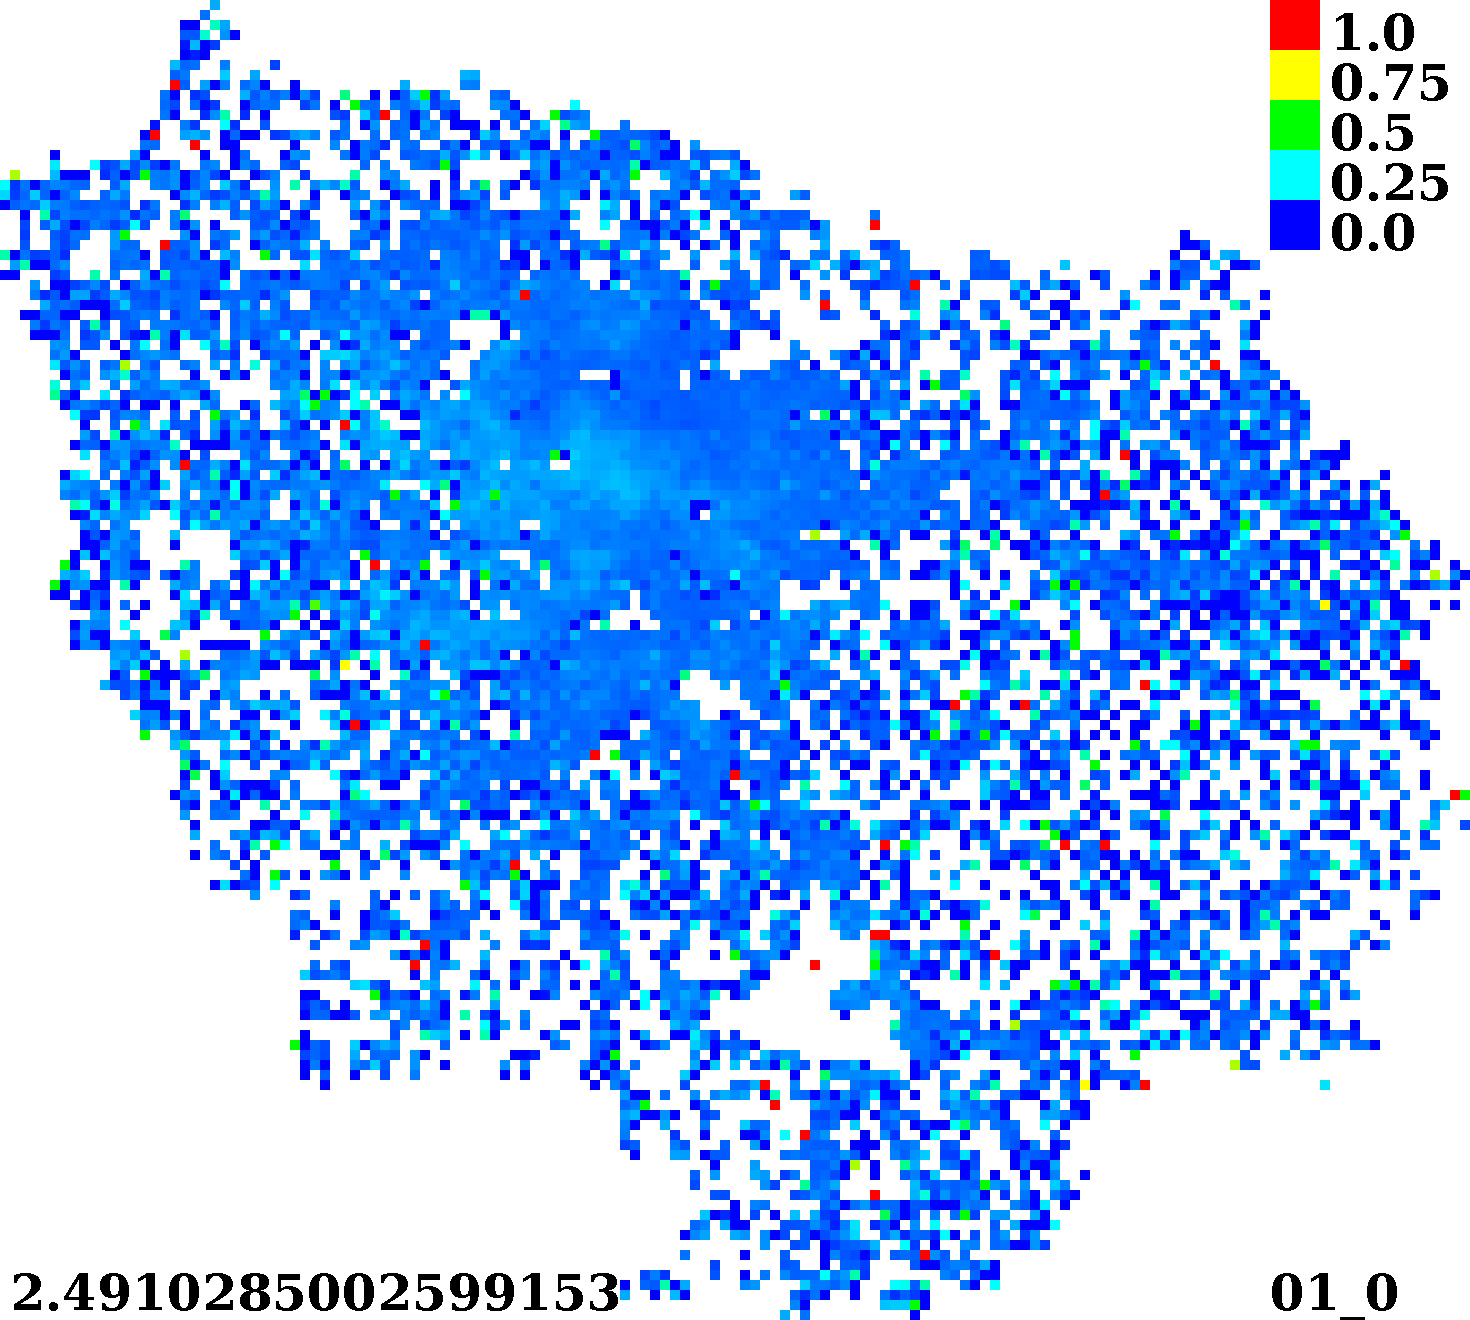
Spatial grid
8540 inhabited cells (1km X 1km)
Agent
with night/day/evening cells
with sociodemographic attributes
68 % in a 'day' cell ≠ the 'night' cell
Ile-de-France
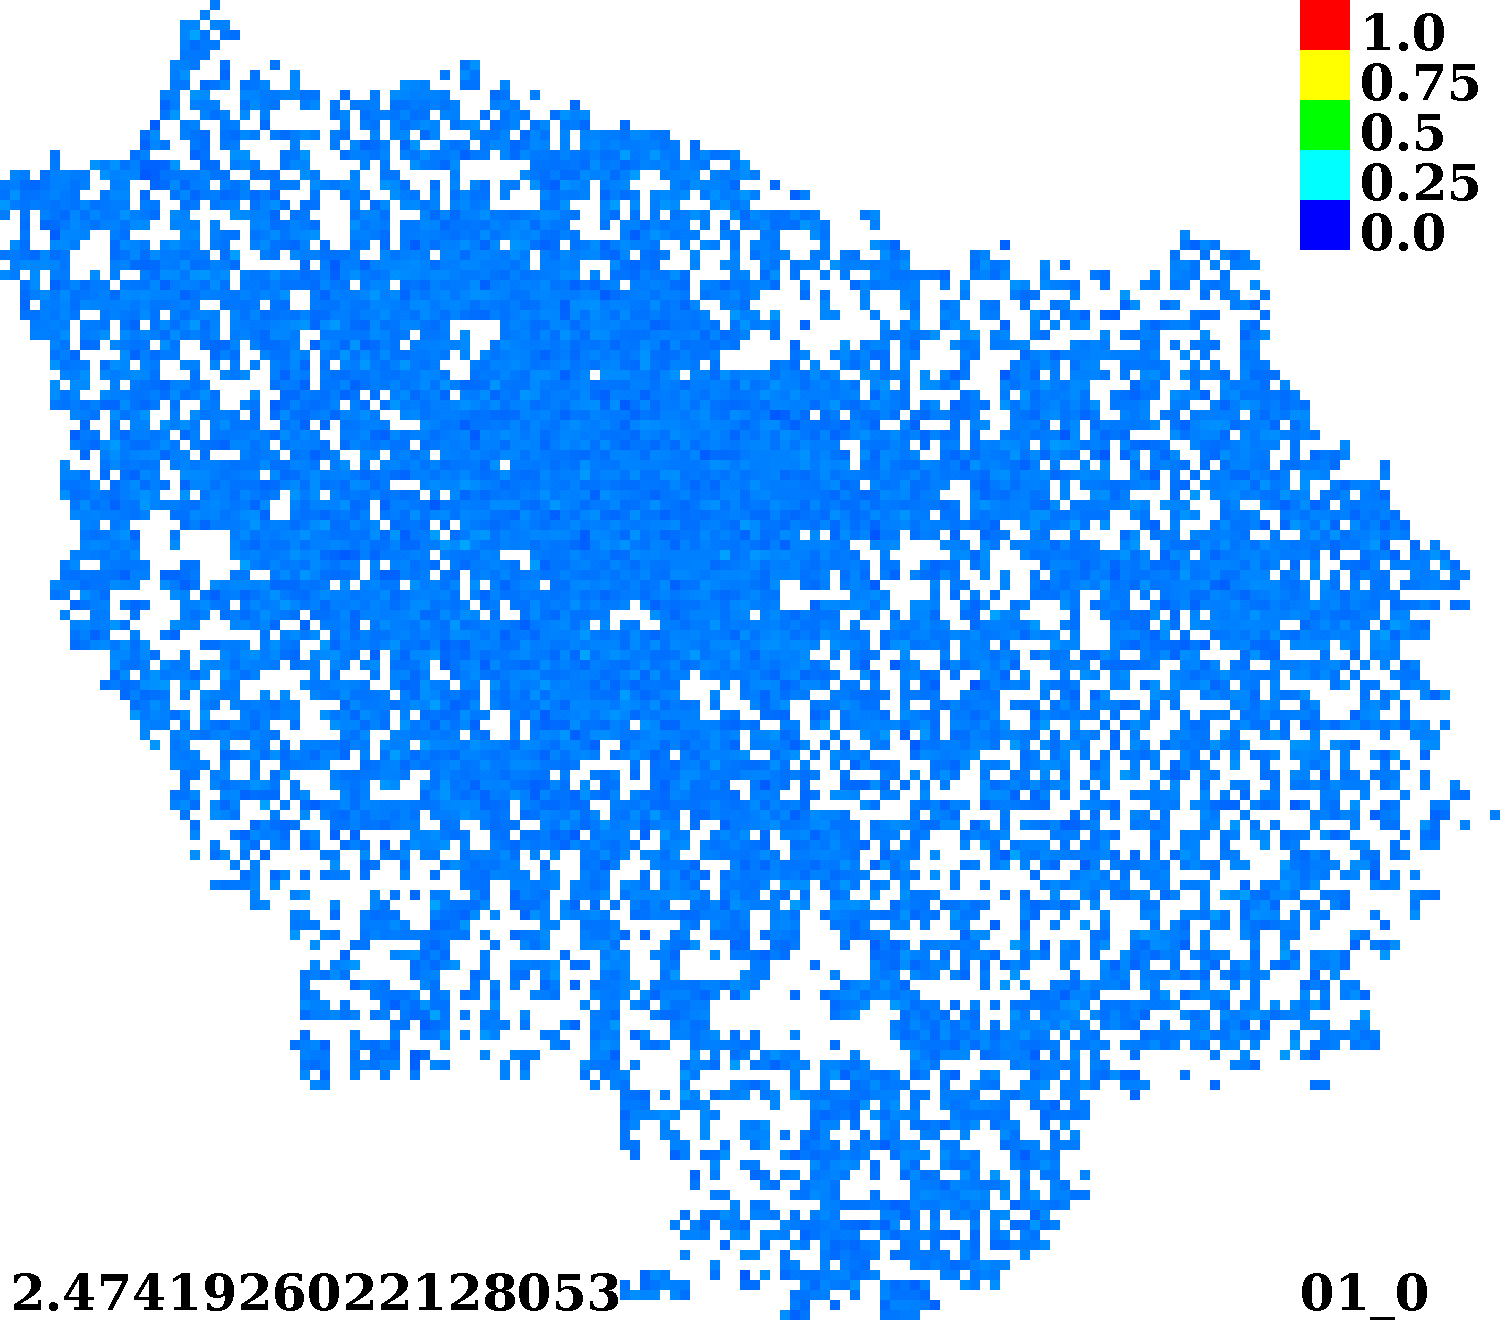
Initial dietary behavior
From 1996 data : 5-a-day fruit and vegetable consumption
Source : Baromètres Santé Nutrition (1996 ; 2002 ; 2008)
Initial dietary behavior
Social Ineq.
Day_Slice
% Healthy
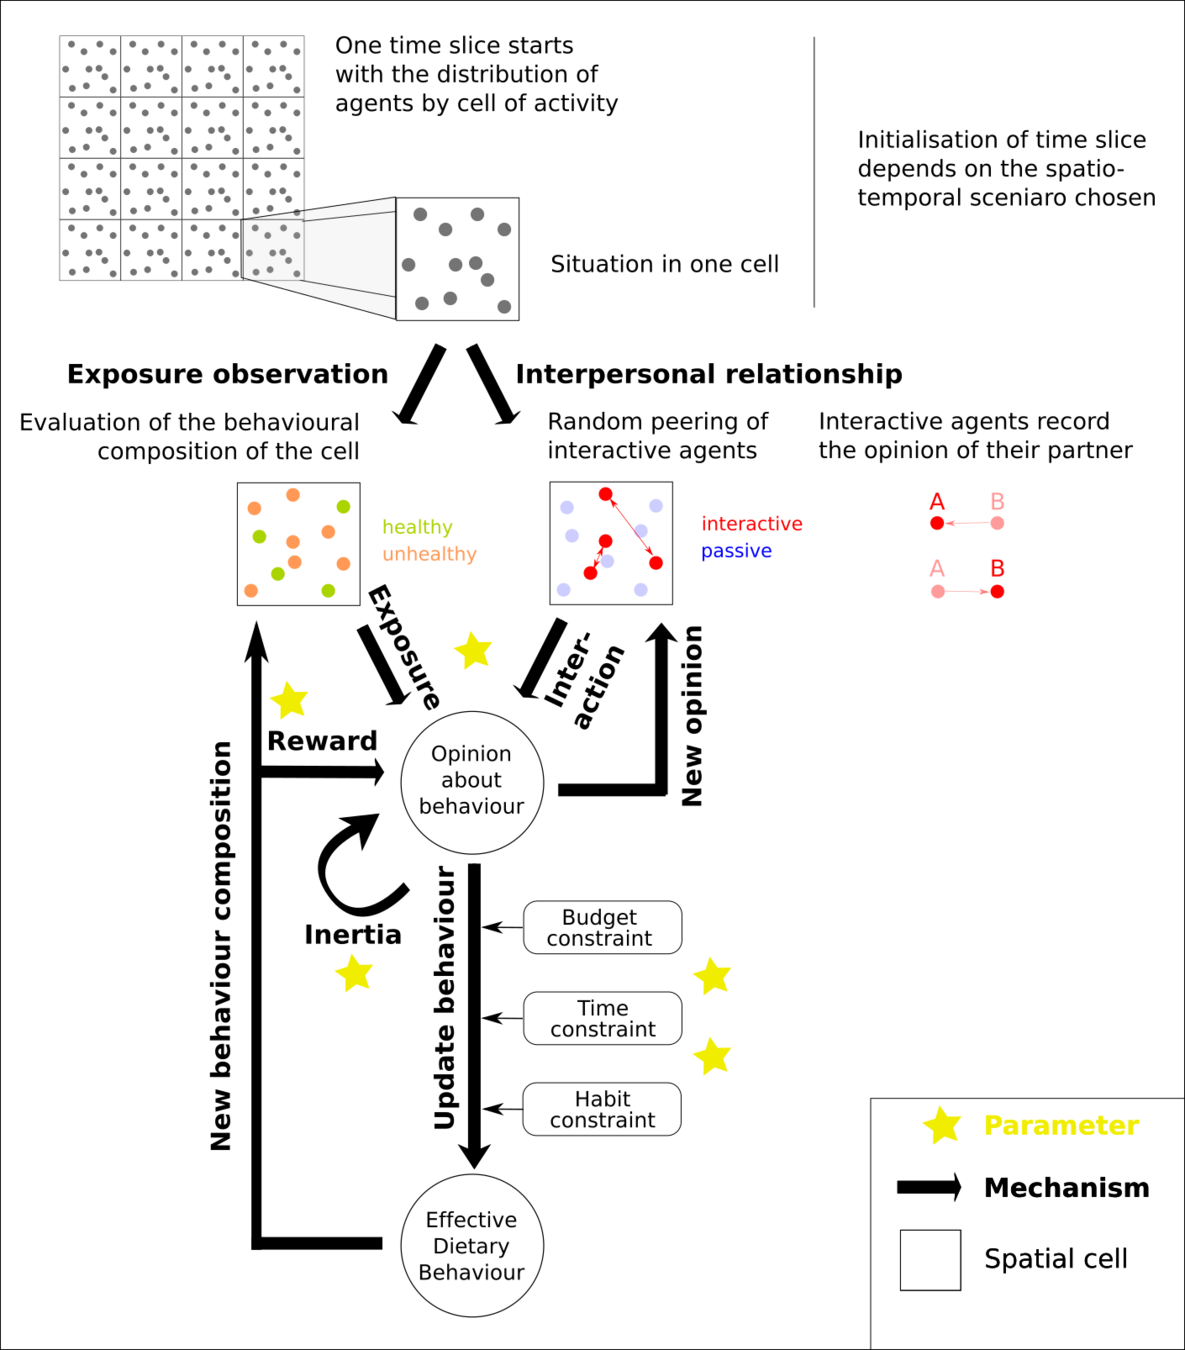
Model structure
Scenarios 1 & 2:
1 time slice per day
Scenarios 3 & 4:
3 time slices per day
Spatial interactions
Modelling opinion change
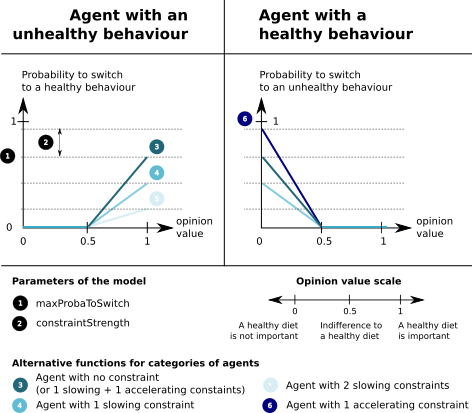
Modelling behaviour change under constraints
Parameter expectations
| Parameter | Mecha-nism | Range | if min | if max | Influence on 5-a-day |
|---|---|---|---|---|---|
| Interaction | Spatial Interaction | [ 0 ; 1 ] | Observation of cell behaviour only | Observation of partner opinion only | |
| Reward | Behaviour-Opinion | [ 0 ; 1 ] | No Feedback from behaviour | Healthy behaviour strengthens opinion | |
| Inertia | Opinion-Behaviour | [ 0 ; 1 ] | Opinion depends on influences only | Stable opinion | |
| Switch Proba | Opinion-Behaviour | [ 0 ; 1 ] | No change of behaviour | Behaviour matches opinion | |
| Constraint | Opinion-Behaviour | [ 0 ; 1 ] | No constraint | Constraint prevents behaviour switch |
+
+
+
?
?
Evaluation protocol
A - Exploring behavior of standalone model
B - Invalidate behavior by falsification, an inverted calibration
optimisation using evolutionary algorithms (EA)
method : maximise diversity using pattern exploration algorithm
expected patterns : Consistent dynamics of the model in terms of opinion diffusion and behaviour change
space : one cell with 100 people
space : 8540 cells
method : minimise distance to data using multi-objective evolutionary algorithm (EA)
expected patterns : random scenario cannot produce coherent data and inequality between education groups
Model 50hh - 50uu
| Parameter | Mecha-nism | Range | Expected influence | Significant coefficient |
|---|---|---|---|---|
| Interaction | Spatial Interaction | [ 0 ; 1 ] | ||
| Reward | Behaviour-Opinion | [ 0 ; 1 ] | ||
| Inertia | Opinion-Behaviour | [ 0 ; 1 ] | ||
| Switch Proba | Opinion-Behaviour | [ 0 ; 1 ] | ||
| Constraint | Opinion-Behaviour | [ 0 ; 1 ] |
+
+
+
?
+
?
Multiple R-squared: 0.0828
Model 50hm - 50um
| Parameter | Mecha-nism | Range | Expected influence | Significant coefficient |
|---|---|---|---|---|
| Interaction | Spatial Interaction | [ 0 ; 1 ] | ||
| Reward | Behaviour-Opinion | [ 0 ; 1 ] | ||
| Intertia | Opinion-Behaviour | [ 0 ; 1 ] | ||
| Switch Proba | Opinion-Behaviour | [ 0 ; 1 ] | ||
| Constraint | Opinion-Behaviour | [ 0 ; 1 ] |
+
+
+
?
?
+
+
Multiple R-squared: 0.3023
Model 90hh - 10uu
| Parameter | Mecha-nism | Range | Expected influence | Significant coefficient |
|---|---|---|---|---|
| Interaction | Spatial Interaction | [ 0 ; 1 ] | ||
| Reward | Behaviour-Opinion | [ 0 ; 1 ] | ||
| Intertia | Opinion-Behaviour | [ 0 ; 1 ] | ||
| Switch Proba | Opinion-Behaviour | [ 0 ; 1 ] | ||
| Constraint | Opinion-Behaviour | [ 0 ; 1 ] |
+
+
+
?
?
+
Multiple R-squared: 0.2611
Model 10hh - 90uu
| Parameter | Mecha-nism | Range | Expected influence | Significant coefficient |
|---|---|---|---|---|
| Interaction | Spatial Interaction | [ 0 ; 1 ] | ||
| Reward | Behaviour-Opinion | [ 0 ; 1 ] | ||
| Intertia | Opinion-Behaviour | [ 0 ; 1 ] | ||
| Switch Proba | Opinion-Behaviour | [ 0 ; 1 ] | ||
| Constraint | Opinion-Behaviour | [ 0 ; 1 ] |
+
+
+
?
?
+
Multiple R-squared: 0.149
Aggregated output
Specification of a simulation run:
Observables
Obs. 1 : Distance to data
2002
2008
steps
years
3 slices
1996
simulated
data
Obs. 2 : Social inequality
MSE (
)
for each category
of age ( i ) & sex ( j )
ratio between more (3) &
less (1) educated
weighted
by sex & age category
mesure inequality between extreme education groups at equal age and sex category
2002, 2008
2008
Model Evaluation
3 objectives to minimize :
Obj 1. : MSE sum for random scenario
Obj. 3 : The difference between social inequality in mobility scenario and in simpler scenario
Exceptation ?
obj1
obj2
obj3
Obj. 2 : MSE sum for mobility scenario
min obj. 1
min obj. 2
high obj. 3
Preliminary results
| Random locations | Survey-based locations | |
| Night only (ie. residence) | Scenario 1 | |
| Night & day | Scenario 4 |
| Parameter | Mechanism | Value |
|---|---|---|
| Interaction | Spatial Interaction | 0,5 |
| Reward | Behaviour-Opinion | 0,5 |
| Inertia | Opinion-Behaviour | 0,5 |
| Switch Proba | Opinion-Behaviour | 0,5 |
| Constraint | Opinion-Behaviour | 0,2 |
Social Ineq.
Day_Slice
% Healthy
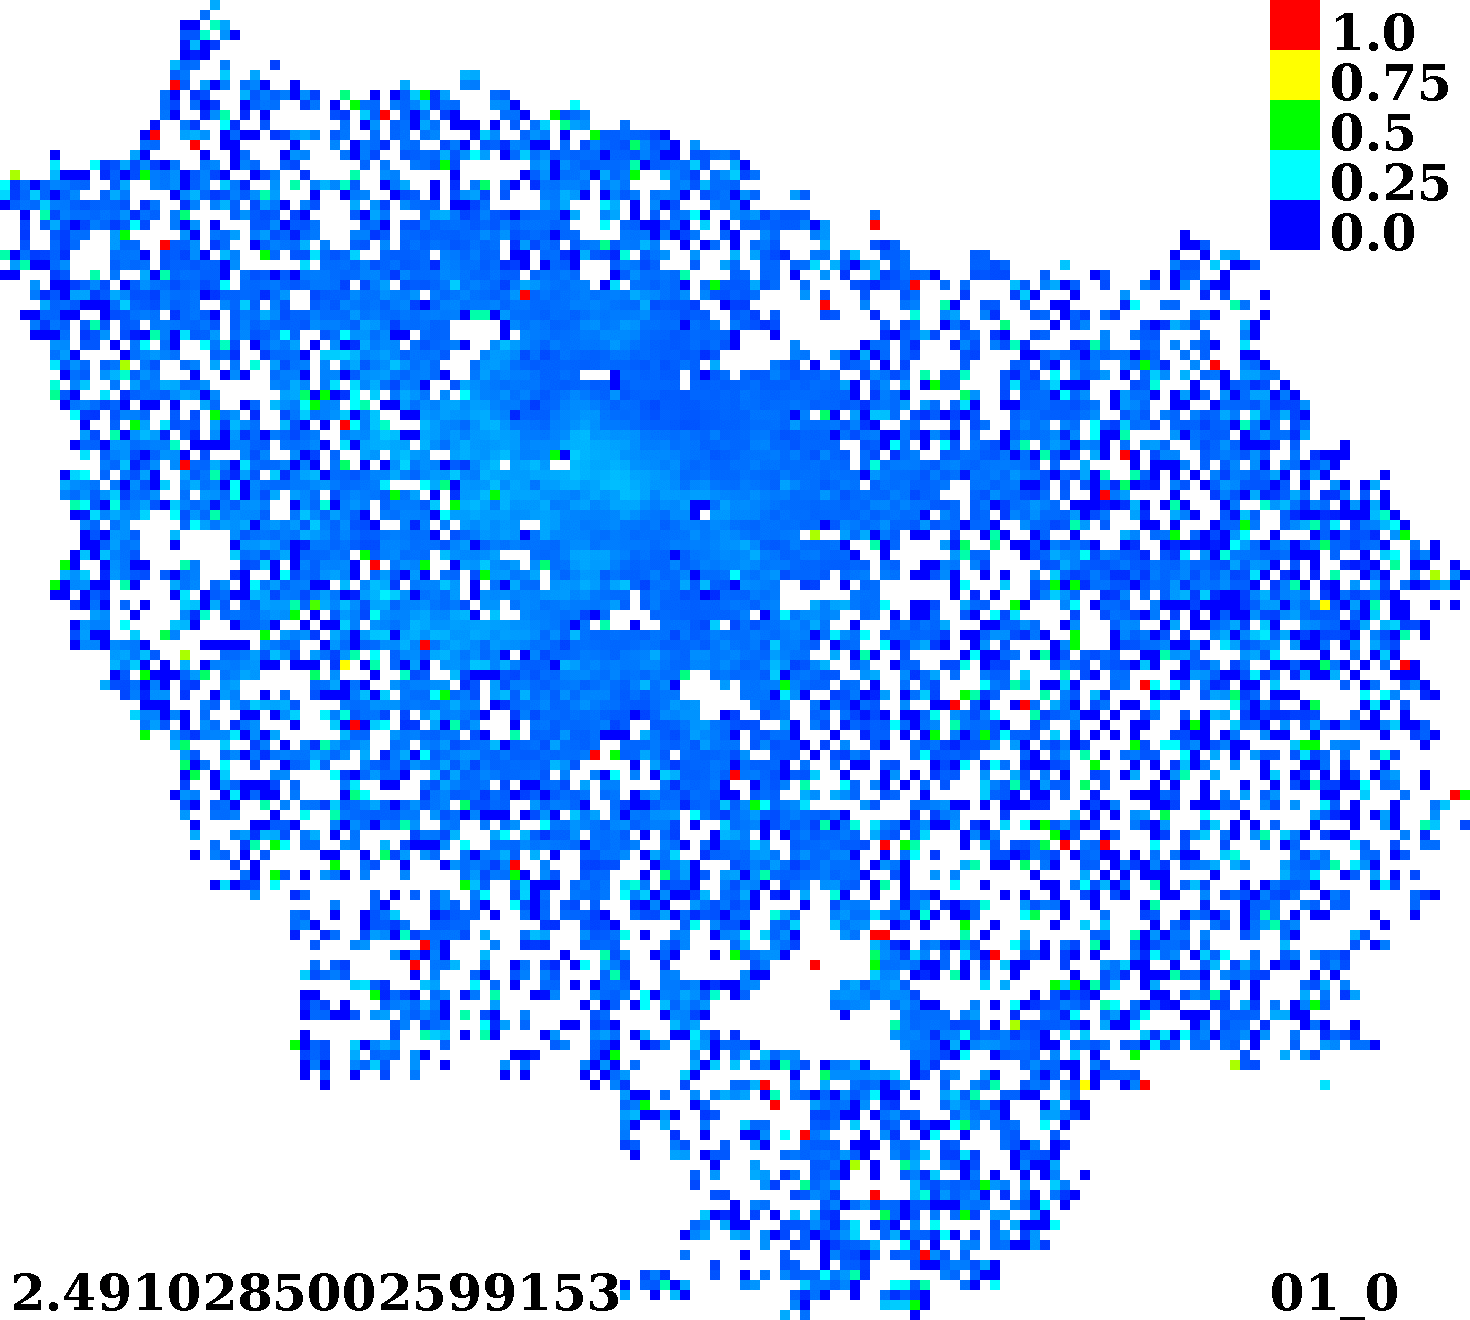
% Healthy
Day_Slice
Social Ineq.
Conclusion & Perspectives
An original approach in (health) geography
An inter-disciplinary team with challenges in each domain :
- thematic point of view
- data analysis : EGT, nutrition, etc.
- in software engineering : ~ 8 millions moving agents !
- in exploration : High Performance Computing with dedicated evolutionary algorithms
- in epistemology : Validation of realistic model ?
Thank you!
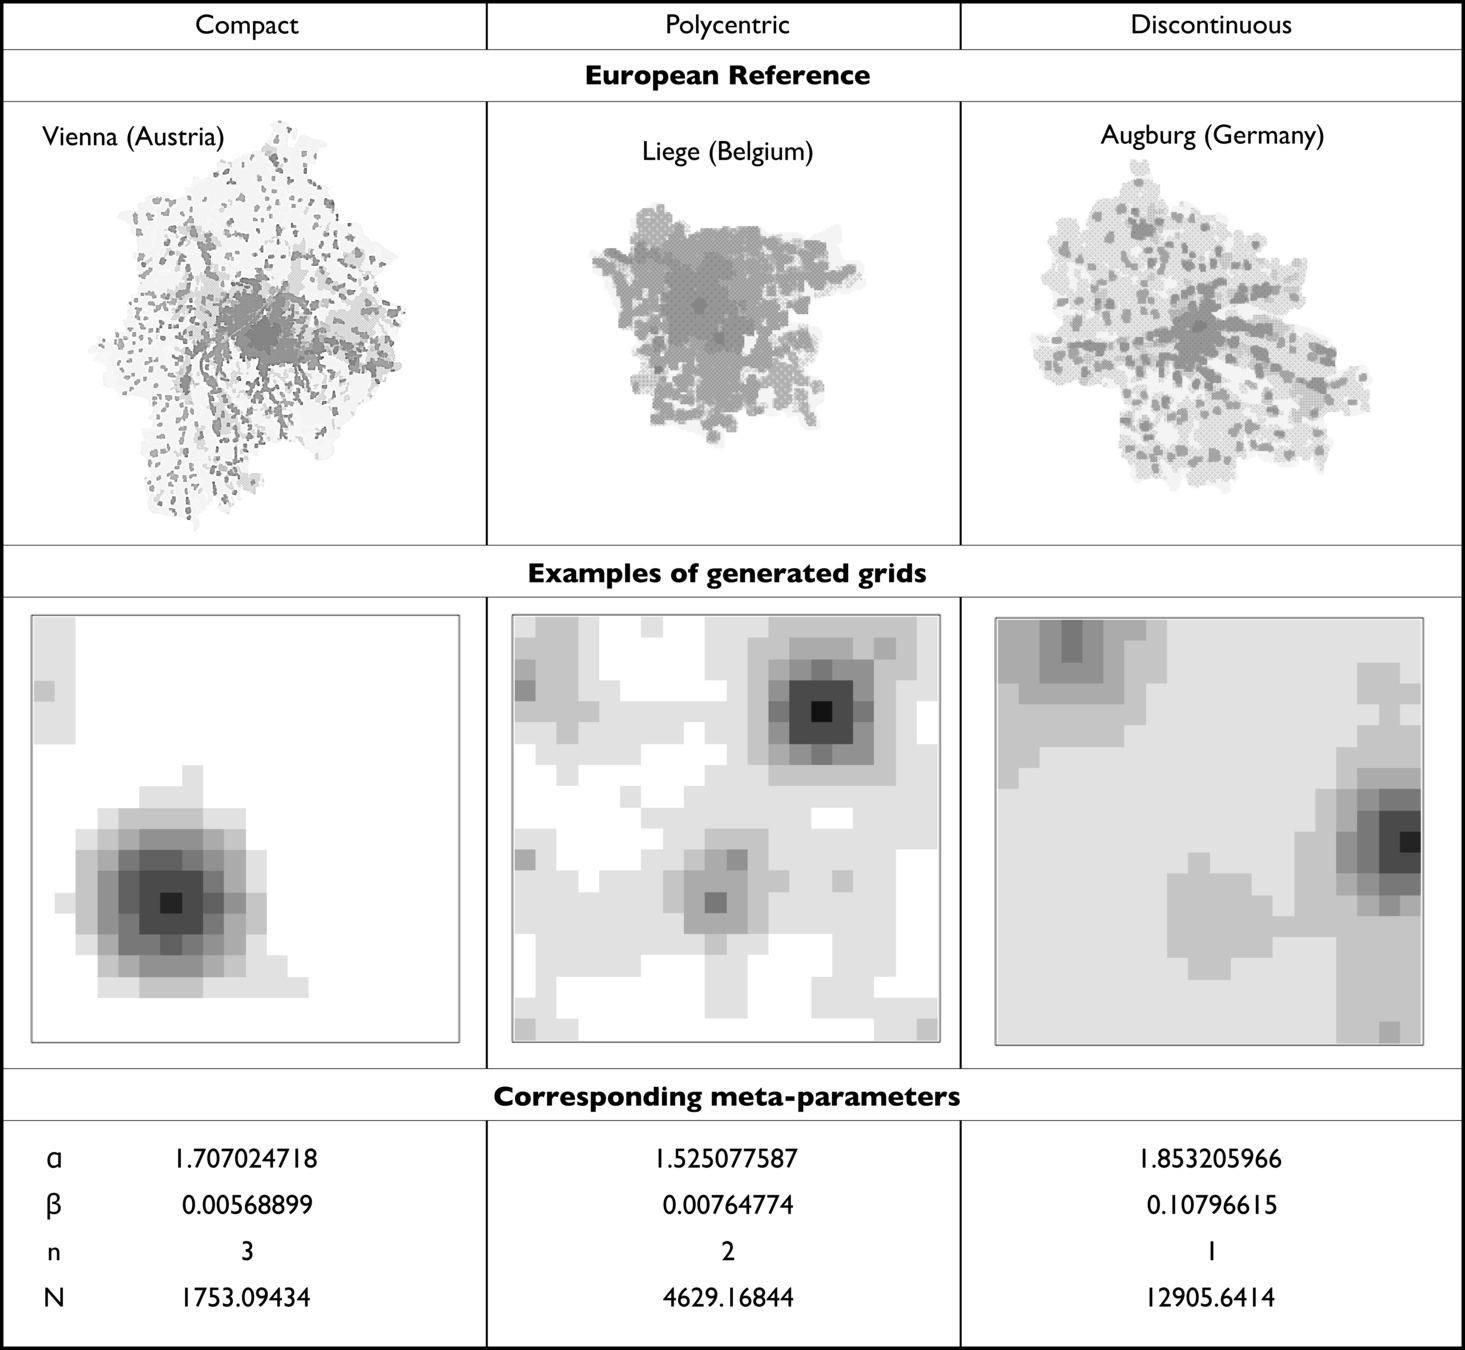
Bonus 1: Synthetic Population Generation
Bonus 2: Formal Model
if i is unhealthy at time t
otherwise
if i is unhealthy at time t
if i is healthy at time t
Free parameter
= number of constraints of agent i
= agent
= interacting partner
= cell
= switch probability
Bonus 3: Switching mechanism