Travellersim Redux
An Experiment in Resuscitating Twenty Year Old Code
Shawn Graham, Carleton University
Pedro Trapero Fernández, Universidad de Cádiz
shawn.graham@carleton.ca || scholar.social/@electricarchaeo || slides.com/shawngraham/tsr

my friends all have awesome data and all I've got is this lousy distribution map
or

archival photo, SG at CAA 2006 (or at least, it felt like this).
- What TravellerSim asked/answered
- Rebuilding TravellerSim
- Or, I've forgotten an awful lot (SG)
- Replication vs Reproduction
- Comparing TravellerSim with an ERGM
- new inspirations/questions? (PTF)
- Applying both to a new situation
- Spain, Guadalquivir region
Original Model
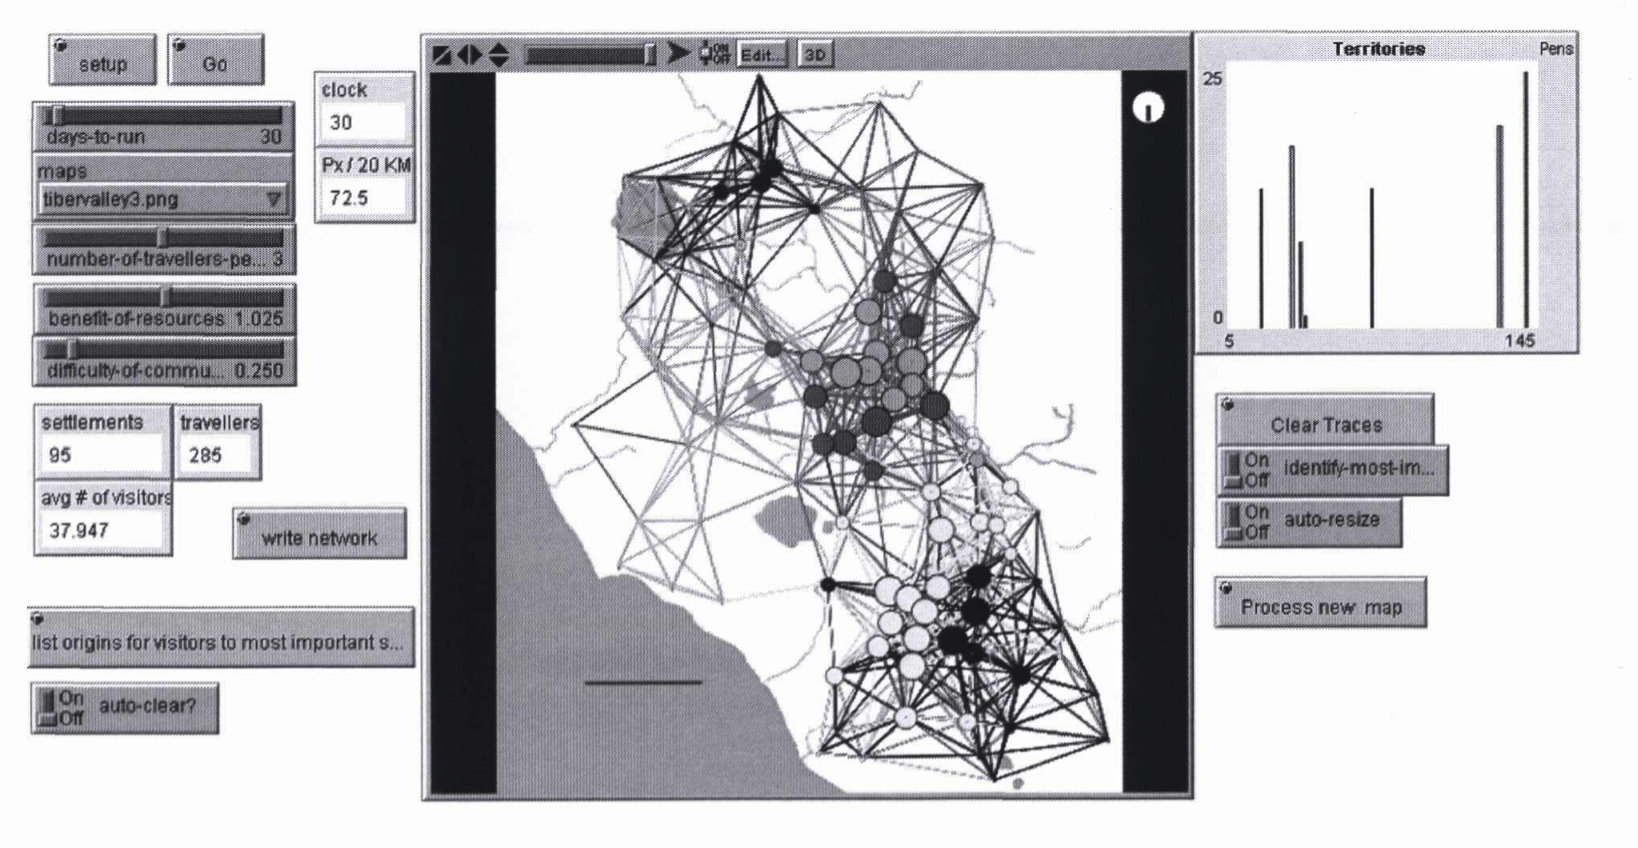
- Wanted to understand the emergence of territories; wasn't much a fan of Thiessen Polygons
- Netlogo 3.1
- Simulated actual movement across a map
- Map digitization via wacom pen
- Kludging the geographic information
- Used Rihll-Wilson dynamic settlement growth equation and a cultural diffusion (color-sharing) mechanism
- Validated it by reproducing Rihll and Wilson's 1991 results with some caveats
- original code here
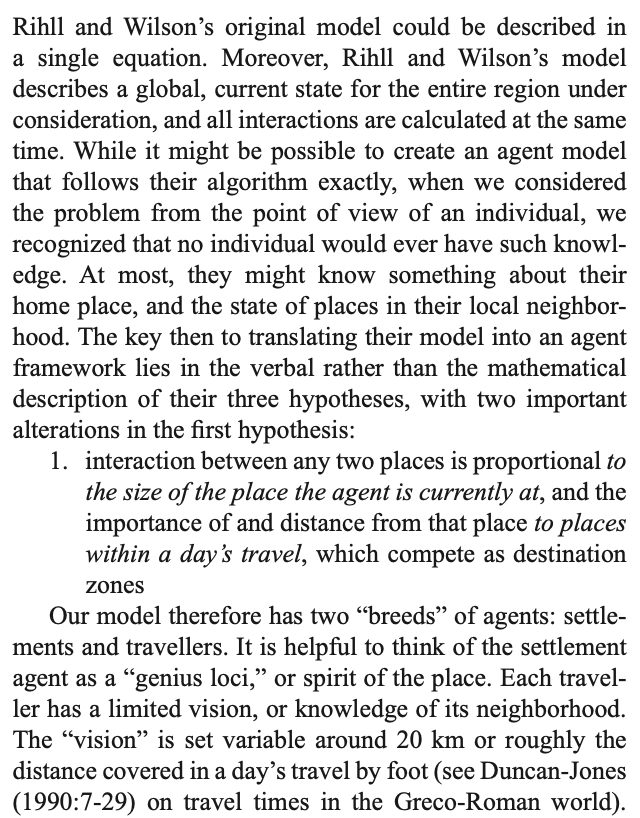
This is what language models were made for
Language models are word calculators
Language models' core technologies are neural networks built for semantic translation
Language models already ate Travellersim years ago.
"I see you're trying to update Graham & Steiner 2006..."
The strategy for updating the code
- write in pseudo-code, to replicate the original paper's goals and understanding
- translate one function at a time; add functions cumulatively to the process
- cross-check syntax across language models
- for the most part, used local models via Jan/Ollama on a Mac Studio M3, or Carleton local models.
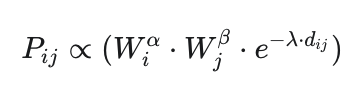
Rihll & Wilson's gravity settlement model into Netlogo
There are 28 Netolog versions between 2006 & 2026, including 4 major complete rewrites.
Current version of netlogo is 7.0.4
Original (2006); rewrite (2026)
importance of origin site
importance of destination site
last bit is the cost of movement
...which combined gives the probability of a traveller moving
ifelse is-turtle? destination1 or is-turtle? destination2 or is-turtle? destination3
[ let templist [ ]
  let x1 [importance] of destination1 ;; ~ R + W's 'attractiveness of site j'
  let y1 distance-nowrap destination1
  let z1 0
  ask destination1 [set z1 length visitors ;; ~ R + W's 'k value for site j'
                    if z1 = 0 [set z1 1]
                   ]
  let score1 (( x1 ^ benefit-of-resources) * (e ^ (- (difficulty-of-communications * y1))))
             / (z1 ^ benefit-of-resources) * (e ^ (- (difficulty-of-communications * y1)))
if any? potential-targets [
let choice rnd:weighted-one-of potential-targets [
(([importance] of origin ^ alpha-exponent) *
(importance ^ beta-exponent) *
(exp (- distance-decay-lambda * (distance origin * meters-per-patch))))
]core function
Replication, reproduction, robustness, oh my
replication vs Reproduction
Reproduction: same analysis + same data → same result
Replication: same analysis + different data → same result
But is it Robust?
Robustness: same data + different analysis → same result
Generalizability: different data + different analysis → same result
things get complicated, which is why you don't often see people trying to replicate or reproduce other people's studies.
...it looks kinda the same; broad patterns seem to reoccur as in 2006...
But SG06 didn't publish the resulting generated network files, so... at best, we can call this a quasi reproduction
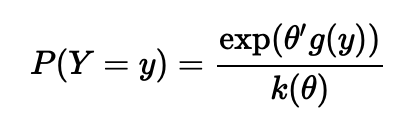
Can a different class of model return results that match the 2026 implementation of Travellersim's gravity model mechanism?
Or the probability of a given network shape is a function of various network features
Decision to try this inspired by Brughmans, Keay, and Earl 2014 on visibility networks in Roman Spain
- Same starting data as the original Travellersim
- Specify likelihood of various network features
- Monte Carlo Sampling to see which arrangements of connections therefore most likely
...enter the ERGM
How about Robustness?
Do structural social rules (ERGM) and economic gravity (Rihll-Wilson) produce different regional hierarchies on the same landscape?
- ERGM give us plausible 'social' networks from the site distribution
- Gravity model is more of an economic network
- Where these two models disagree might therefore be interesting in that these places indicate tension between the two ways of understanding space
Experiment
- Run the ERGM for 9000 iterations to allow burn-in
- For each site, record the average in-degree and betweenness centrality etc over the last 1000 iterations
- Run the Gravity model until it stabilizes (measuring for stigmergy).
- Measure for how the two models diverge
- Compare against an archaeological network.
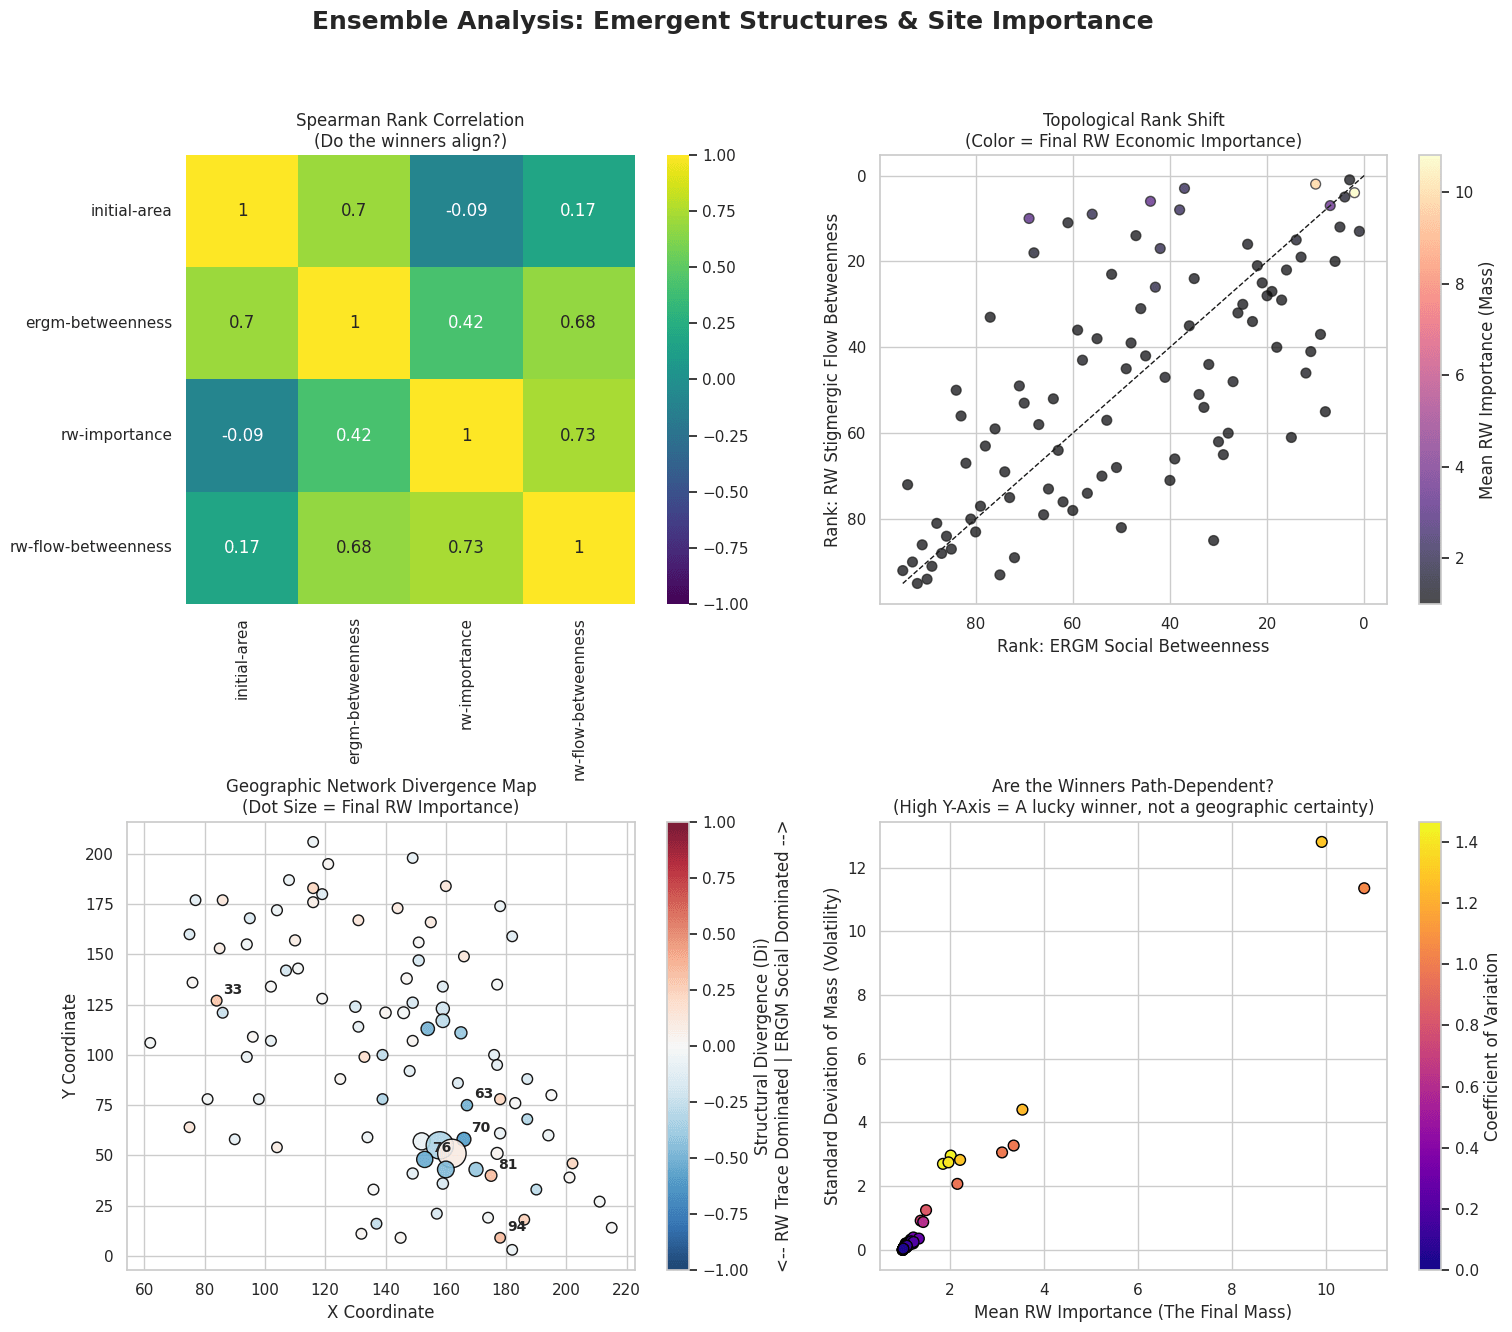
test one: can the two models produce the same network?
test two: do local social structures (ERGM: peer-to-peer ties, community cliques) create a different hierarchy than Model 2's economic gravity
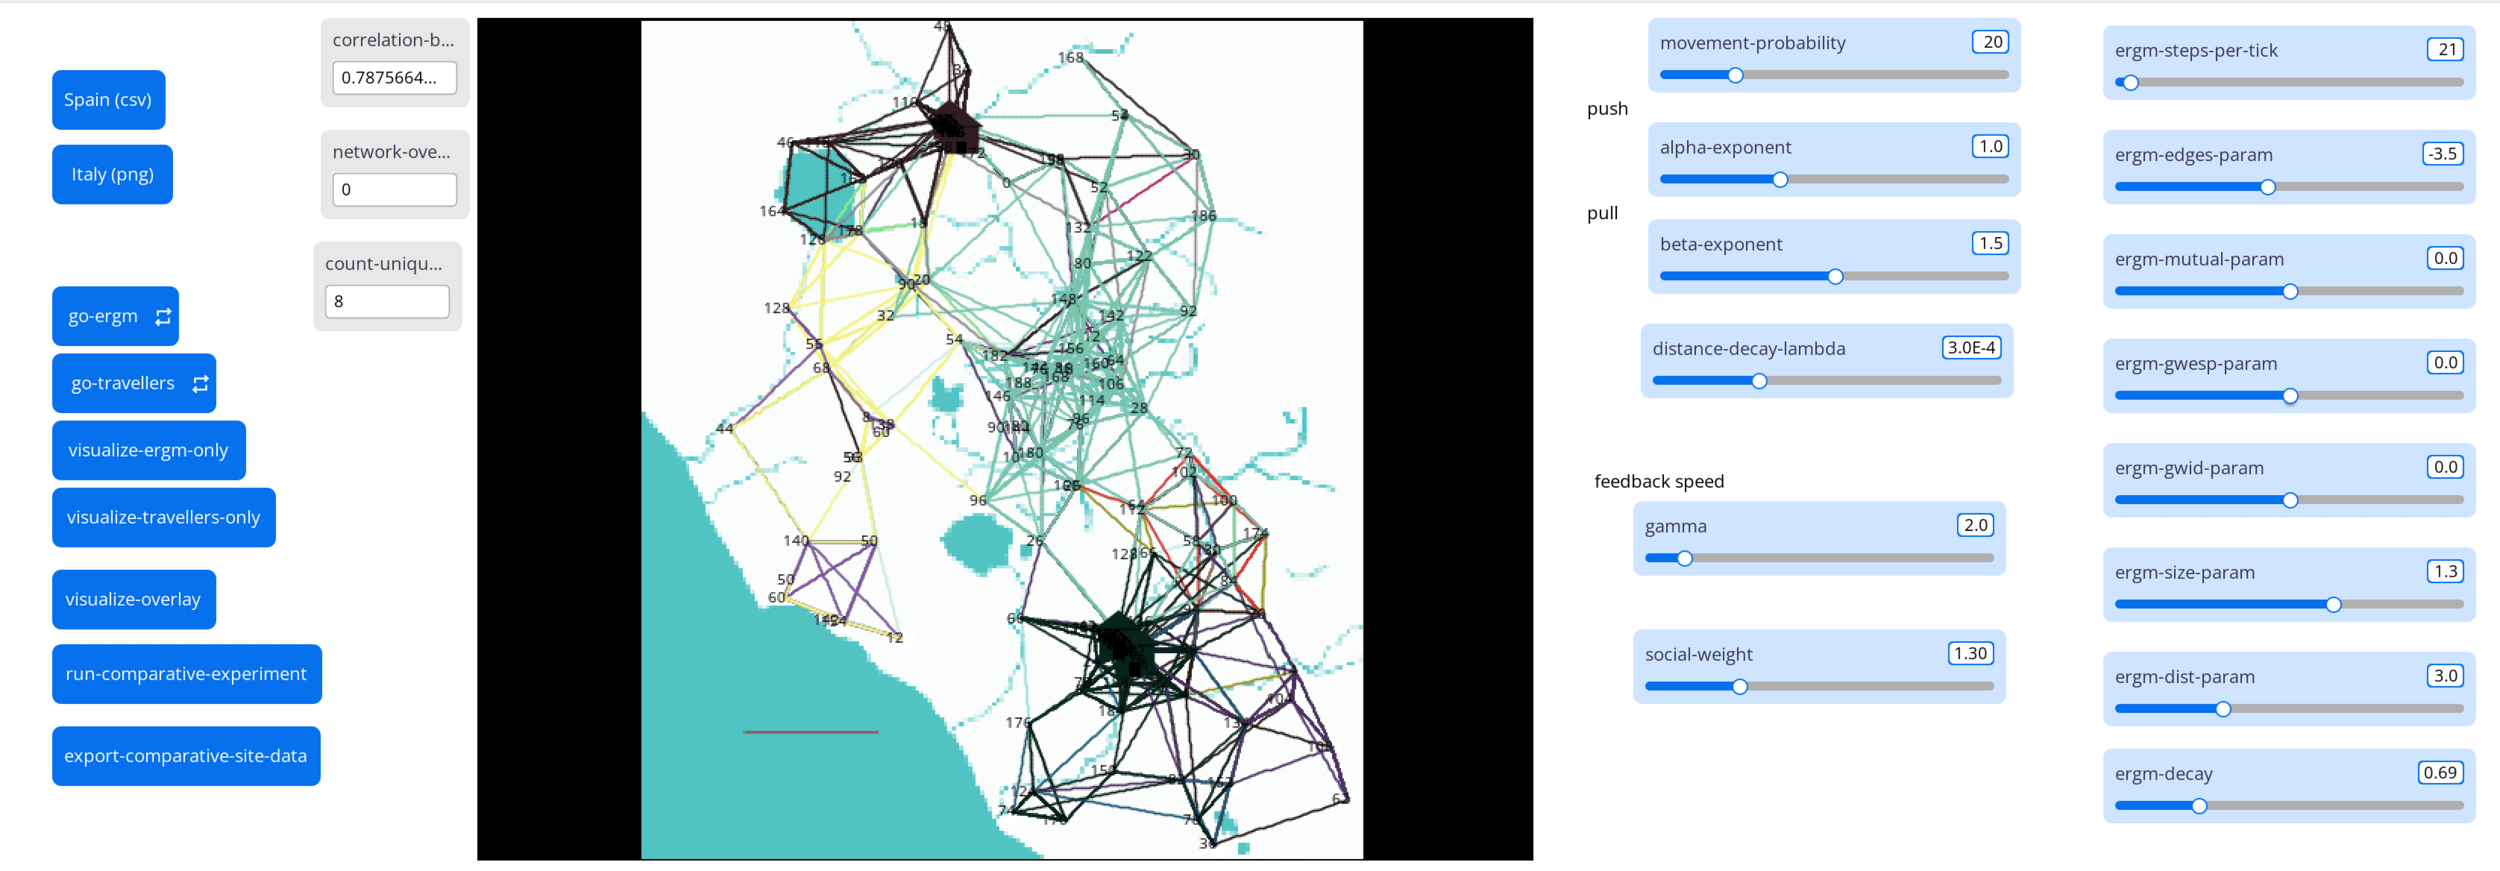
- but to make sure we're comparing apples to apples, first sweep behaviour space to find a small-world system in both. (dealing with equifinality)
- ie "assume that Roman social/geographic networks are small-worlds:
- We have two different theories (Social vs. Economic) that can both successfully build a Small World.
- If we force them to do so, do they use the landscape in the same way?" <- not a LLM prompt btw
Rome, Veii, confluence of the Anio / Tiber
suggests geographic determinism underpinning layout shape, regardless of model
Geography
gives us shape,
but not winners
RW travellers and where they end up
tighter this is, the more geography overrules social
Gravity vs Social Structure
Tiber Valley
...so, we've now reproduced the original work, and we've replicated it to a degree, insofar as is possible given the very poor data sharing practices of the 2006 version of SG.
...the use of a different model on the same data: and we've kinda shown there's a bit of robustness.
replication vs Reproduction
Reproduction: same analysis + same data → same result
Replication: same analysis + different data → same result
But is it Robust?
Robustness: same data + different analysis → same result
Generalizable: different data + different analysis → same result
compare against a completely different process
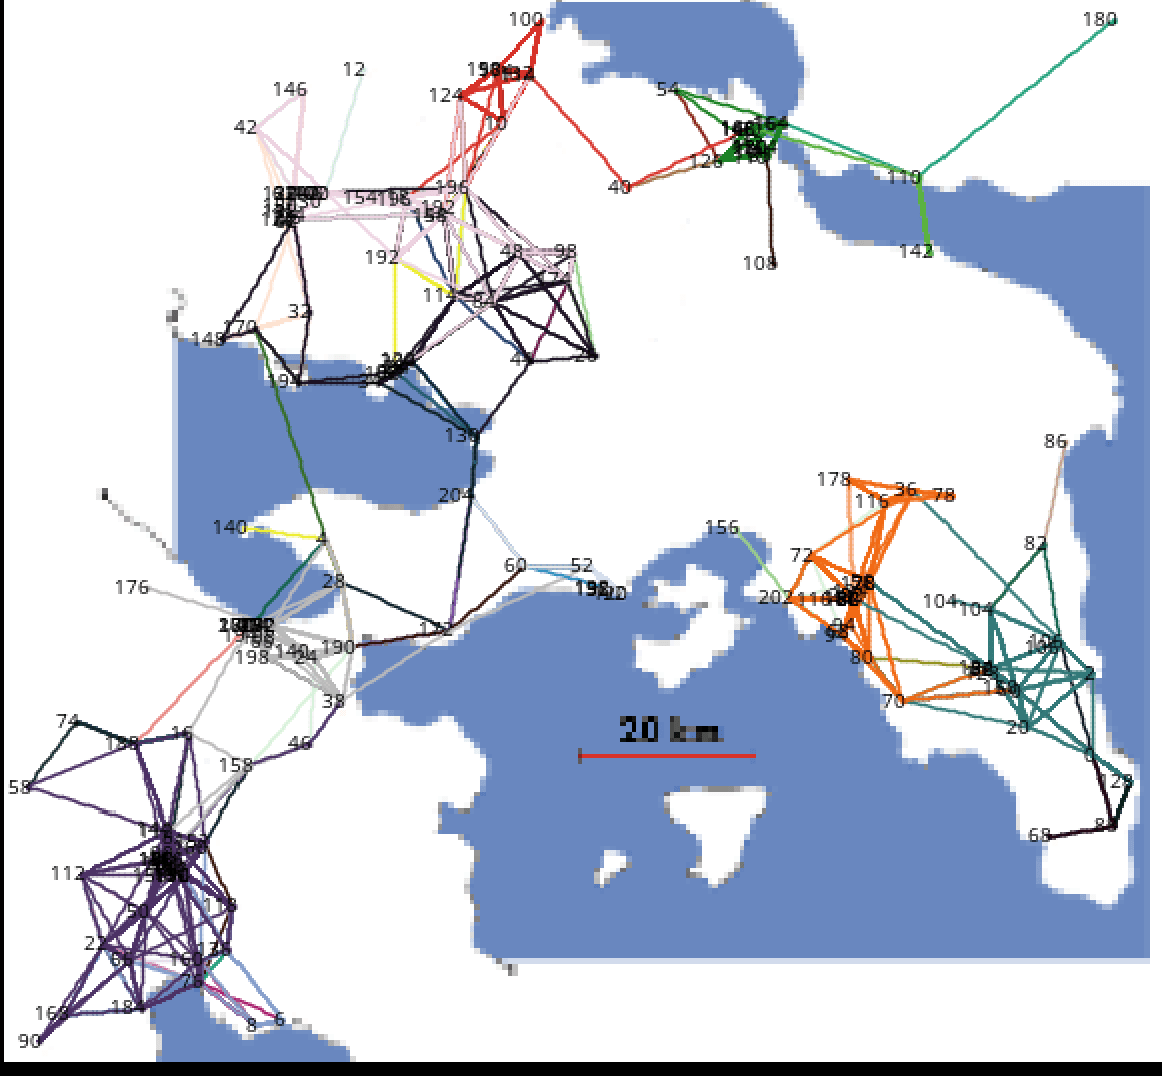
Gravity Model + Italy: 2026 version seems to reproduce 2006 results
Gravity Model + Italy versus ERGM: seems to complicate 2006 results
Gravity Model + Spain, ERGM + Spain → ??
...did I mention this is all still a bloody mess of files on my machine? A work in progress...
But.
If we can accept that Travellersim (2026 version) with its gravity model and ergm mechanisms seem to be surfacing something, then we have a tool for exploring other places.
Maybe.
Let's find out!
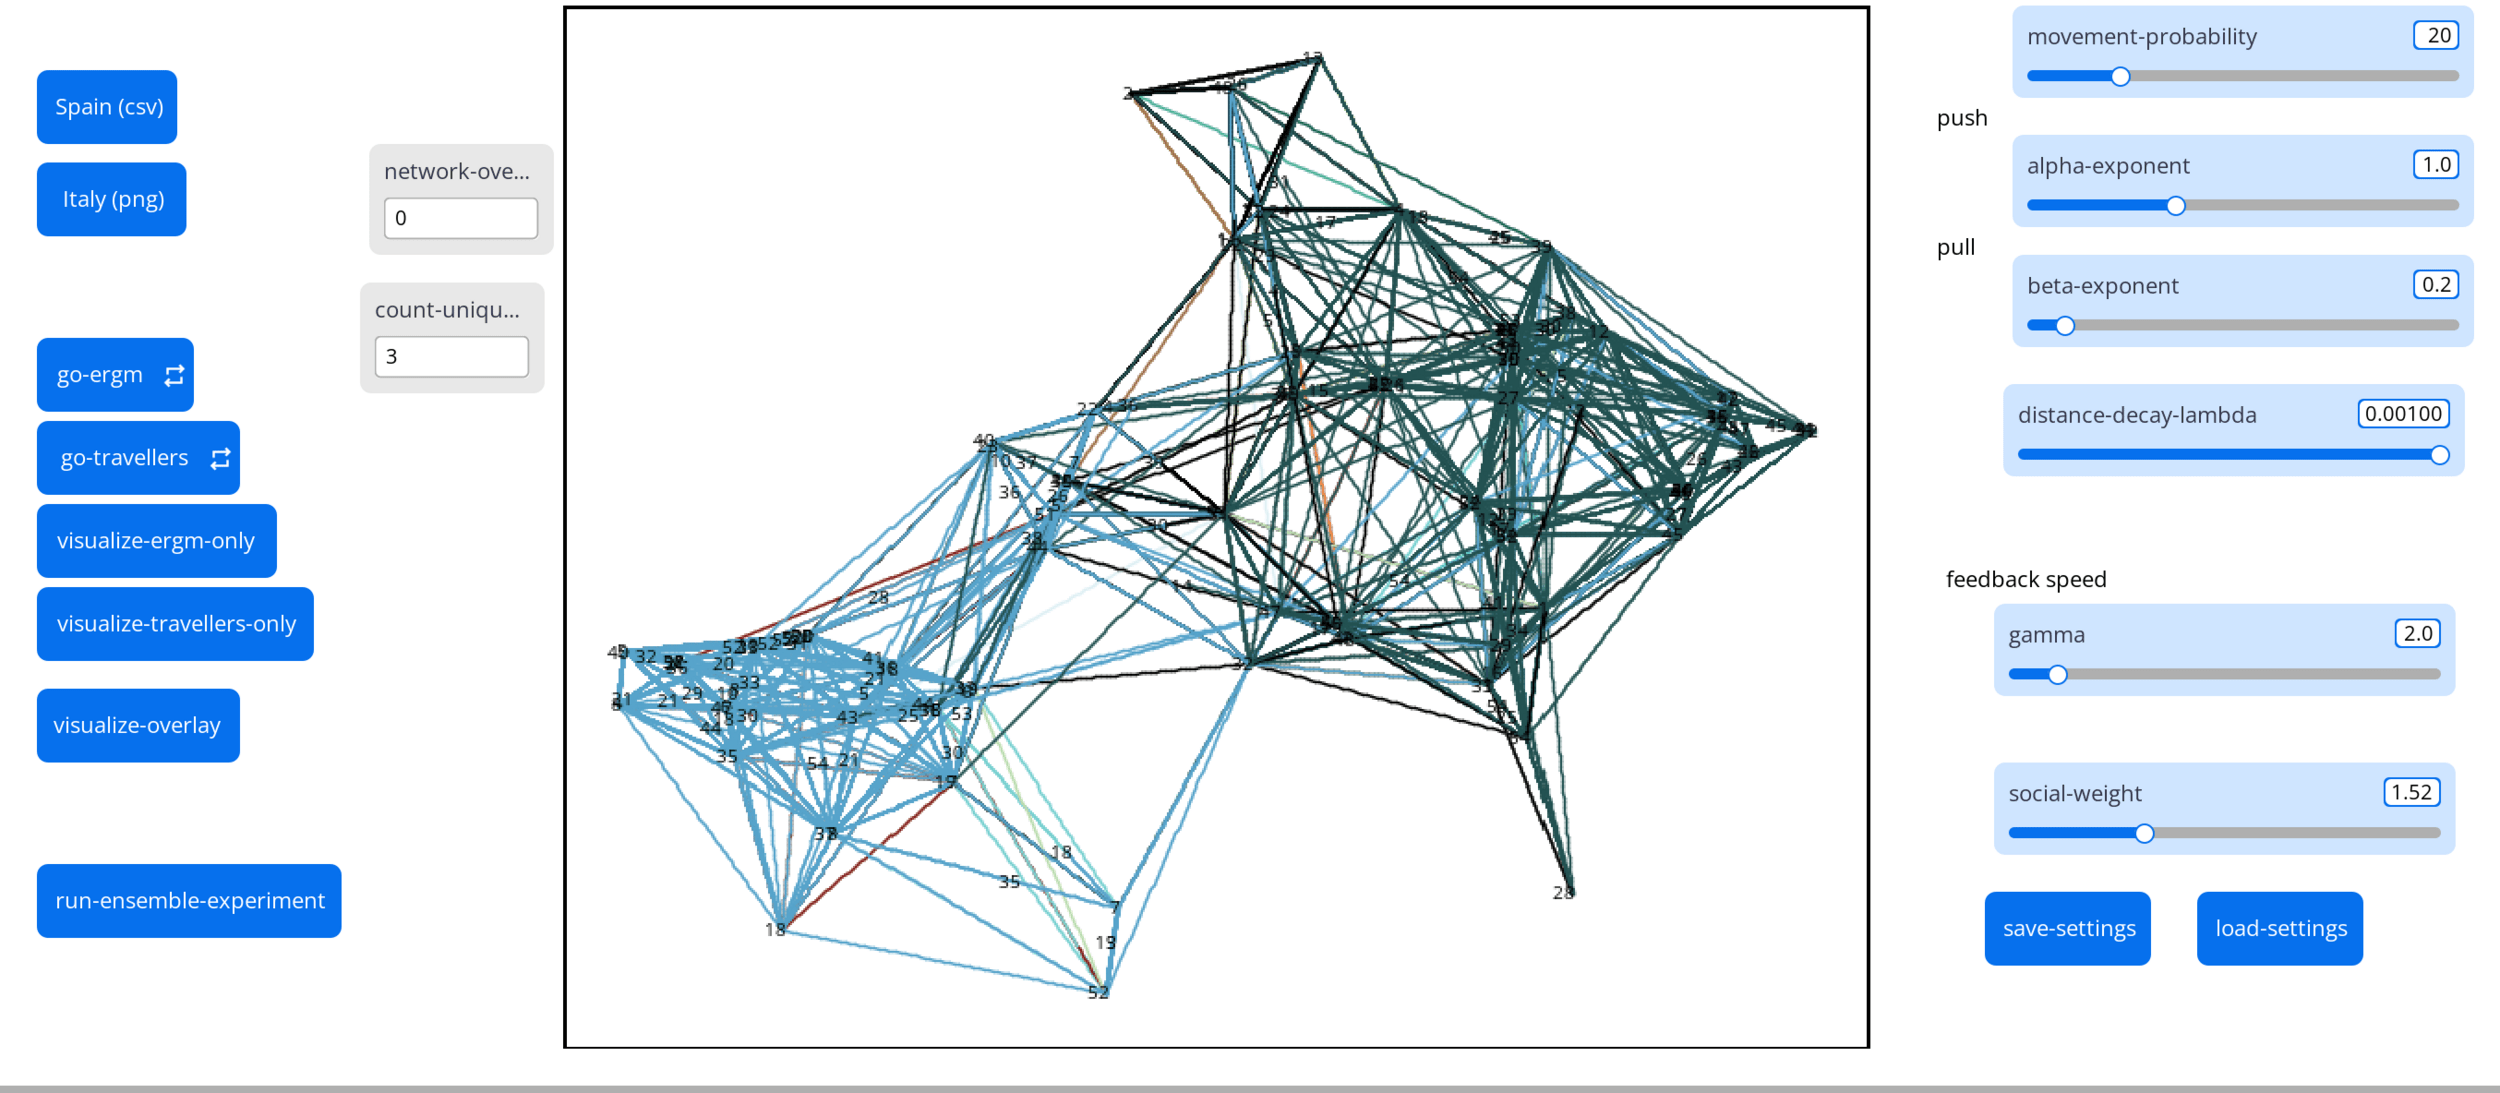
Guadalquivir
- because this is a smaller area than the Tiber Valley, we increase the distance decay to represent 5 km worth of 'working day' travel (rather than a day's worth of linear travel)
- we sweep parameters again because of equifinality, so that we have most comparable model hyper settings
- we ask the same two questions again
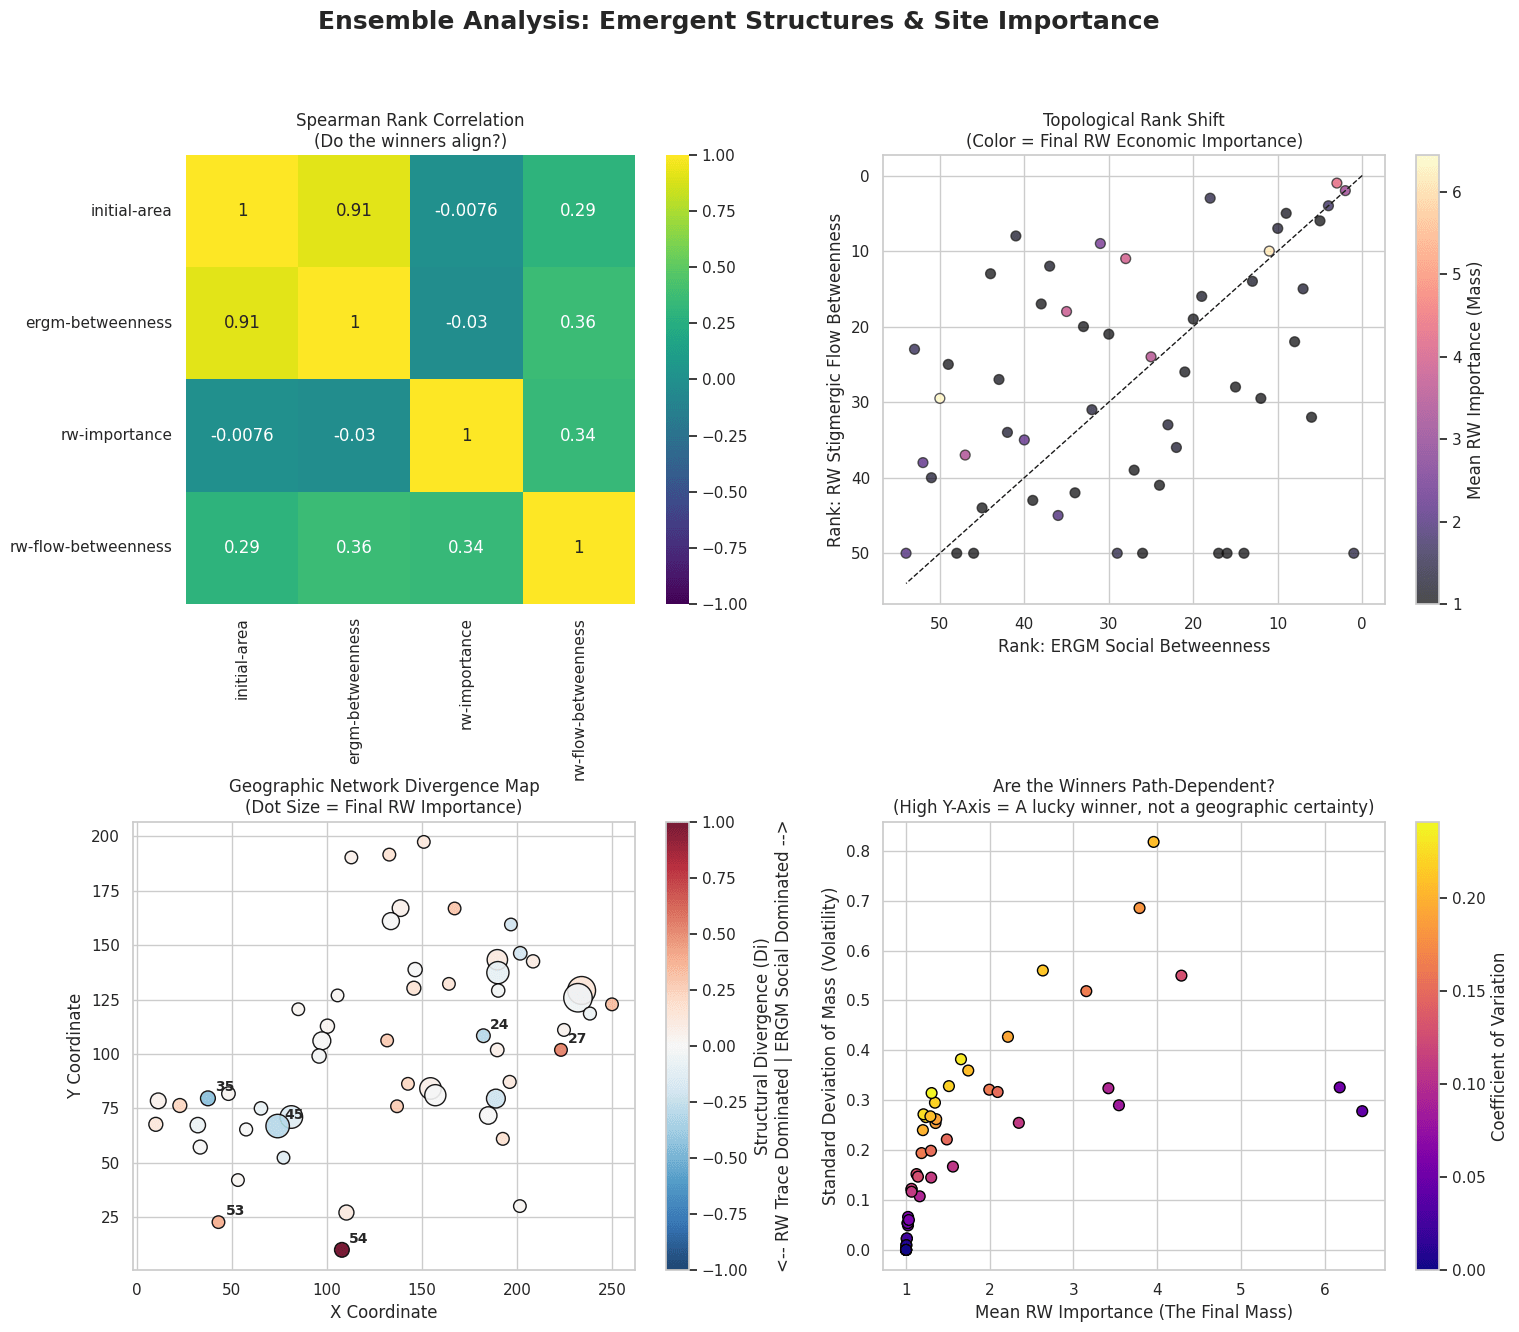
Plot Twist!
We do have archaeological data to work with!
Presence/absence counts of artefact types across the sites.
-
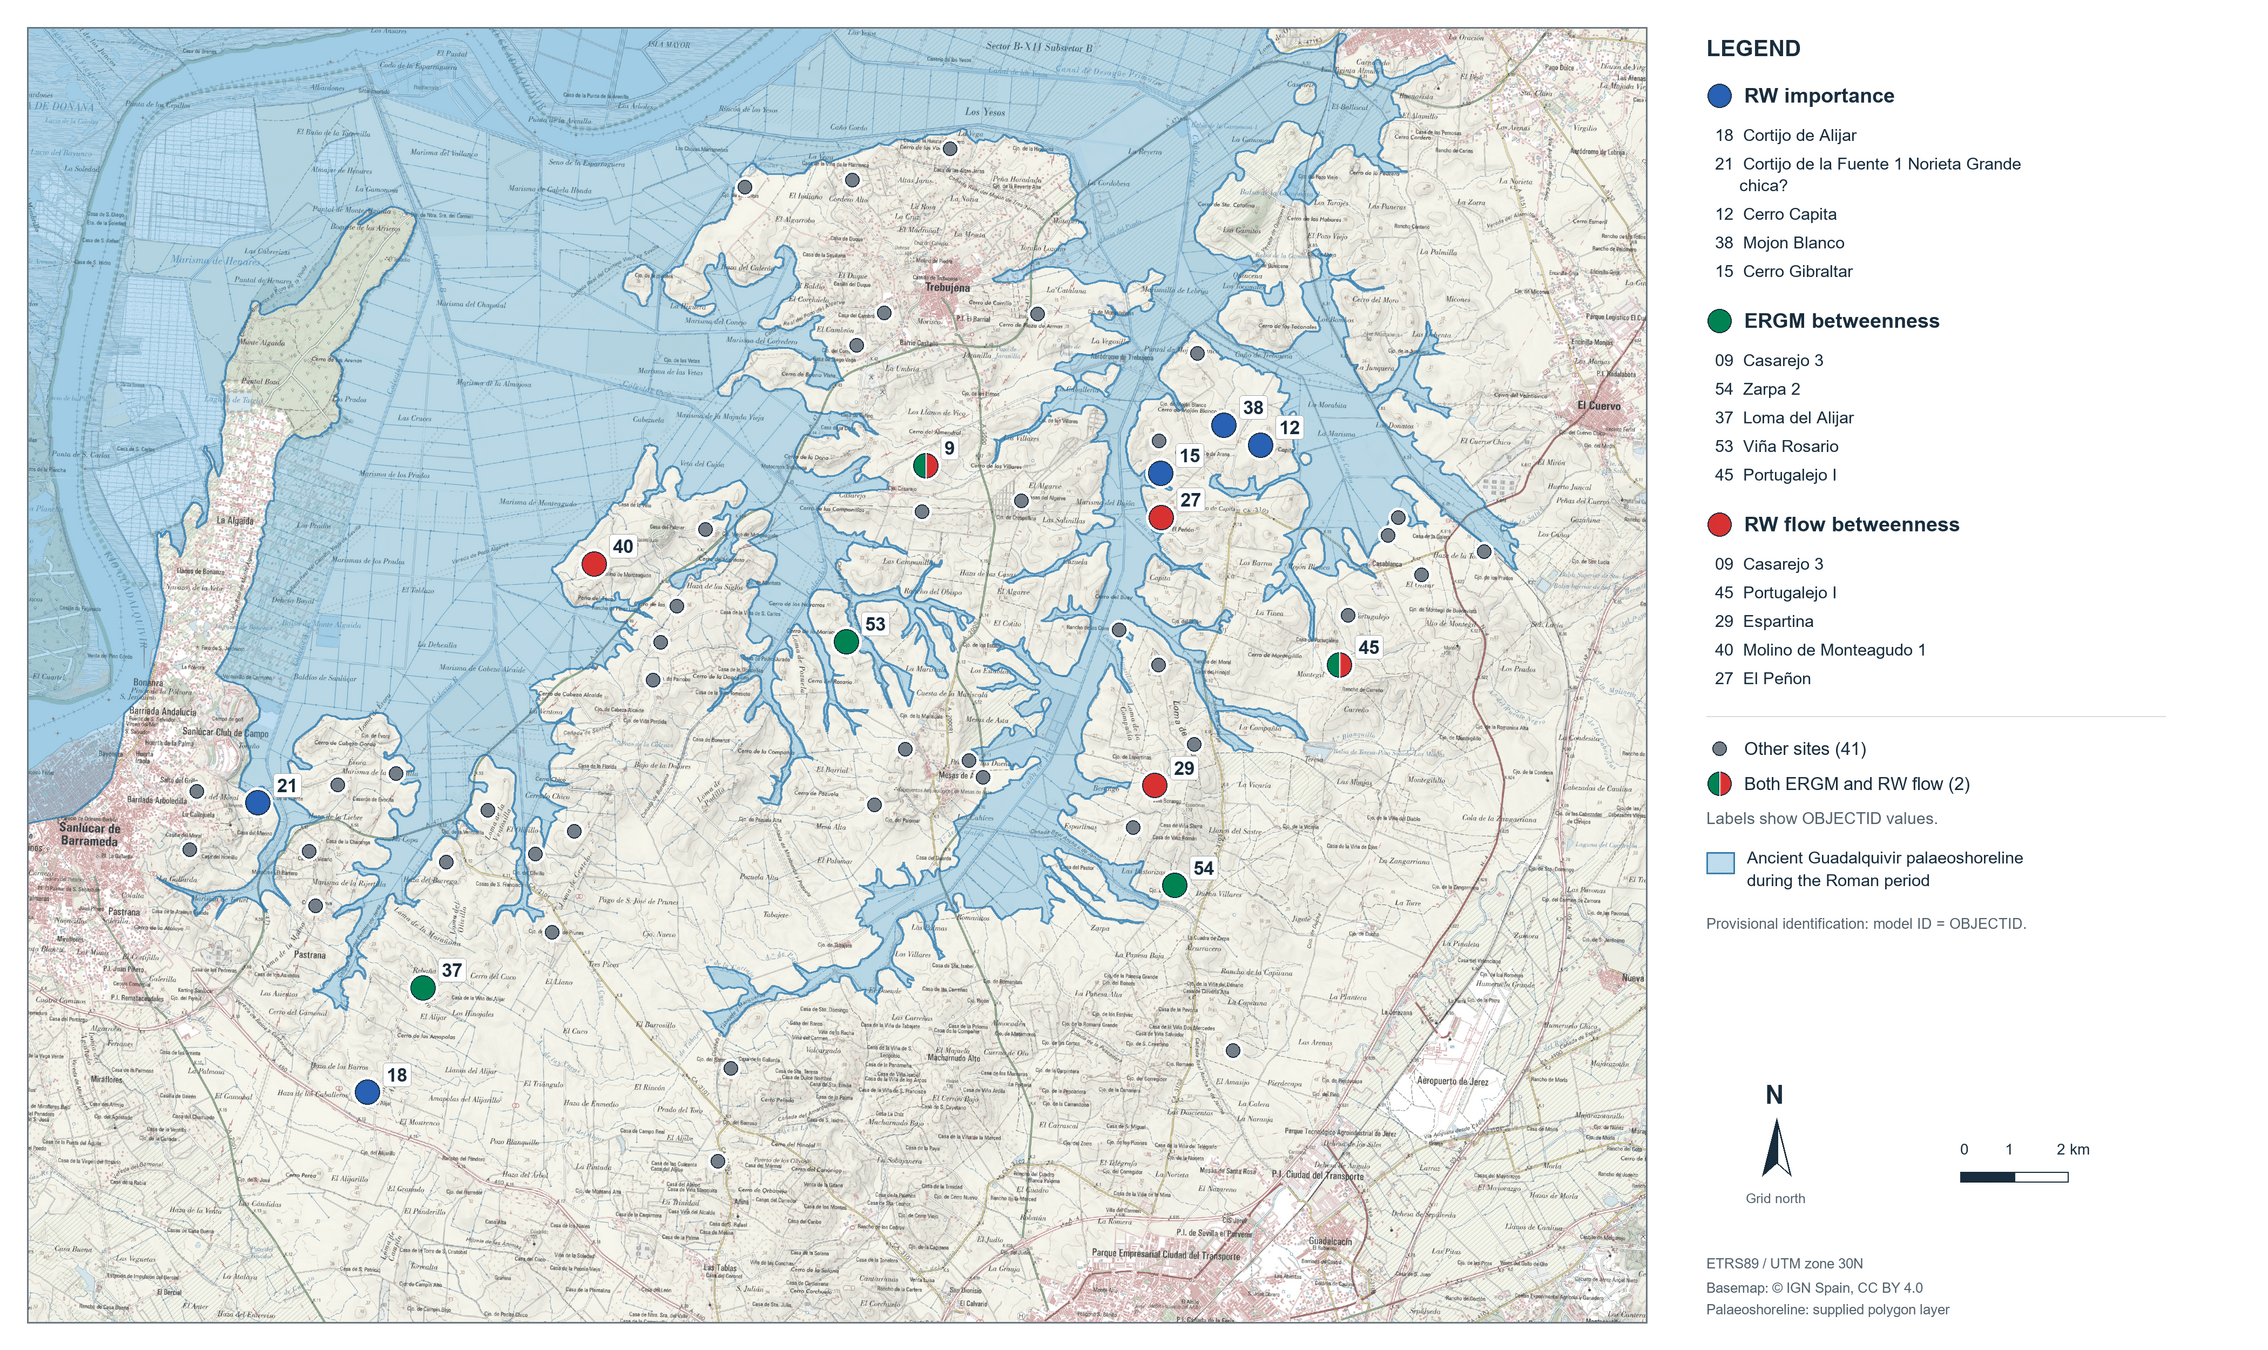
The models suggest some sites as 'important' (various measures) where archaeological materials would seem to agree ie 12, 15, 38
-
The two models draw attention to the positionality of certain sites like 45 and 9, which may be mansio-type intermediary places
-
But if we chose 'importance' via traditional archaeological measures, these sites would not necessarily stand out
-
-
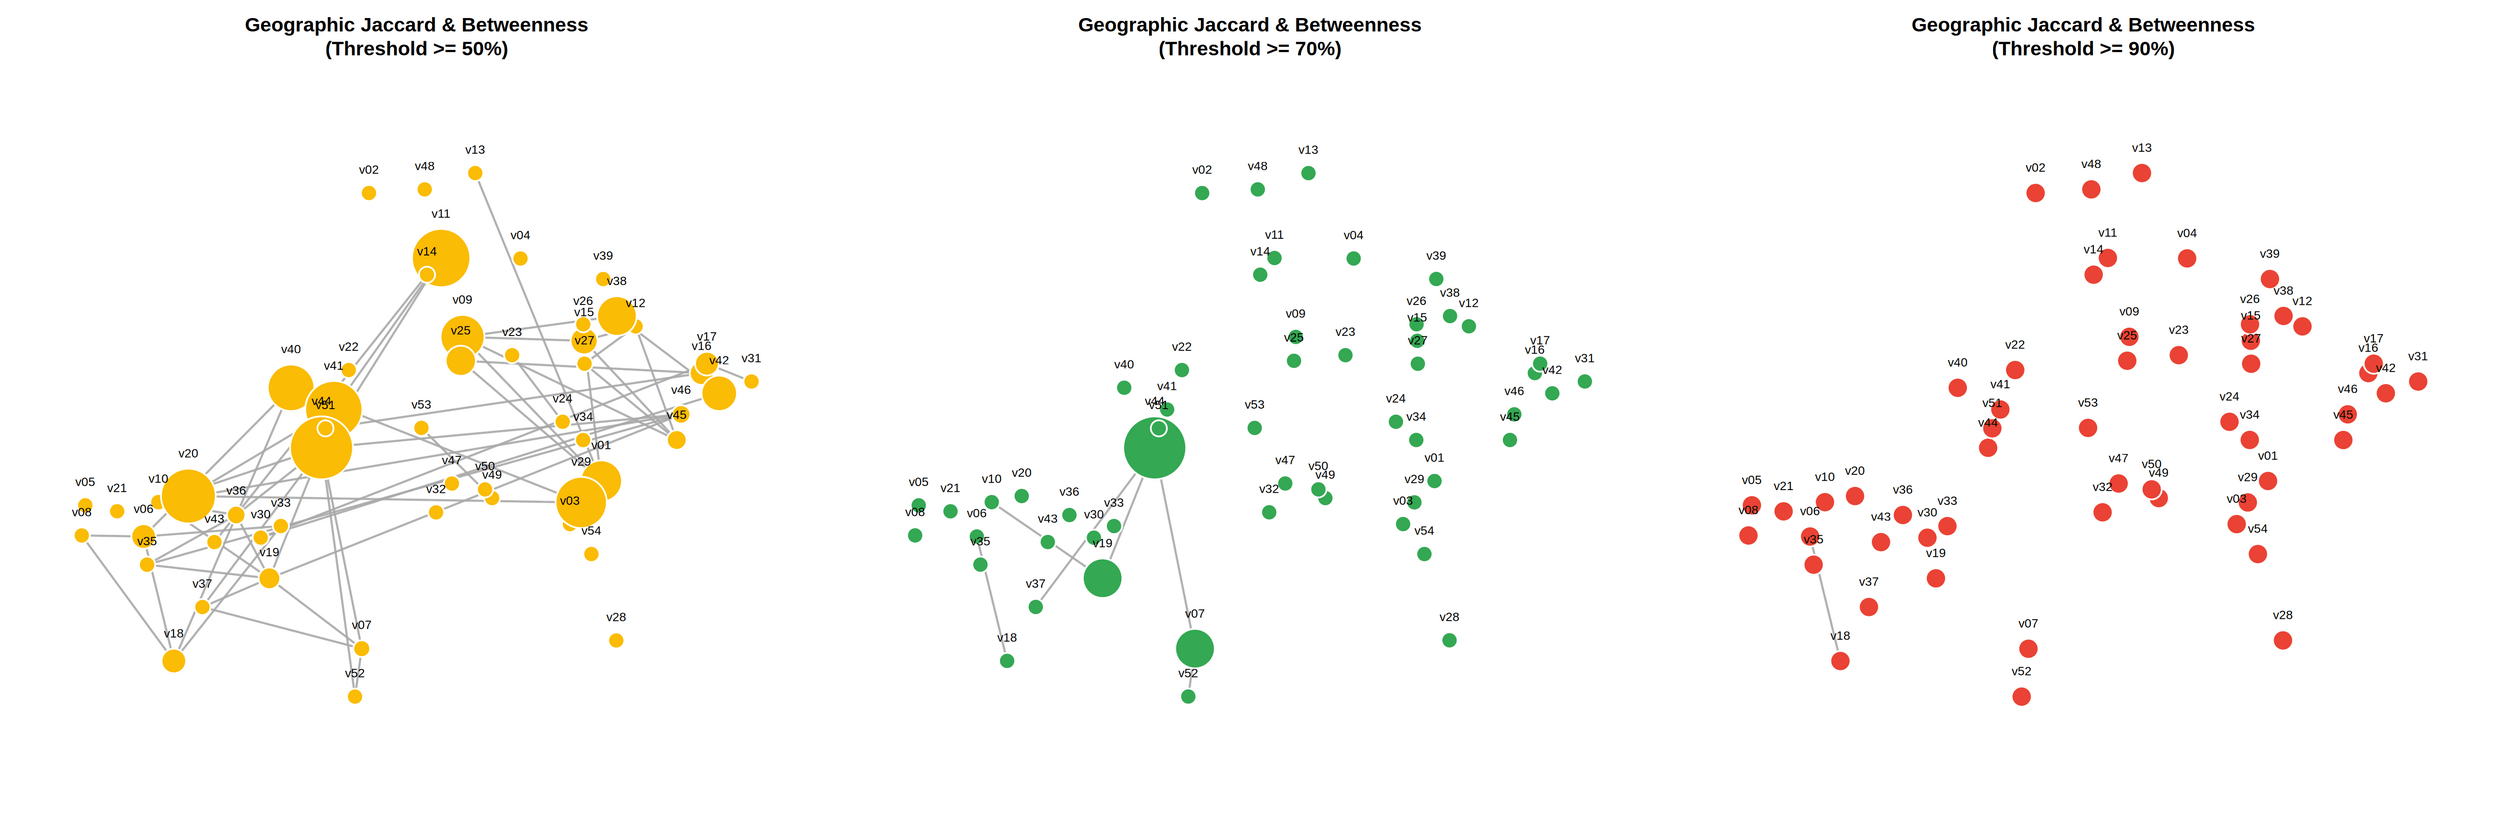
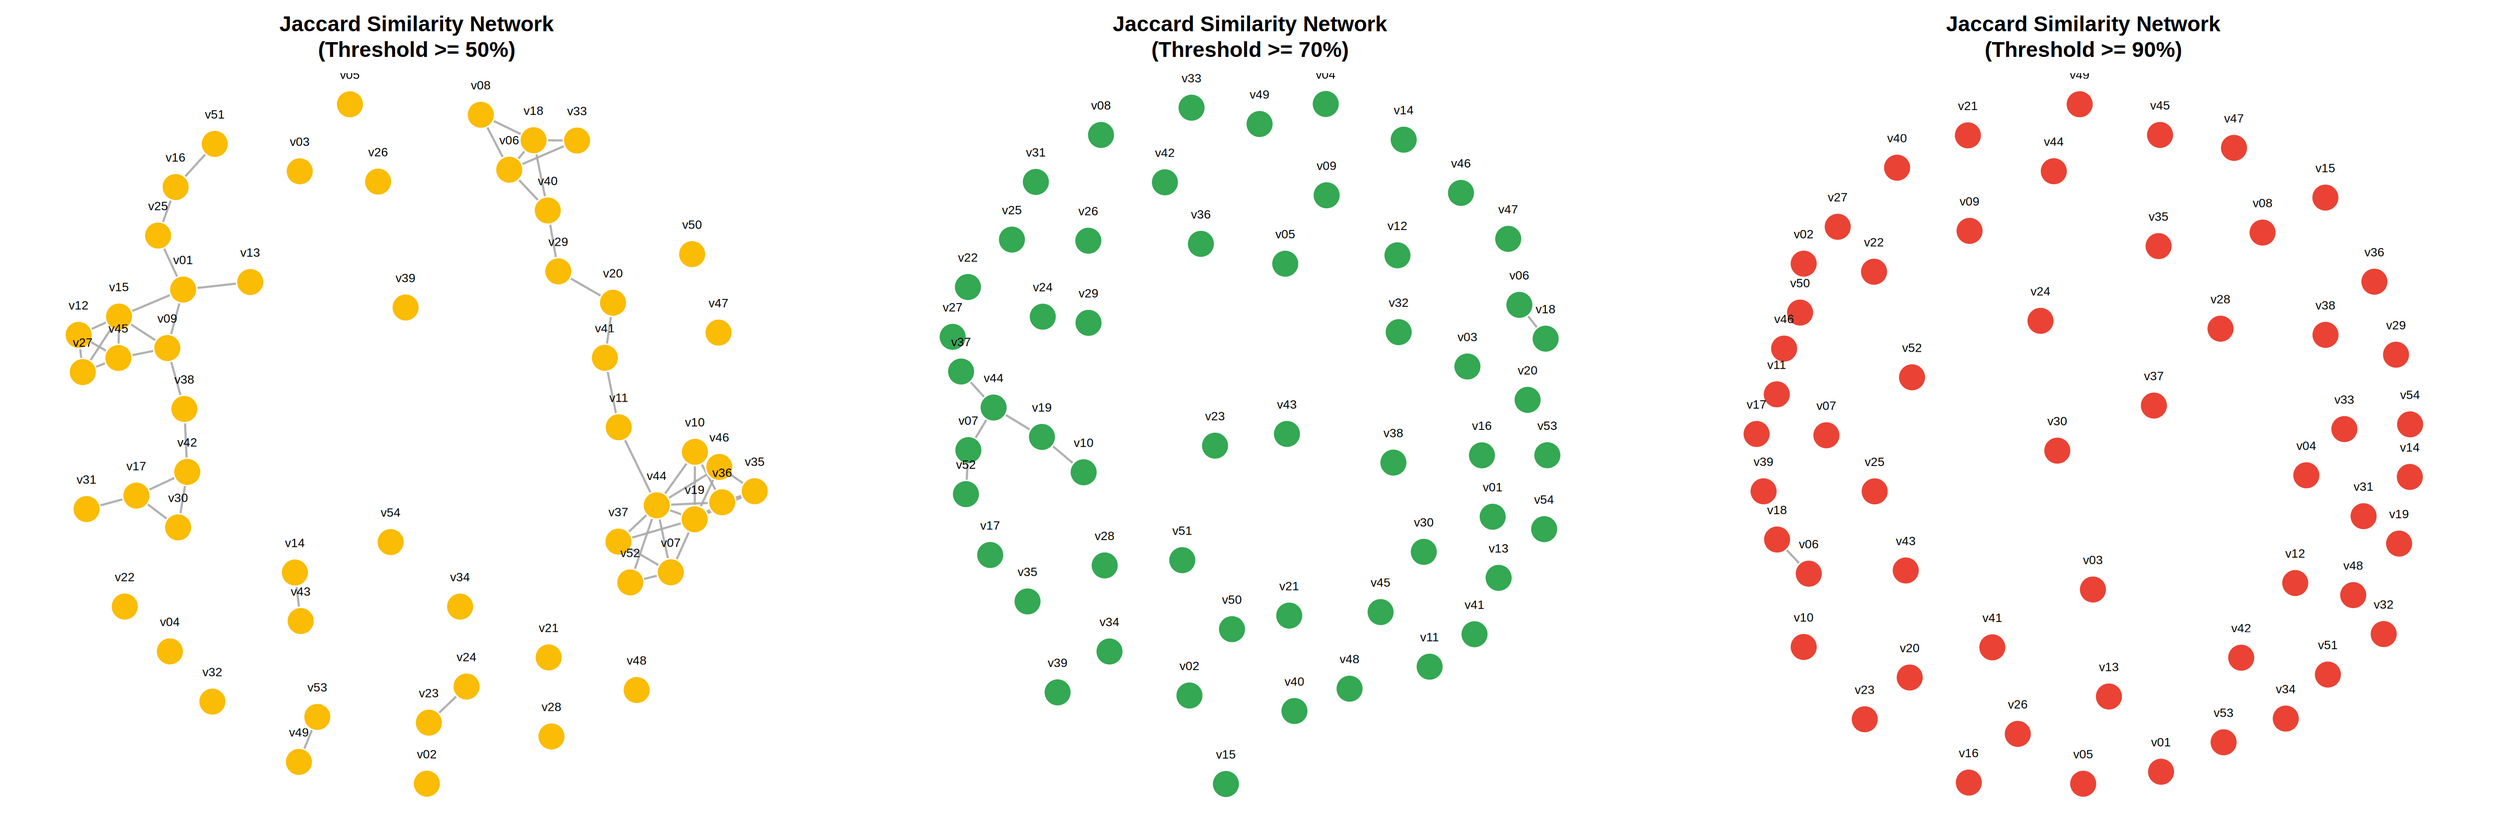
Which perhaps implies that structural measures and archaeological richness are not necessarily functions of similar things
Structural Importance != Archaeological Importance?
Plot twist!
Jaccard similarity, plotted against geography, nodes sized for simple betweeness
-
Guadalquivir dataset does not include full range of site sizes: how would the gravity model / ergm change when these places are added (ports, city of Hasta Regia, near 54) - Travellersim original data is from the protohistoric period when sites like eg Rome are not all that differentiated from other possible important places.
-
Guadalquivir data is just villas - what happens when the full range of rural settlement is included? It might confirm that villas are villas partly from functional/structural positioning - if we did not already know which sites were villas, could the model help us identify which sites are most likely to have performed comparable roles? Could it identify supposedly minor sites as possibly major, thus directing fieldwork efforts?
Experiments for the future
-
Deploy the models against another dataset from another region: are the patterns observed here specific to this landscape or do similar structural behaviours emerge elsewhere in the Roman world?
-
This would make it possible to compare not only two territories, but also the effects of changing the composition of the network within each territory: villas alone; villas plus major settlements and specialised sites; and a much broader rural settlement dataset including minor sites.
-
And with new code, data shared as csv, and the underlying simulation well-documented, commented, and up-to-date, the work becomes reproducible, replicable, and robust.
Experiments for the future
- reproducing and replicating the 2006 study in 2026 seems to produce similar results (but can't be directly compared because 2006 SG didn't provide enough data)
- deploying a different model against the same data seems to underline the complex intersection of geography & society; geography is important, but we can tease out social
- deploying the reproduced/replicated/robust model suite on new data shows that we can generalize to other times/places and produce results that can cause us to look at our data in ways we haven't before
- digital archaeology / digital humanities is a kalaidescope, not a microscope
Conclusions

- It's not enough to share data
- It's not enough to share code
- It's not enough to share metadata
- paradata, or the decisions about manipulating the code, the choices about encoding, the deep comments on why this value and not another, etc - must be shared as well, the glue that makes the rest make sense.
Useful networks can be generated using ABM or other modeling approaches
Multiple models against the same data can be compared
Networks from archaeological materials can be used as a kind of control.
Conclusions
thank you!
shawngraham.github.io
Some Messy Details
ERGM: Exponential Random Graph Model. Assumes that spatial networks are driven by social rules balanced against physical distance
Gravity Model: Networks emerge from non-linear economic feedback loops
Stigmergy: indirect coordination through the environment
Time: in ERGM, it's static; the model searches for a stable configuration. In Gravity model, it's dynamic and path-dependent (early events compound later structures)
Space: in ERGM, it's considered globally, where the model calculates between any two nodes to convert to probability reward/penalty. In Gravity, it's a physical friction navigated locally
Mechanism: in ERGM a Markov Chain Monte Carlo approach proposes adding/removing ties, which are evaluated against target structural parameters. In Gravity, agents use a retail gravity formula to choose destinations; these leave stigmergic traces; settlement importance is updated dynamically, and the more visitors balanced triggers rich-get-richer feedback loops, which colours the map through influence (visitors from important places are more important than from lesser places).
Distribution Maps & Netlogo
- Geometric central Greece - digitized by hand in 2005 to reproduce the maps used in the original Rihll and Wilson model
- Protohistoric Italy - digitized by hand in 2005 from an amalgamation of maps published by Cifani (2003:149-150), Smith (1996:240), and Potter (1979:54). See Graham and Steiner 2006: 55
- Guadalquivir - data courtesy of Pedro Trapero Fernández
Netlogo can read CSV files; the best way to share such data then is a simple table using easting and northings to give the site location, with whatever numeric data in columns to use for starting conditions. The 2026 Travellersim model can read both csv and image data and scale appropriately. In the case of image data, it reads for pixels of a particular colour value to work out the scale of the image. This is a left-over kludge from the abilities of Netlogo 3 and not recommended for future work.
A future iteration of Travellersim Redux will only read csv data, and use image files only for cosmetic background. An alternative approach might be to code in Python for the Mesa ABM package, or to develop a plugin approach for something like QGIS.
Comparisons
To compare models, use flow betweeness (traffic bottlenecks) for the gravity model and social betweeness (topological bottlenecks) for the EGRM.
EGRM is deterministic while Gravity depends on starting conditions; sweeping the model space for both means making sure to start from a list of seeds. Thus if a site is important across all runs, we see something important about the geographic distribution of sites; but if its highly variable, we're seeing path dependency.
Thus, before comparisons can be made, we need to make sure things are apples-to-apples. Both model spaces are swept to identify small world conditions. Then, we the comparison is run, we are comparing two different mechanisms against the same data that should result in the same global large-scale network properties: thus the details can be studied for insight.