All Student Models are Wrong
But Some are Useful
Shayan Doroudi
Data Science in Education Group -- San Francisco Bay Area
October 8, 2018


All Models are Wrong
But Some are UsefulGeorge Box, 1979
Statistical Models of Student Learning
≠
How Students Learn
Sometimes, researchers make hidden assumption that:
Statistical Models of Student Learning
=
How Students Learn
True
Model Class
Fitted
Model Class
Data
Three Scenarios
Semantics of a Wrong Model
Misguided Notion of Mastery
Evaluating Instructional Policies

A+

Background
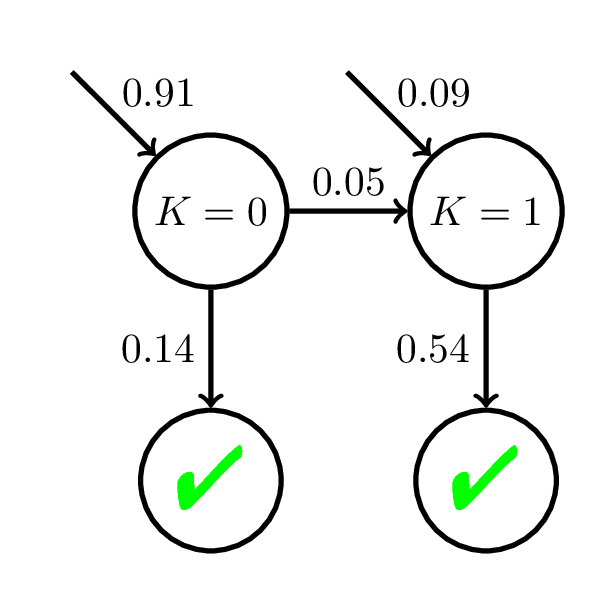
Bayesian Knowledge Tracing (BKT)
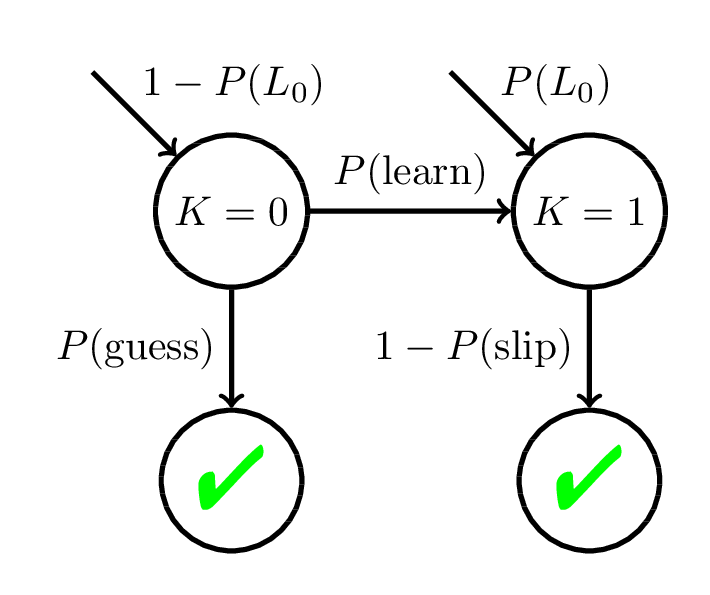
Corbett and Anderson, 1994
Mastery Learning
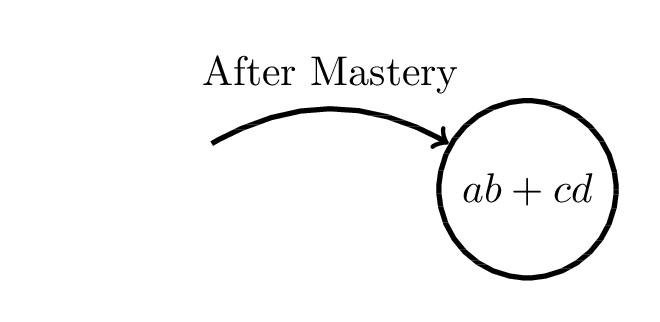

Mastery Learning
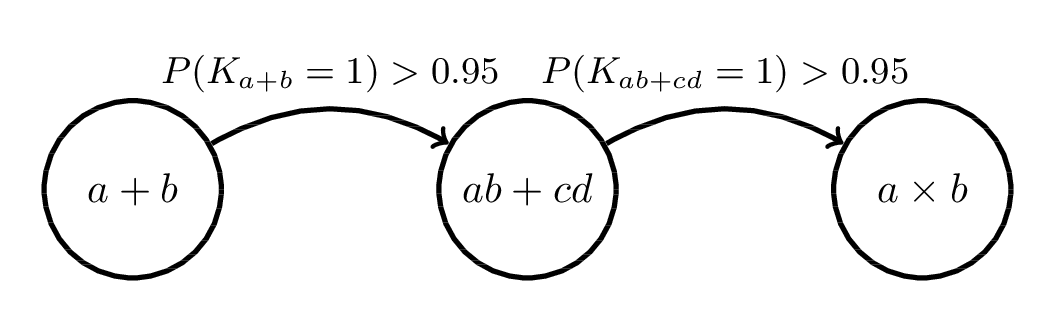
Corbett and Anderson, 1994
Additive Factor Model (AFM)
Cen, 2009

\(\theta\) - Student Ability \(\sim \mathcal{N}(0, 1)\)
\(\beta\) - Item Difficulty
\(\gamma\) - Learning Rate
Model Robustness
Analysis of specification error relates to
a rhetorical strategy in which we
-
suggest a model as the “true” one for sake of argument,
-
determine how our working model differs from it
-
and what the consequences of the difference(s) are,
and thereby get some sense of
how important the mistakes we will inevitably make may be.
Otis Dudley Duncan, 1975
Model Robustness
“True”
Model Class
Fitted
Model Class
suggest a model as the “true” one for sake of argument
determine how our working model differs from [the “true” one],
and what the consequences of the difference(s) are
Data
and thereby get some sense of
how important the mistakes we will inevitably make may be.
Takeaway Message
Semantics of a Wrong Model
End-of-Year Test Score (out of 100)
= \(\beta_1 *\) # Hours Spent on ITS + \(\beta_2 * \) School Budget + \(\cdots\)
Misinterpreting Model Parameters
End-of-Year Test Score (out of 100)
= 2 \(*\) # Hours Spent on ITS + \(\cdots\)
Misinterpreting Model Parameters
So for every hour of tutor use, students test scores go up by 2%, right?
Not necessarily...
End-of-Year Test Score (out of 100)
= 2 \(*\) # Hours Spent on ITS + \(\cdots\)
Misinterpreting Model Parameters
Correlation does not imply causation!
e.g.,
Students who naturally spend more time on ITS
were more motivated learners to begin with.
So for every hour of tutor use, students test scores go up by 2%, right?
Not necessarily...
End-of-Year Test Score (out of 100)
= 2 \(*\) # Hours Spent on ITS + \(\cdots\)
Misinterpreting Model Parameters
Effect may be confounded by other variables!
e.g.,
End-of-Year Test Score (out of 100)
= 2 \(*\) # Hours Spent on ITS + 8 \(*\) # of ITS Units Completed + \(\cdots\)
So for every hour of tutor use, students test scores go up by 2%, right?
Not necessarily...
End-of-Year Test Score (out of 100)
= 2 \(*\) # Hours Spent on ITS + \(\cdots\)
Misinterpreting Model Parameters
The model class might be misspecified
e.g.,
End-of-Year Test Score (out of 100)
= 0.1 \(*\) (# Hours Spent on ITS)\(^2\) + \(\cdots\)
So for every hour of tutor use, students test scores go up by 2%, right?
Not necessarily...
Corbett and Anderson, 1994
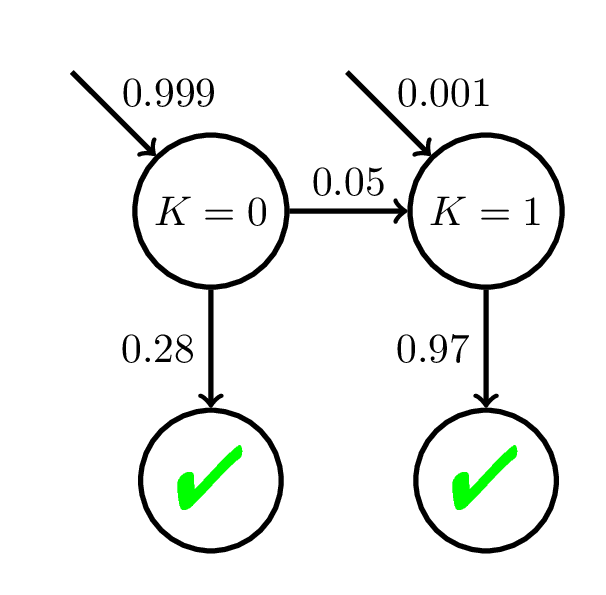
Interpreting BKT Parameters
High Slip!
Interpreting BKT Parameters
Doroudi and Brunskill, EDM 2017, Best Paper Nominee
500 students
20 practice opportunities
Interpreting BKT Parameters
Doroudi and Brunskill, EDM 2017, Best Paper Nominee
100 students
200 practice opportunities
Relying on the semantics of a wrong model can lead to incorrect inferences about student learning.
Takeaway Message
Check if your model is robust to the sequence length it was fit to!
Robustness Red Flag
see also: Pelánek, Rihák, and Papoušek, 2016
Misguided Notion of Mastery
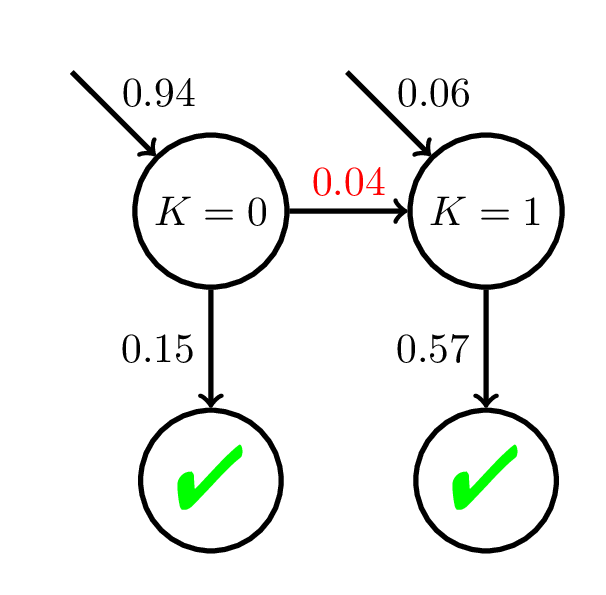
Model Mismatch & Mastery Learning
Doroudi and Brunskill, EDM 2017, Best Paper Nominee
500 students
20 practice opportunities
Avg \(P(C_i)\)
at Mastery:
0.54
Equity of Mastery Learning
Doroudi and Brunskill, In Submission
200 students
20 practice opportunities
200 students
20 practice opportunities
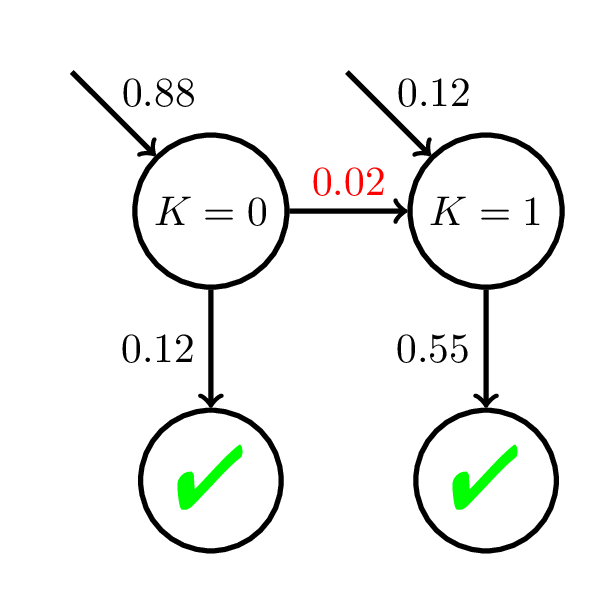
Avg \(P(C_i)\)
at Mastery:
0.56
Avg \(P(C_i)\)
at Mastery:
0.45
Using a wrong student model can lead to incorrect inferences about when a student reaches mastery and hence inequitable outcomes.
Takeaway Message
Check if your model is robust to different subpopulations of students!
Robustness Red Flag
e.g., Corbett and Anderson, 1994 and Lee and Brunskill, 2012
Evaluating Instructional Policies
A+
Model Mismatch & Instructional Policies
| Baseline | Adaptive Policy | |
|---|---|---|
| Simulated Results | 5.9 ± 0.9 | 9.1 ± 0.8 |
Doroudi, Aleven, and Brunskill, L@S 2017
Use model to simulate how students will do on posttest (out of 16 points)
| Baseline | Adaptive Policy | |
|---|---|---|
| Simulated Results | 5.9 ± 0.9 | 9.1 ± 0.8 |
| Experimental Results | 5.5 ± 2.6 | 4.9 ± 1.8 |
Doroudi, Aleven, and Brunskill, L@S 2017
Model Mismatch & Instructional Policies
Use model to simulate how students will do on posttest (out of 16 points)
Single Model Simulation
- Used by Chi, VanLehn, Littman, and Jordan (2011) and Rowe, Mott, and Lester (2014).
- Rowe, Mott, and Lester (2014): New instructional policy estimated to be much better than random policy.
- But in experiment, no significant difference found (Rowe and Lester, 2015).
Simulate each instructional policy according
to a single model to compare how they do.
Robust Evaluation Matrix
| Policy 1 | Policy 2 | Policy 3 | |
|---|---|---|---|
| Student Model 1 | |||
| Student Model 2 | |||
| Student Model 3 |
\(V_{SM_1,P_1}\)
\(V_{SM_2,P_1}\)
\(V_{SM_3,P_1}\)
\(V_{SM_1,P_2}\)
\(V_{SM_2,P_2}\)
\(V_{SM_3,P_2}\)
\(V_{SM_1,P_3}\)
\(V_{SM_2,P_3}\)
\(V_{SM_3,P_3}\)
Doroudi, Aleven, and Brunskill, L@S 2017
Robust Evaluation Matrix
Baseline |
Adaptive Policy |
|
|---|---|---|
G-SCOPE Model |
5.9 ± 0.9 |
9.1 ± 0.8 |
Doroudi, Aleven, and Brunskill, L@S 2017
Robust Evaluation Matrix
Baseline |
Adaptive Policy |
|
|---|---|---|
G-SCOPE Model |
5.9 ± 0.9 |
9.1 ± 0.8 |
Bayesian Knowledge Tracing |
6.5 ± 0.8 |
7.0 ± 1.0 |
Doroudi, Aleven, and Brunskill, L@S 2017
Robust Evaluation Matrix
Baseline |
Adaptive Policy |
|
|---|---|---|
G-SCOPE Model |
5.9 ± 0.9 |
9.1 ± 0.8 |
Bayesian Knowledge Tracing |
6.5 ± 0.8 |
7.0 ± 1.0 |
Deep Knowledge Tracing |
9.9 ± 1.5 |
8.6 ± 2.1 |
Doroudi, Aleven, and Brunskill, L@S 2017
Robust Evaluation Matrix
Baseline |
Adaptive Policy |
Awesome Policy |
|
|---|---|---|---|
G-SCOPE Model |
5.9 ± 0.9 |
9.1 ± 0.8 |
16 |
Bayesian Knowledge Tracing |
6.5 ± 0.8 |
7.0 ± 1.0 |
16 |
Deep Knowledge Tracing |
9.9 ± 1.5 |
8.6 ± 2.1 |
16 |
Doroudi, Aleven, and Brunskill, L@S 2017
We attempt to treat the same problem with several alternative models each with different simplifications but with a common...assumption. Then, if these models, despite their different assumptions, lead to similar results, we have what we can call a robust theorem that is relatively free of the details of the model.
Hence, our truth is the intersection of independent lies.
- Richard Levins, 1966
Model robustness can help us advance theories of instruction without assuming particular theories of learning.
Takeaway Message
If all models are wrong,
then let's focus on finding models that are useful (i.e. robust)!
Acknowledgements
The research reported here was supported, in whole or in part, by the Institute of Education Sciences, U.S. Department of Education, through Grants R305A130215 and R305B150008 to Carnegie Mellon University. The opinions expressed are those of the authors and do not represent views of the Institute or the U.S. Dept. of Education.
Some of the work reported here was written in papers with co-authors Emma Brunskill and Vincent Aleven. I thank Emma Brunskill, Ken Holstein, and Petr Johanes for discussions that influenced this work.
References
Cen, H. (2009). Generalized learning factors analysis: improving cognitive models with machine learning (Doctoral dissertation). Carnegie Mellon University, Pittsburgh, PA.
Corbett, A. T., & Anderson, J. R. (1994). Knowledge tracing: Modeling the acquisition of procedural knowledge. User modeling and user-adapted interaction, 4(4), 253-278.
Doroudi, S., & Brunskill, E. (2017, June). The misidentified identifiability problem of Bayesian Knowledge Tracing. In Proceedings of the 10th International Conference on Educational Data Mining. International Educational Data Mining Society.
Doroudi, S., Aleven, V., & Brunskill, E. (2017, April). Robust evaluation matrix: Towards a more principled offline exploration of instructional policies. In Proceedings of the Fourth (2017) ACM Conference on Learning@ Scale (pp. 3-12). ACM.
Lee, J. I. & Brunskill, E. (2012, June). The Impact on Individualizing Student Models on Necessary Practice Opportunities. In Proceedings of the 5th International Conference on Educational Data Mining. International Educational Data Mining Society, 118-125.
Pelánek, R., Rihák, J., & Papoušek, J. (2016, April). Impact of data collection on interpretation and evaluation of student models. In Proceedings of the Sixth International Conference on Learning Analytics & Knowledge (pp. 40-47). ACM.