Fairer but Not Fair Enough
On the Equitability of
Knowledge Tracing
LAK 2019
Shayan Doroudi & Emma Brunskill


The Promise of Mastery Learning


One Size Fits All
Mastery Learning
“The [BKT] model overestimates the true learning and performance parameters for below-average students who make many errors. While these students receive more remedial exercises than the above average students, they nevertheless receive less remedial practice than they need and perform worse on the test than expected.”
Corbett and Anderson, 1995
“17% of students would be expected to have a probability of mastery of only 60% or less when the population model would expect the student is at a probability of mastery of 95% or higher”
Lee and Brunskill, 2012
The Reality of Mastery Learning
Over 500,000 students/year
~12 million active monthly users
Why Does Mastery Learning Matter?
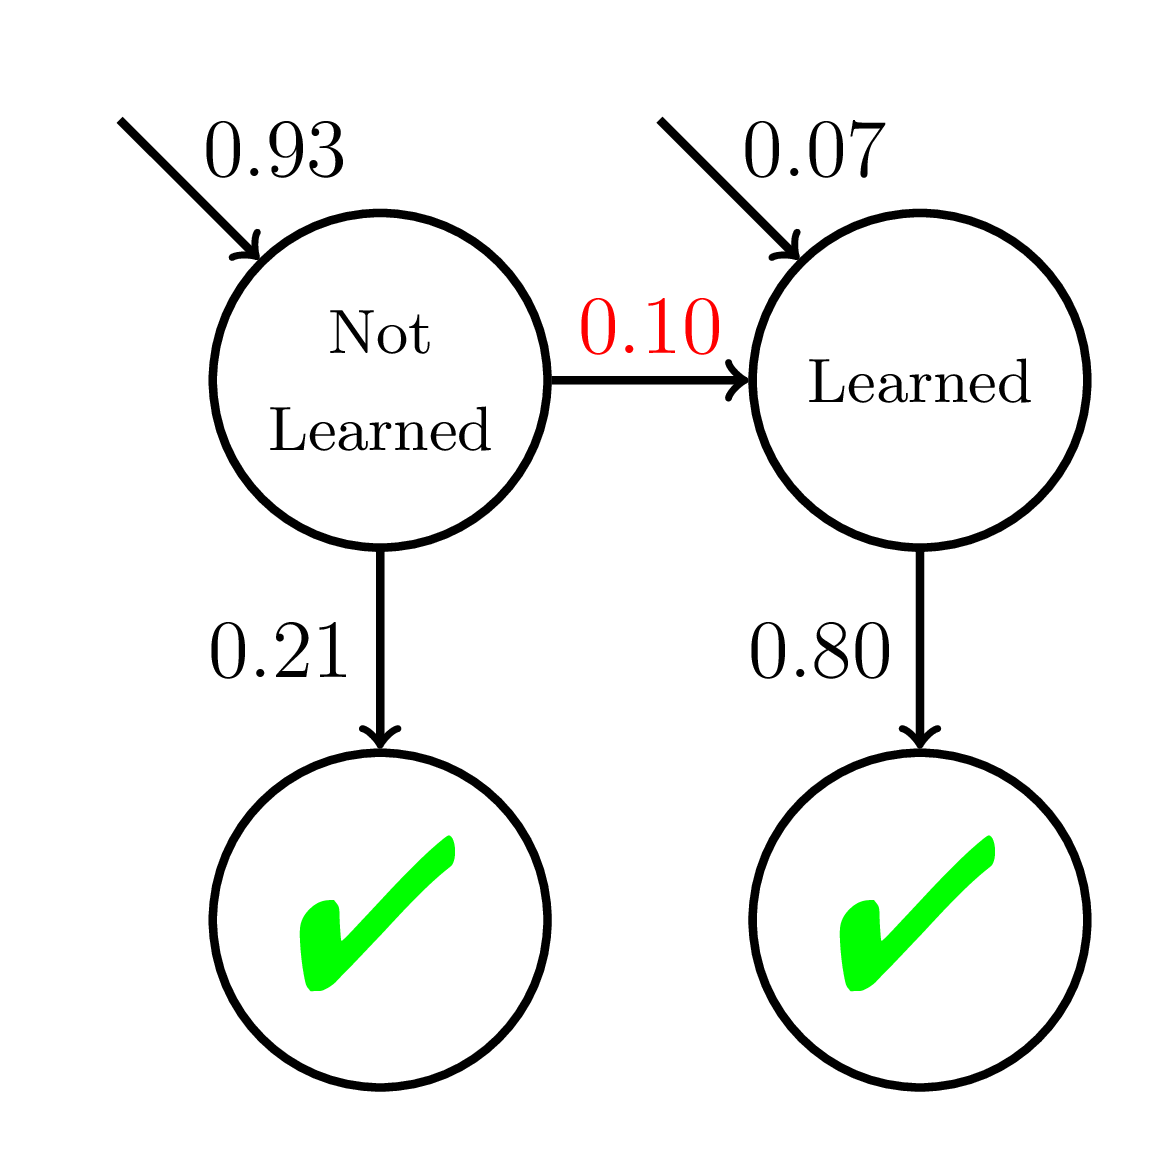
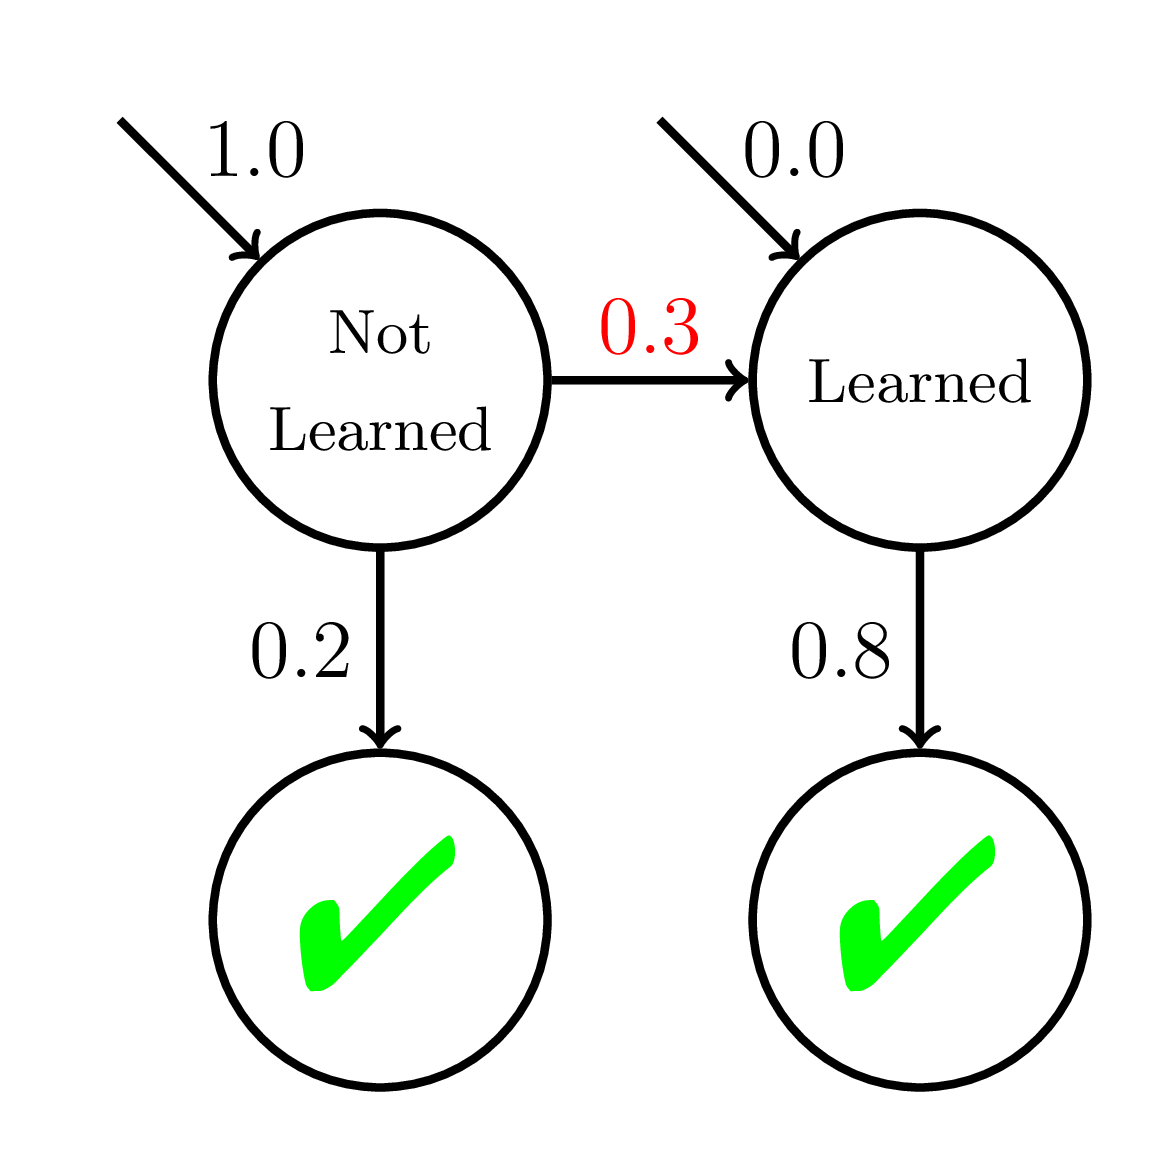
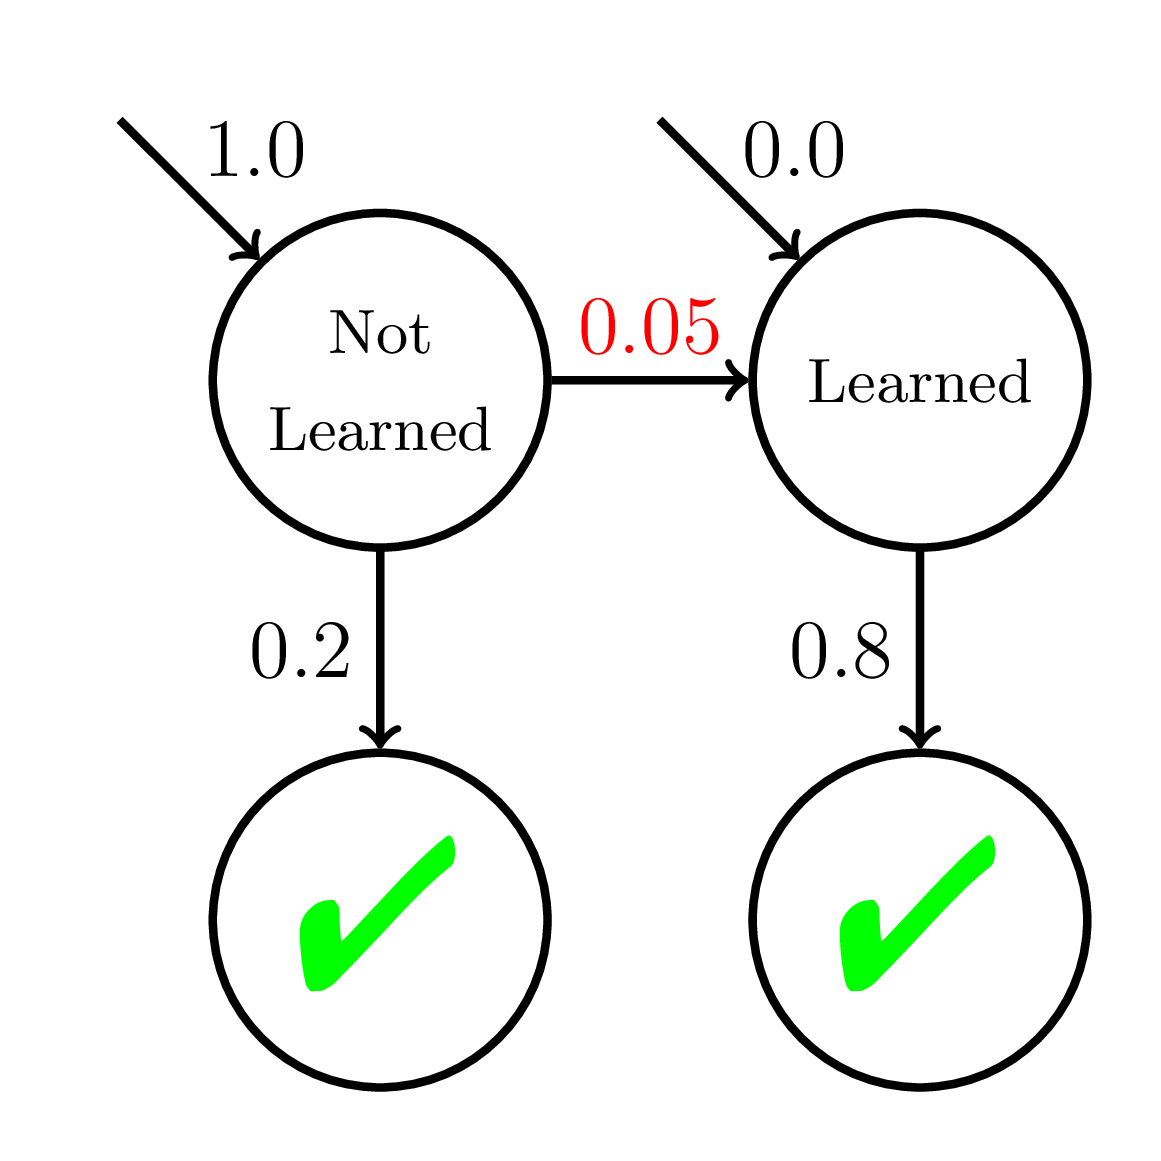
Bayesian Knowledge Tracing
N-Consecutive Correct in a Row
Over 50,000
students/year
Defining Equitable Outcomes
Primary Equity Concern:
Students from different demographics should be equally likely to learn all skills.
Secondary Equity Concern:
Students from different demographics should get comparable amounts of unnecessary practice.
Disagree? Great! Let's discuss.
Reinterpreting Mastery Learning
One Size Fits All
Mastery Learning
Equitable
Inequitable
“The [BKT] model overestimates the true learning and performance parameters for below-average students who make many errors. While these students receive more remedial exercises than the above average students, they nevertheless receive less remedial practice than they need and perform worse on the test than expected.”
Corbett and Anderson, 1994
“17% of students would be expected to have a probability of mastery of only 60% or less when the population model would expect the student is at a probability of mastery of 95% or higher”
Lee and Brunskill, 2012
The Reality of Mastery Learning
Inequitable
Mastery learning can be inequitable when the assumptions of our models are not accurate.
Outline
Background
Lack of Individualization
Model Misspecification
Background
Bayesian Knowledge Tracing (BKT)
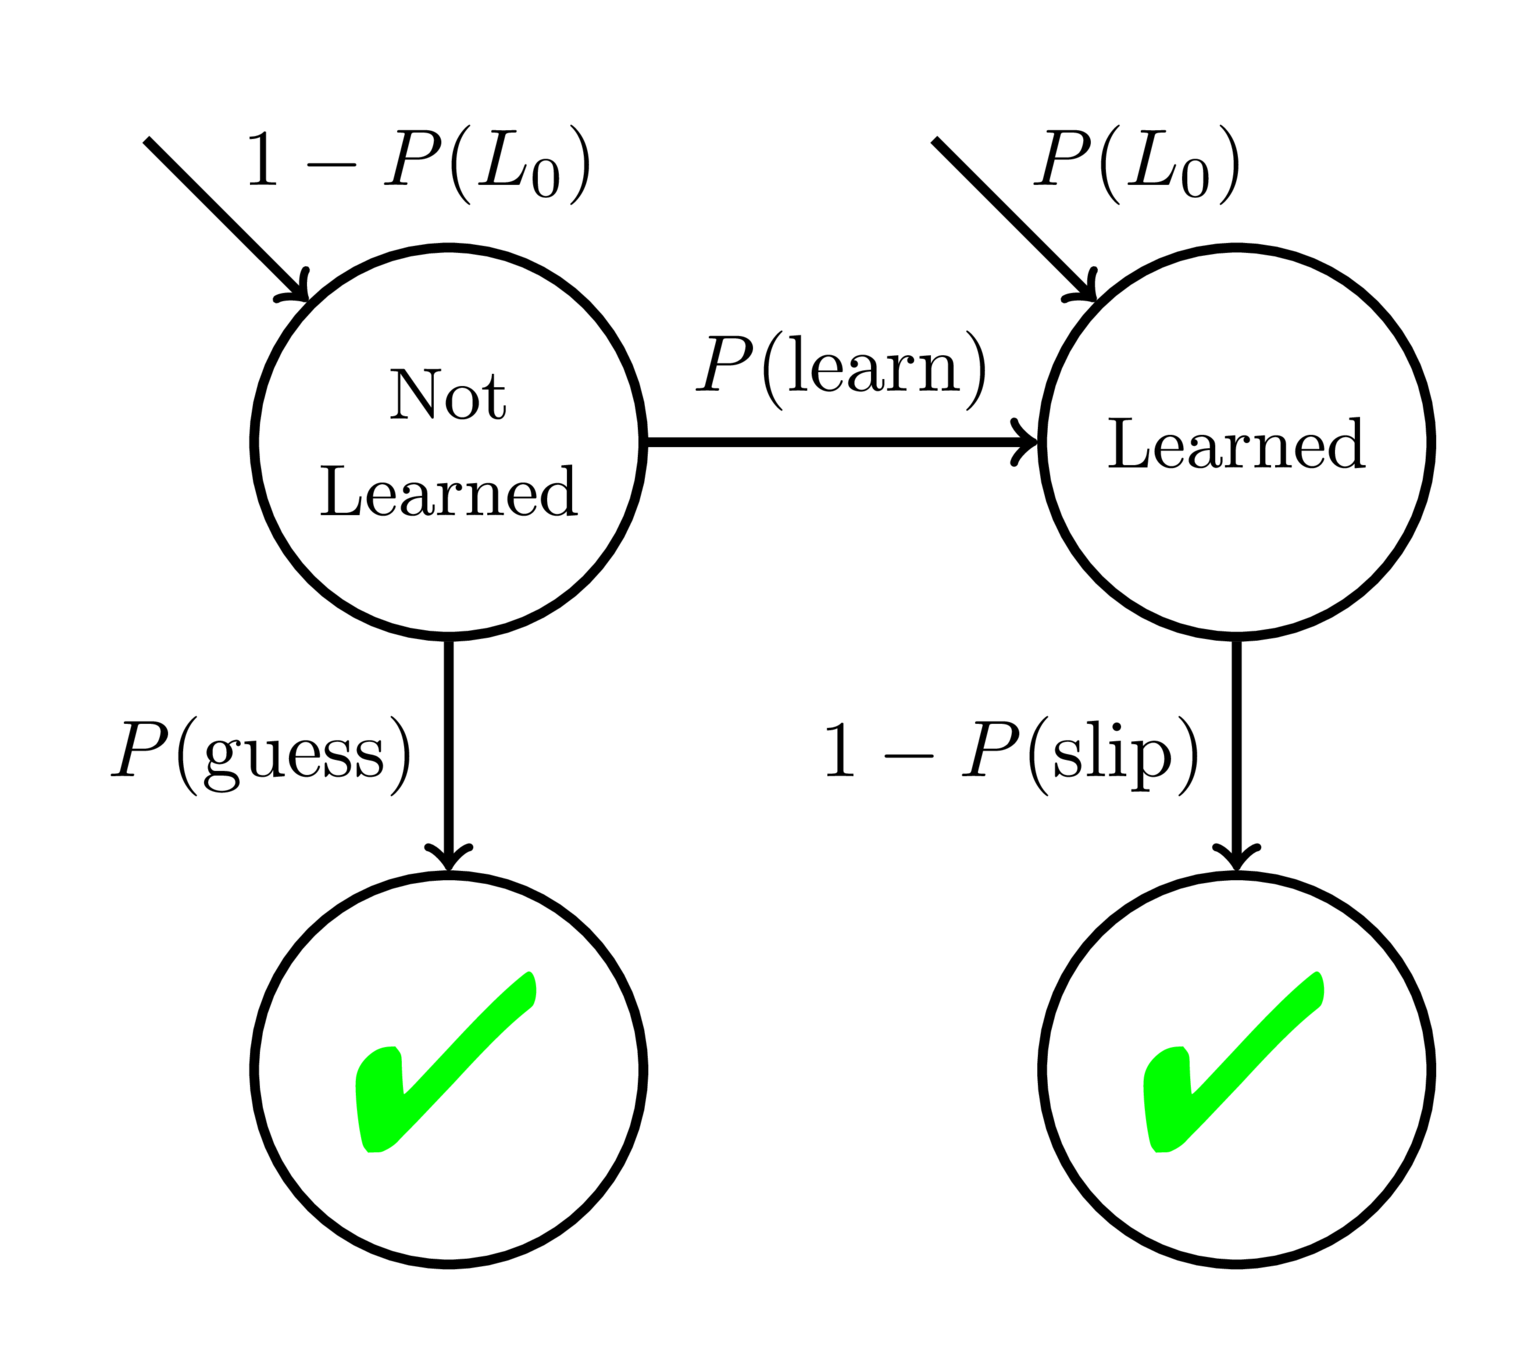
Corbett and Anderson, 1995
Cognitive Mastery Learning
Keep giving practice opportunities on a skill/concept until student reaches mastery:
Then move onto the next skill/concept
Corbett and Anderson, 1995
Lack of Individualization
200 students
20 practice opportunities
Fast Learners
Slow Learners
How Fair Is One-Size-Fits-All?
Fairer than One-Size-Fits-All!
But Not Fair Enough!
Inequitable!
Solution: Individualization?
Even after individualizing BKT parameters, they found that
low-performing students do worse on the test.
Solution: Individualize BKT parameters for different students.
Corbett and Anderson, 1995
Why?
- Model not individualized well enough?
- BKT might not accurately explain how students learn
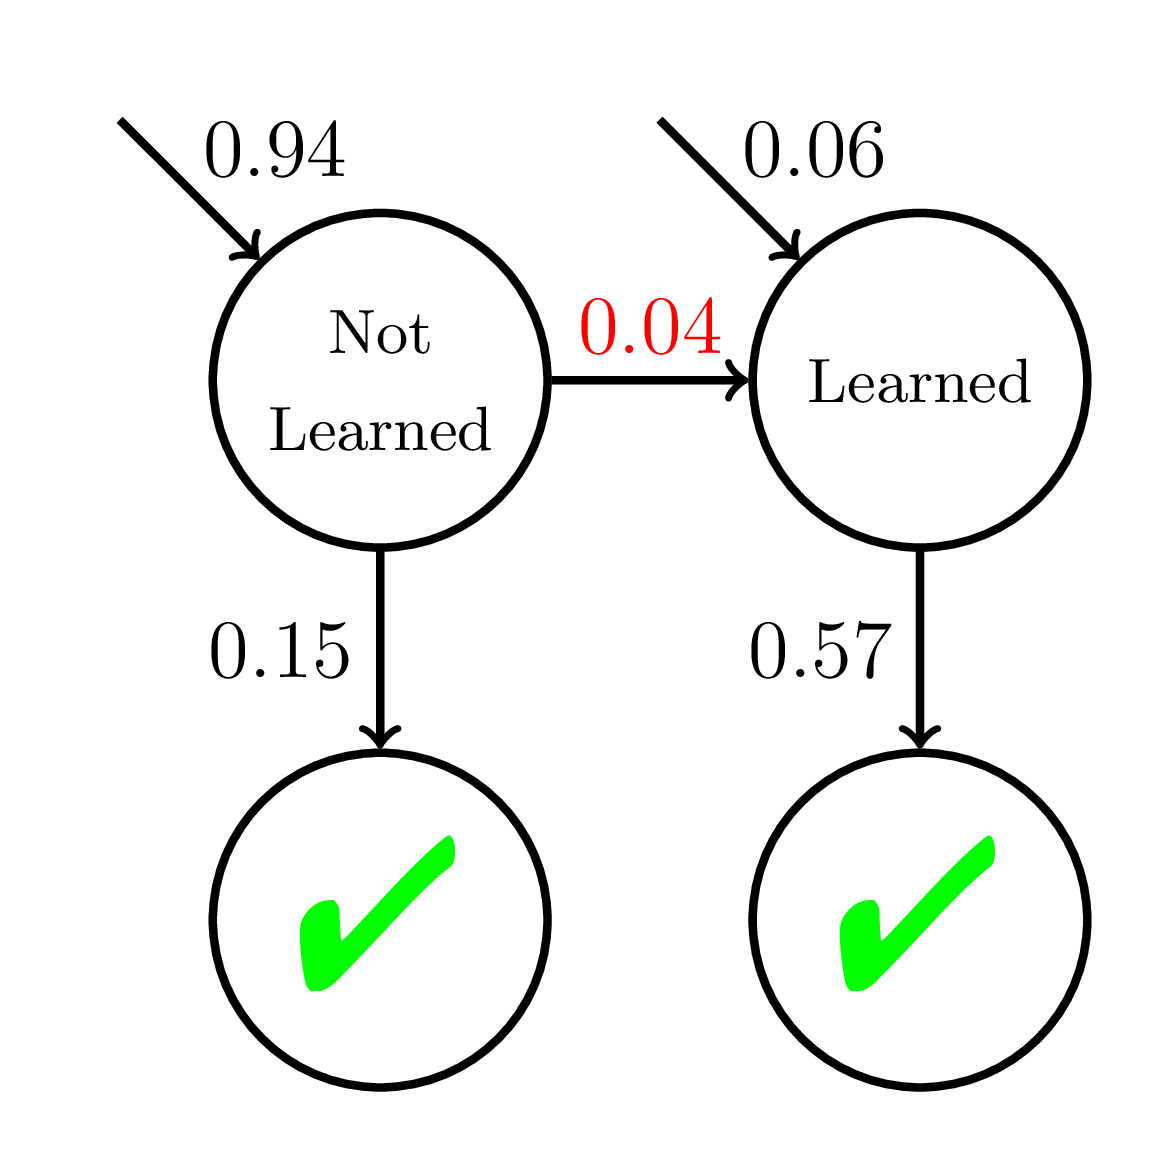
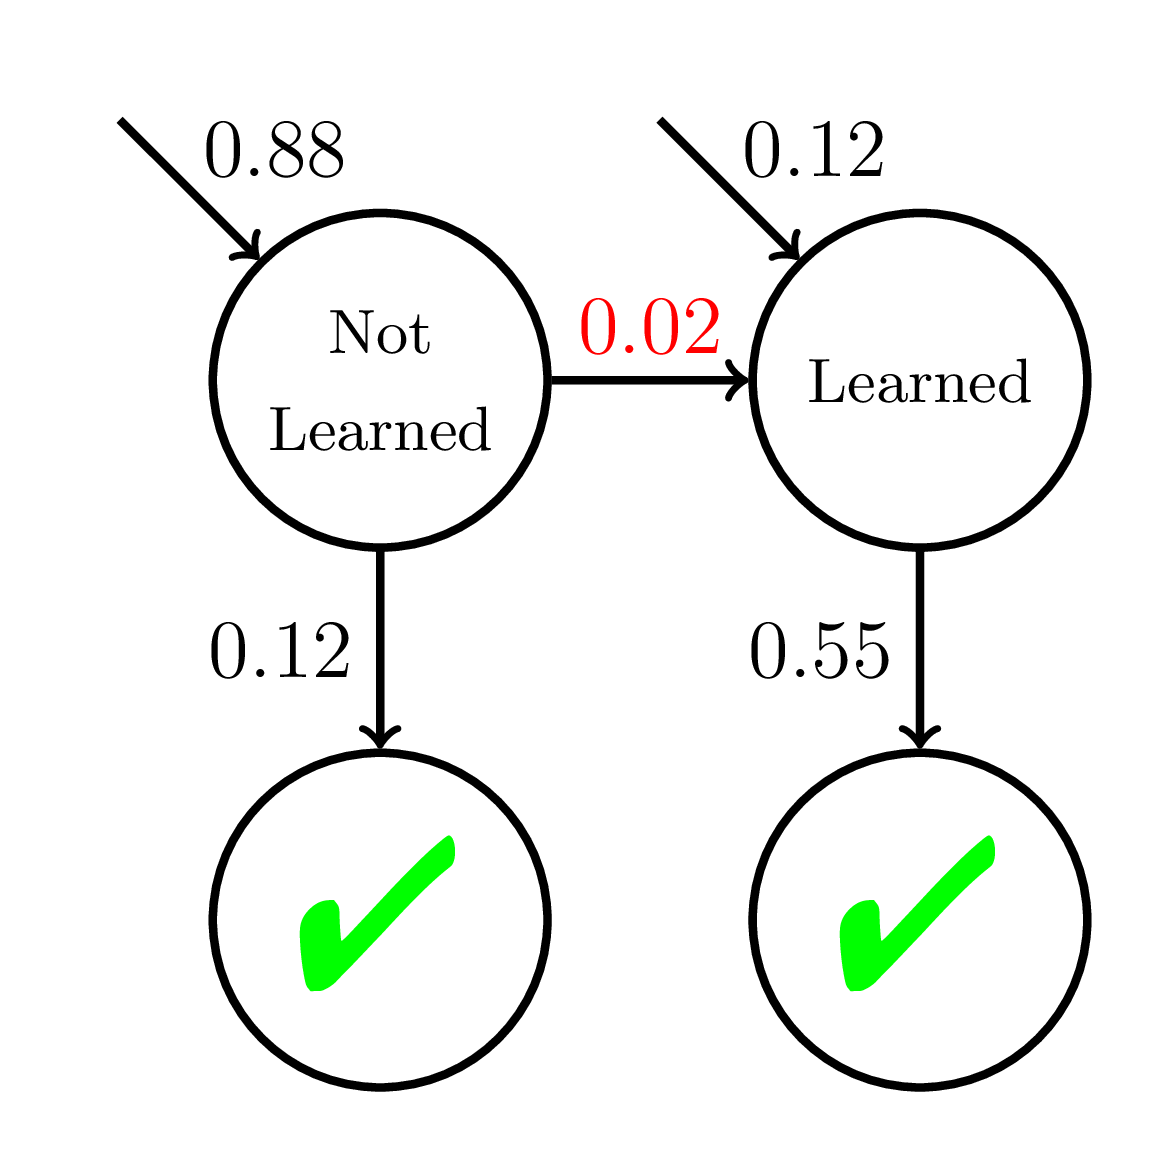
Model Misspecification
200 students
20 practice opportunities
200 students
20 practice opportunities
Fast Learners
Slow Learners
Equity of Wrong Model
Equity of Wrong Model
Average P(Correct)
at Mastery:
0.56
Average P(Correct) at Mastery:
0.45
Mastery
Learning
Mastery
Learning
Fast Learners
Slow Learners
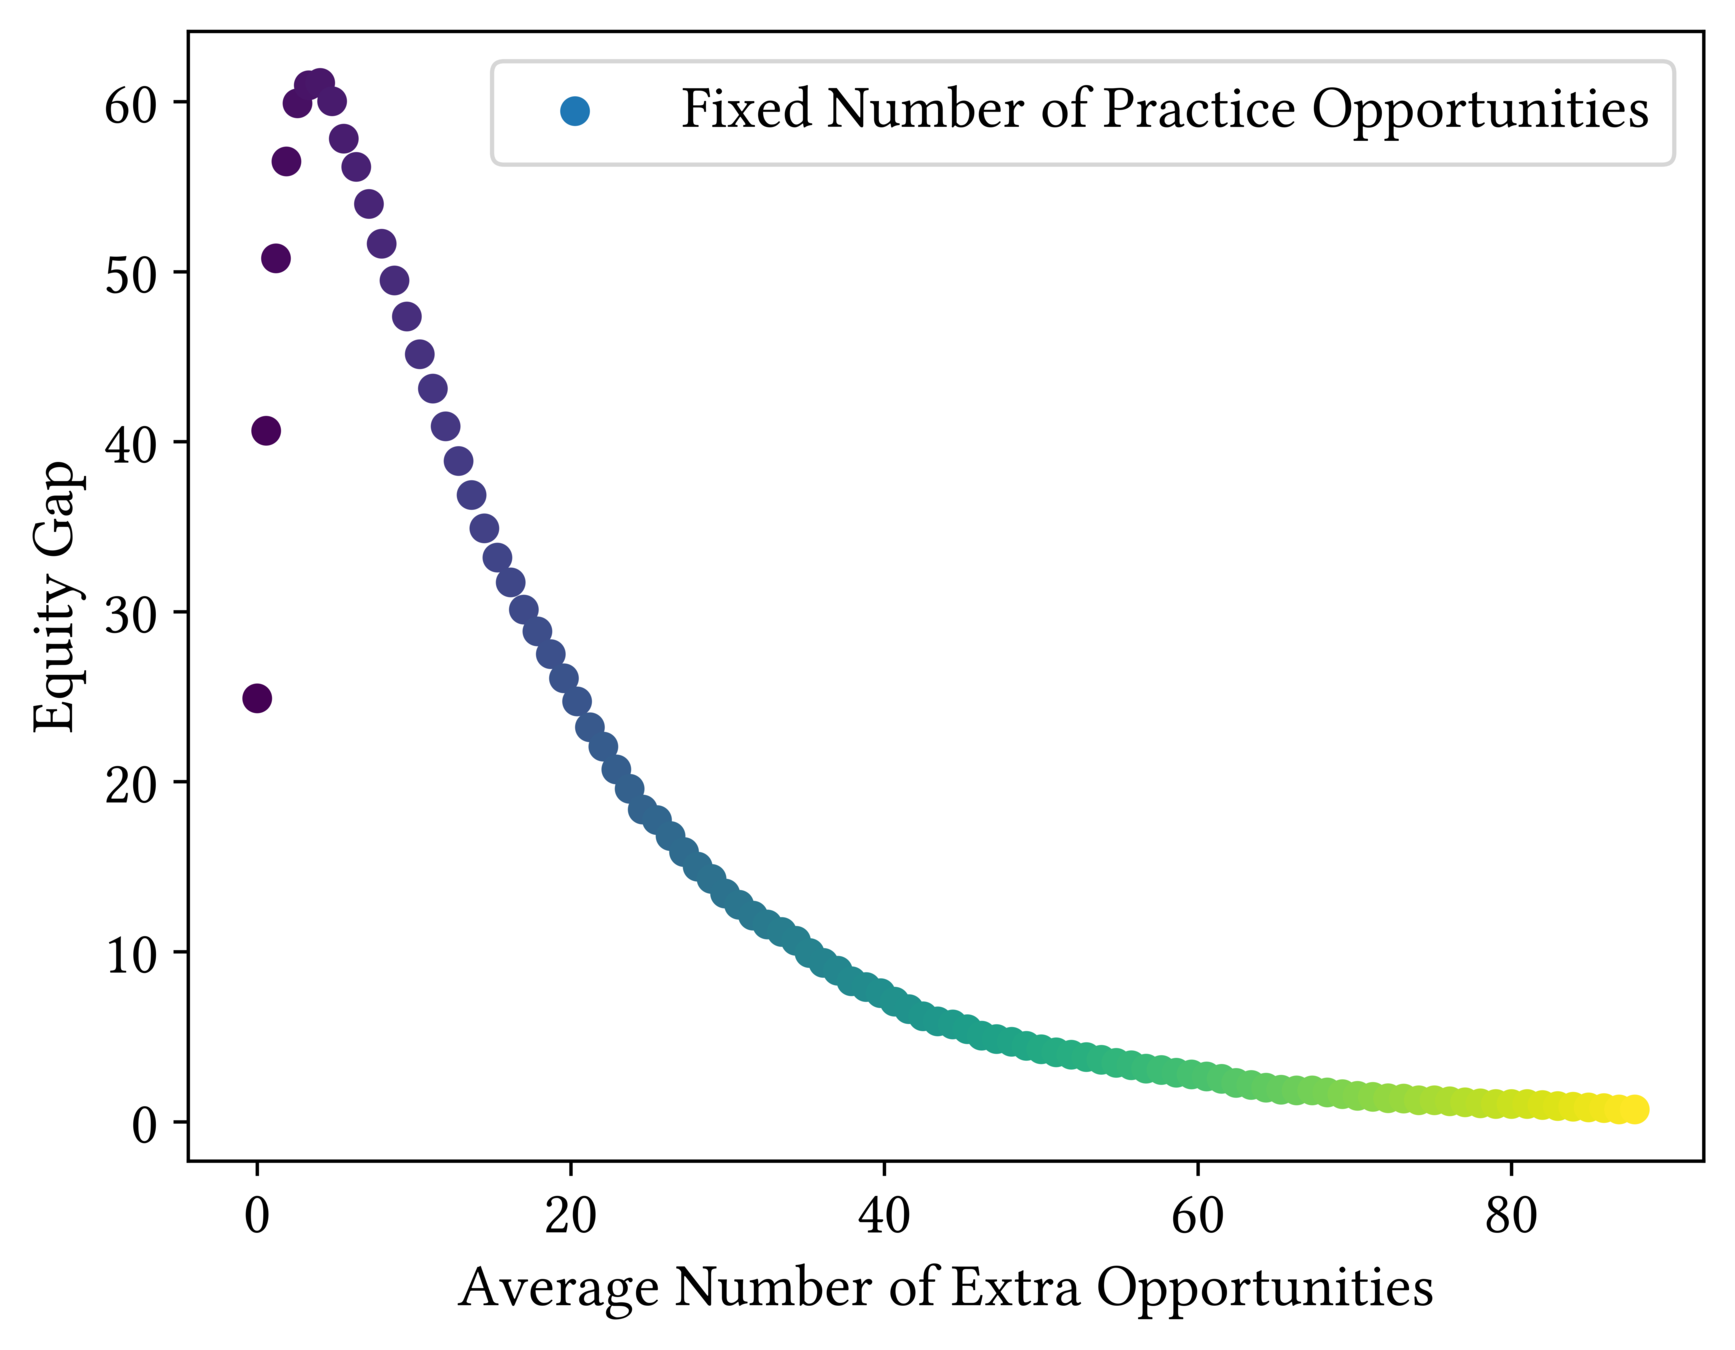
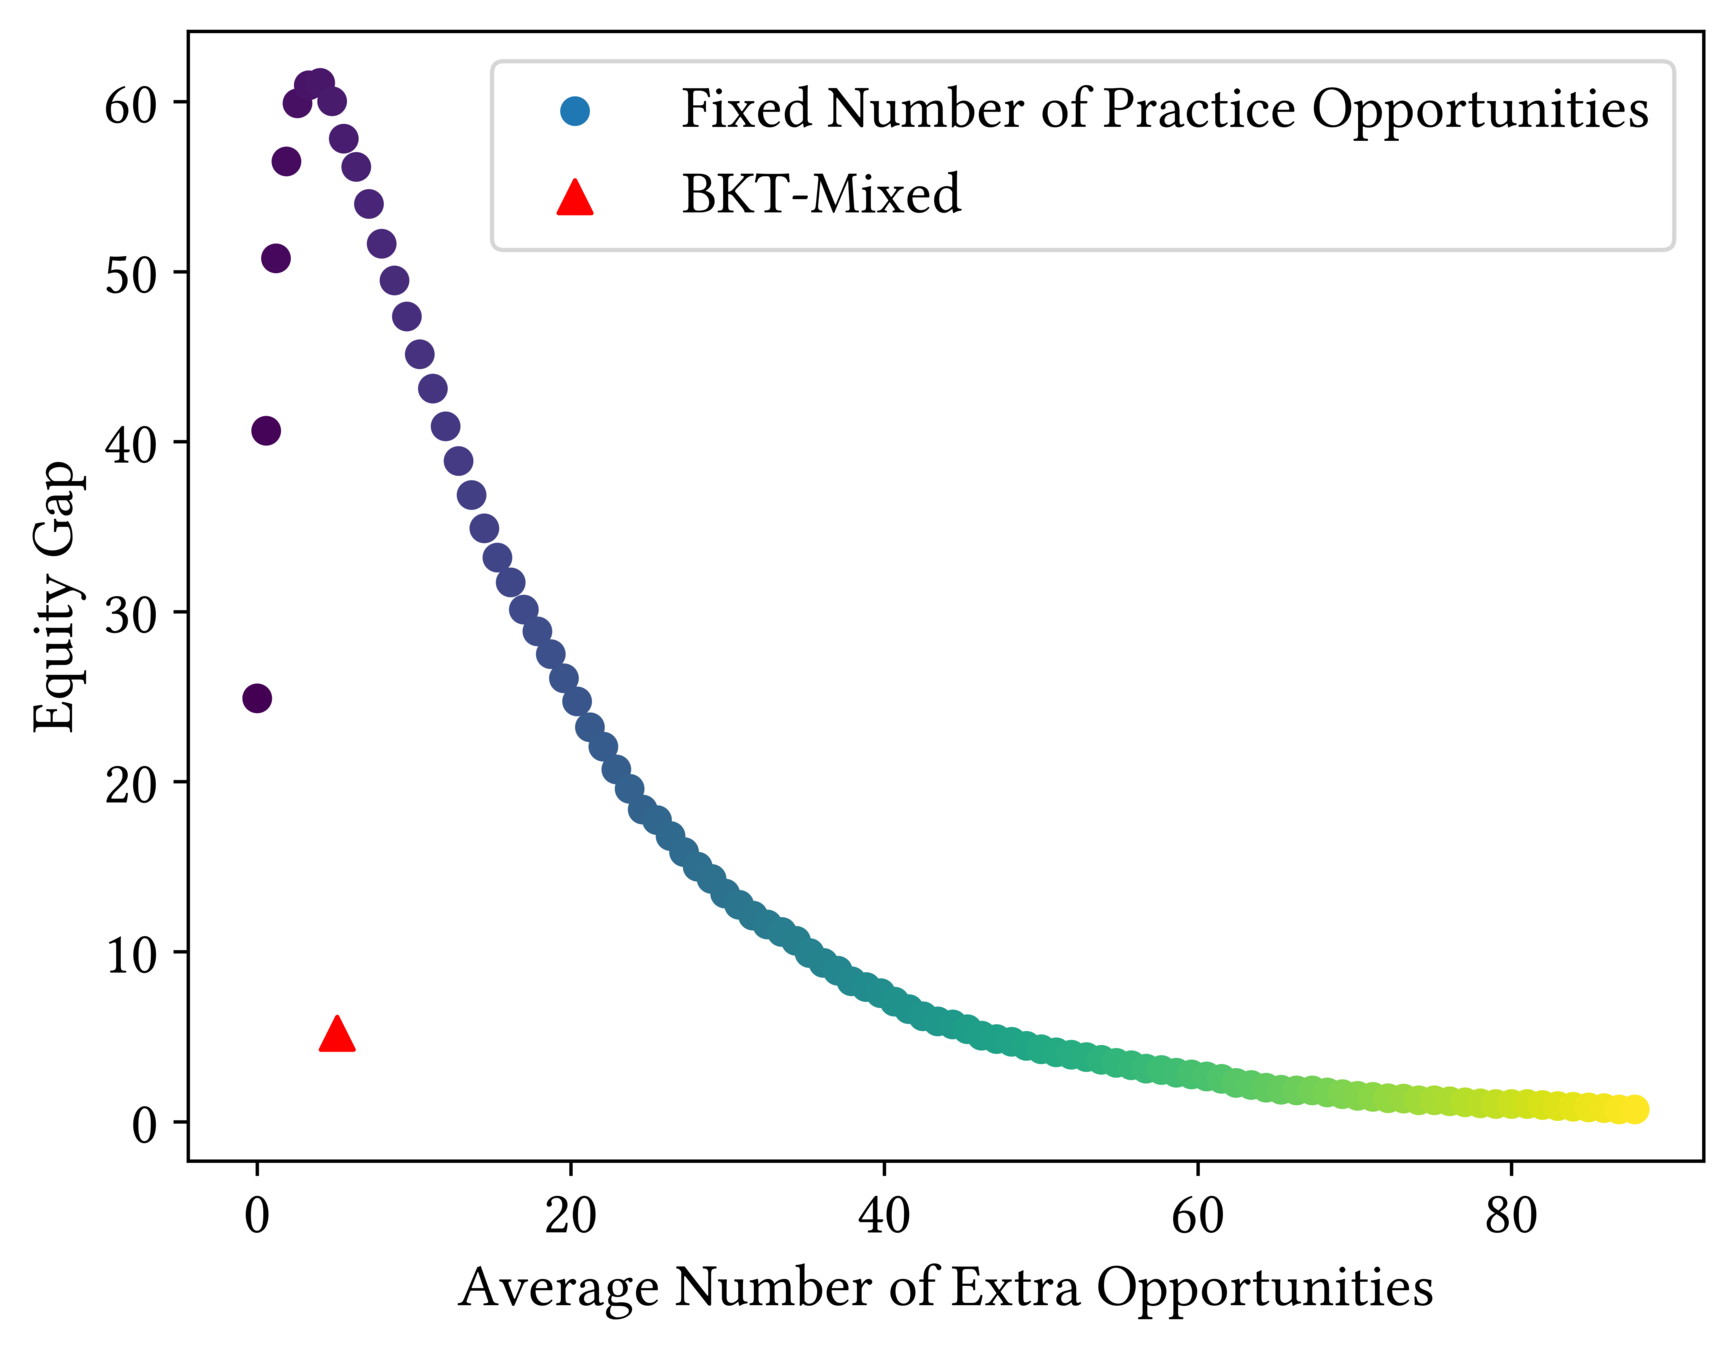
How to Find Equitable Models
We need to look for better student models, not in terms of accuracy or even mastery on average
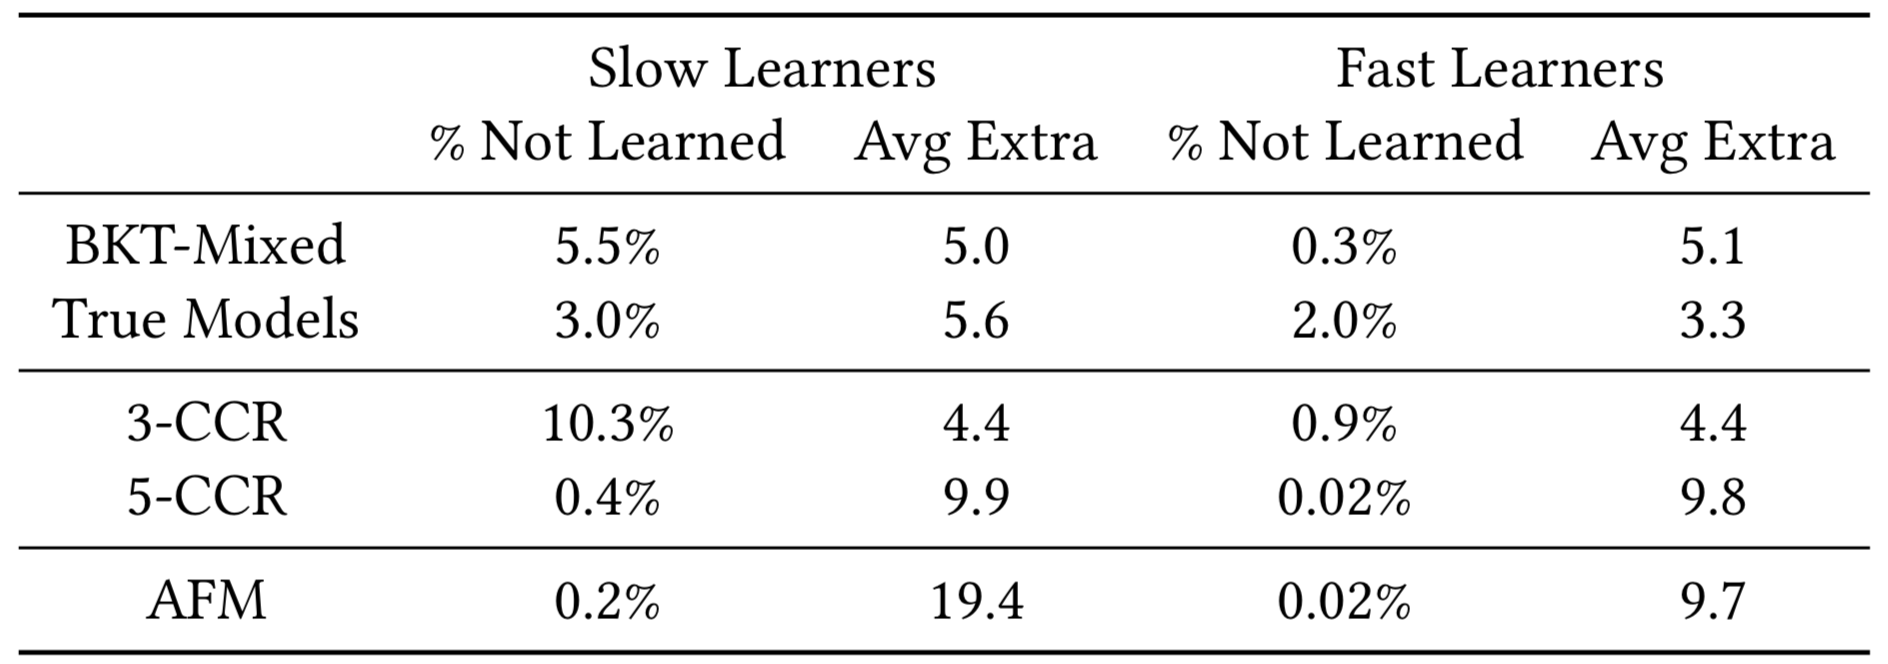
Mastery learning with AFM appears to be more equitable even when students learn according to BKT
...but at the expense of giving more extra practice
but in terms of equity
To do so, we need to reason about how student models perform under model misspecification
When the model is wrong, mastery learning might not be as fair as it promises
Conclusions
-
Lack of individualization
-
Model mispecification
Mastery learning is more fair than not using mastery learning, but we should aim higher!
Let's look for models that are equitable regardless of how students actually learn.
This research was supported in part by a Google grant and a Microsoft Research Faculty Fellowship.
Backup Slides
Fairness of Various Algorithms
|
Student Models |
Mastery Learning BKT |
|---|---|
| AFM - Fast Learners | 56% |
| AFM - Slow Learners | 45% |
Equity Under Model Mismatch
|
Student Models |
Mastery Learning BKT |
|---|---|
| AFM - Fast Learners | 56% |
| AFM - Slow Learners | 45% |
| BKT - Fast Learners | 98%* |
| BKT - Slow Learners | 97.3%* |
*Percent of students who are in learned state.
Equity Under Model Mismatch
|
Student Models |
Mastery Learning
BKT |
Mastery Learning AFM |
|---|---|---|
| AFM - Fast Learners | 56% | 96% |
| AFM - Slow Learners | 45% | 95% |
| BKT - Fast Learners | 98%* | |
| BKT - Slow Learners | 97.3%* |
*Percent of students who are in learned state.
Equity Under Model Mismatch
Equity Under Model Mismatch
|
Student Models |
Mastery Learning
BKT |
Mastery Learning AFM |
|---|---|---|
| AFM - Fast Learners | 56% | 96% |
| AFM - Slow Learners | 45% | 95% |
| BKT - Fast Learners | 98%* | 99.8%* |
| BKT - Slow Learners | 97.3%* | 99.5%* |
*Percent of students who are in learned state.