RIP
Language Modeling
Stephen Mazurchuk
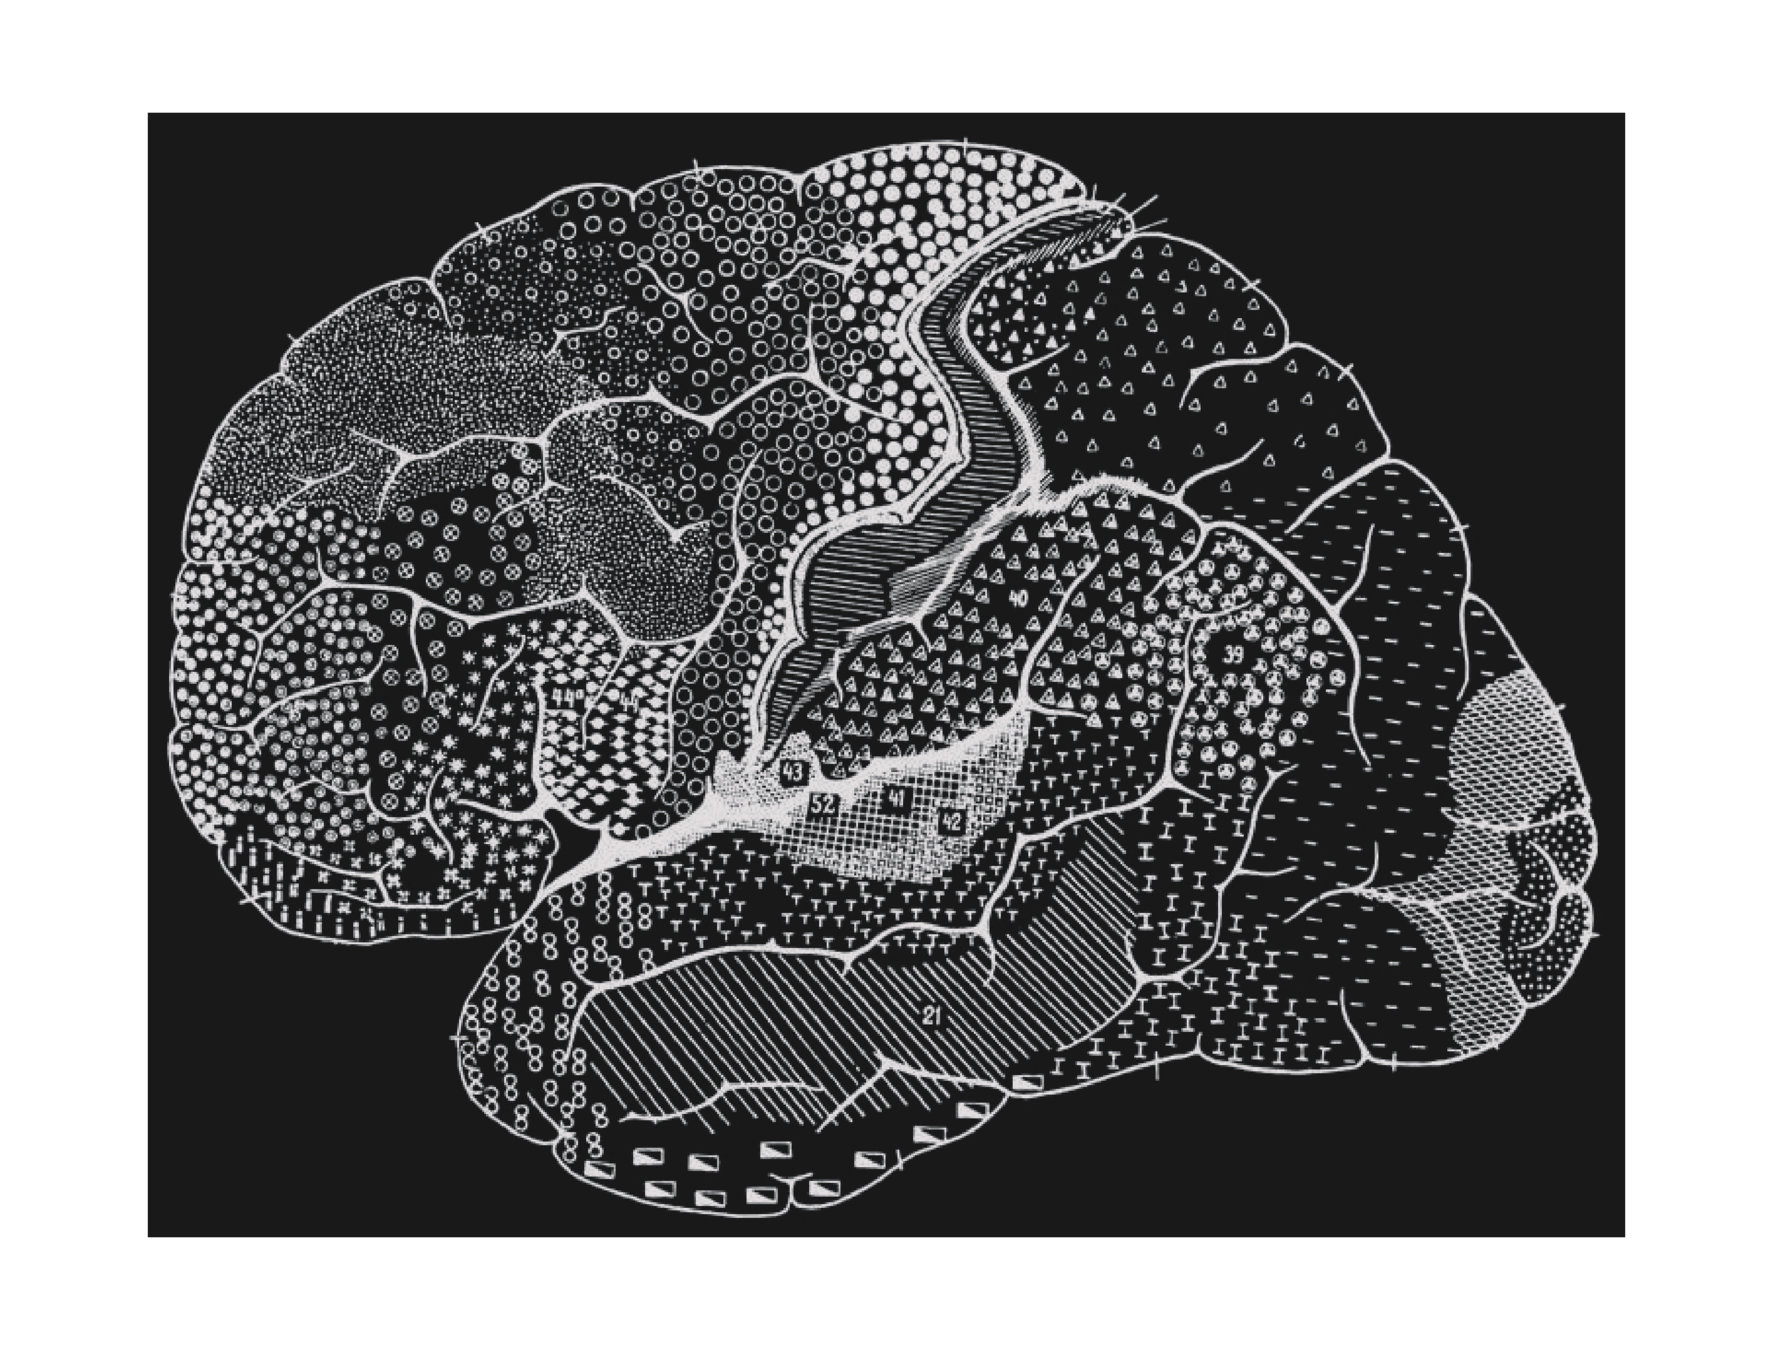
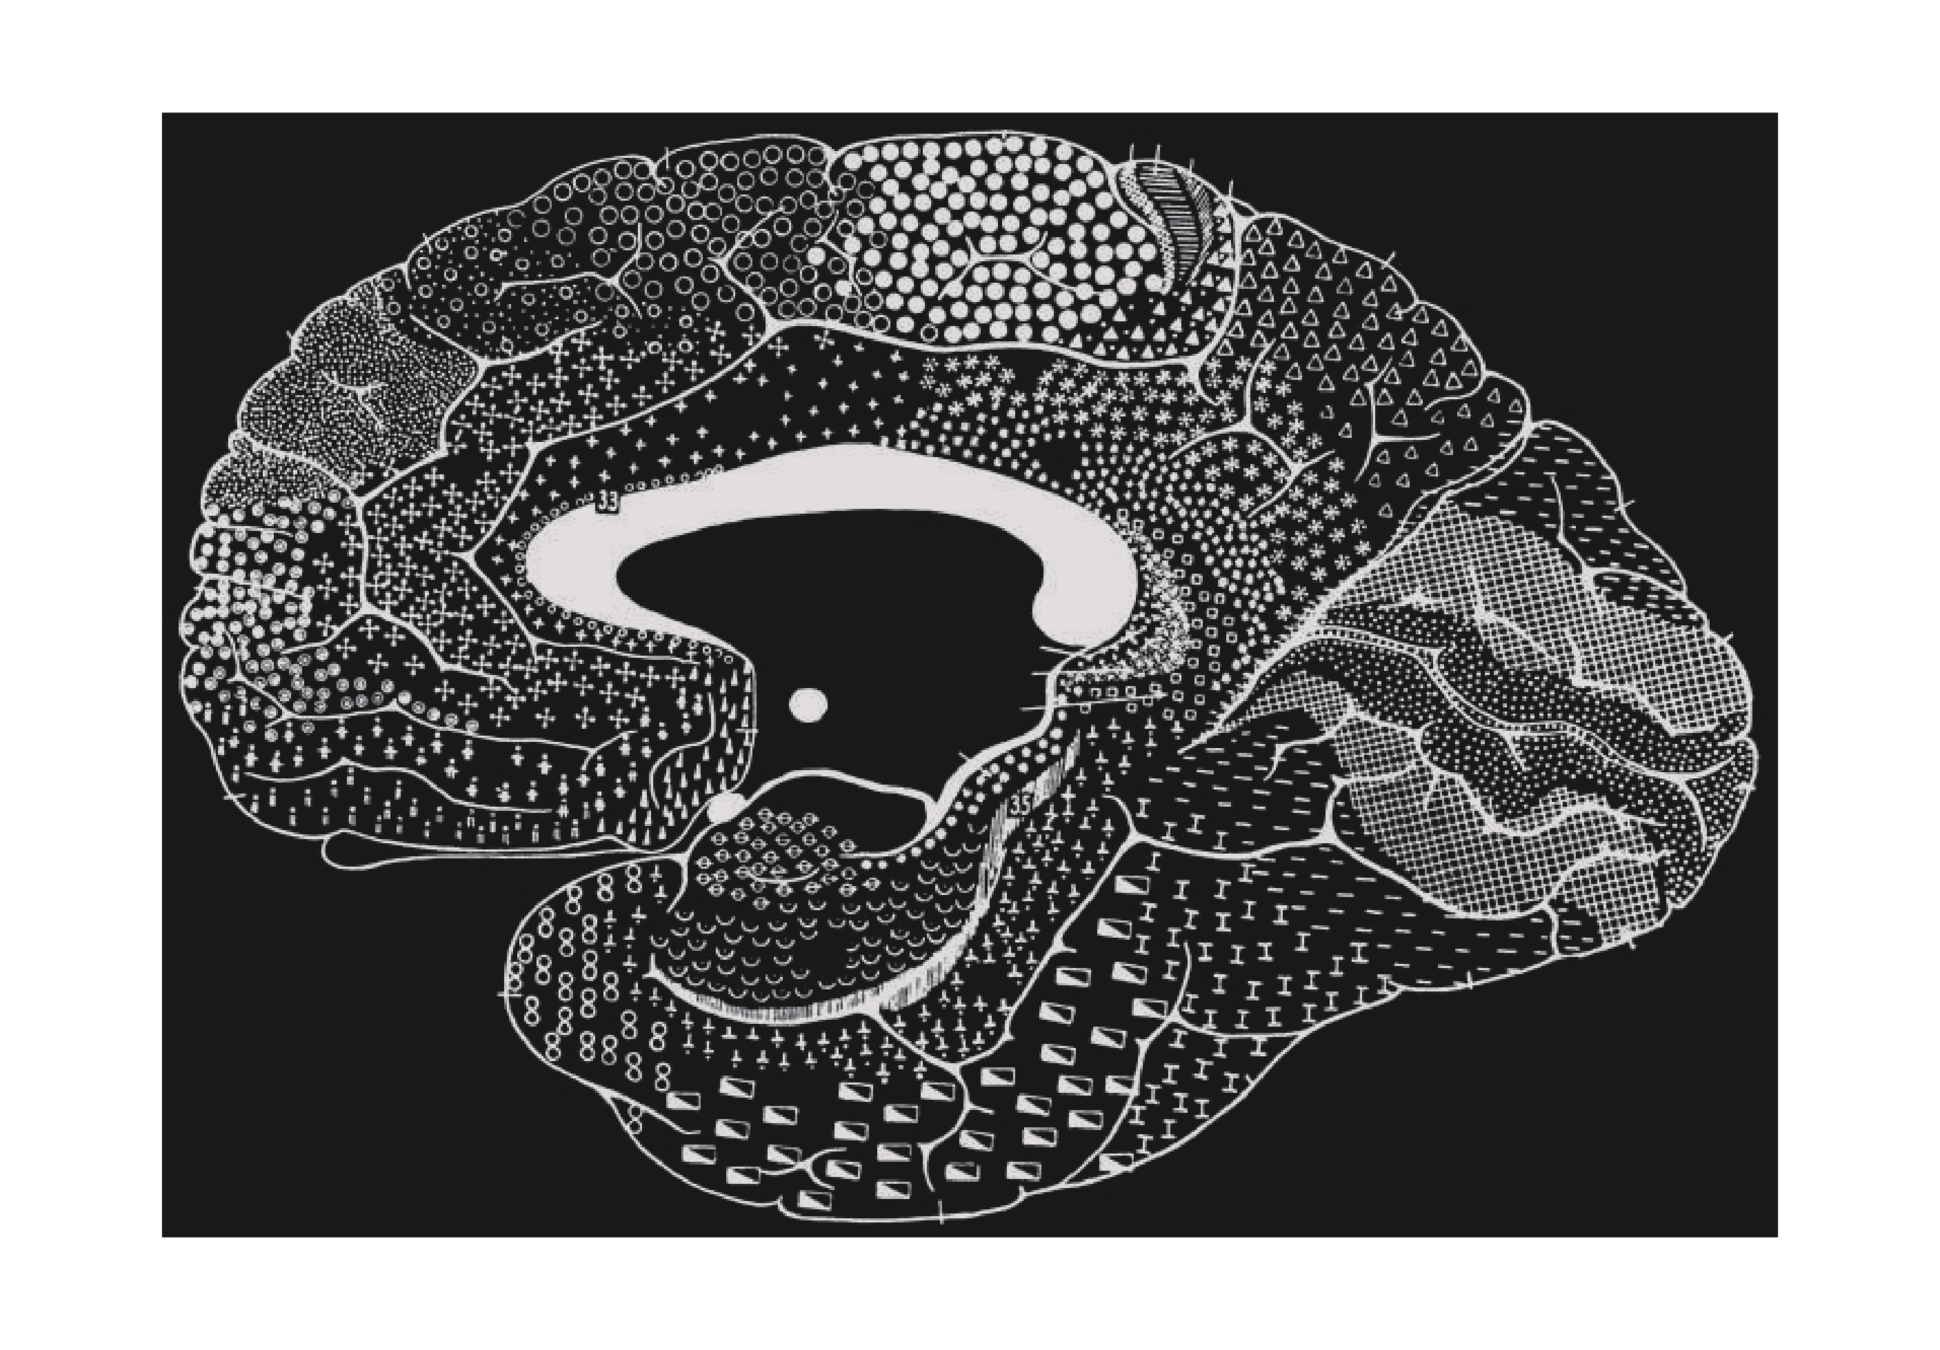
(From Brodmann K: Vergleichende Lokalisation lehre der Grosshirnrinde in ihren Prinzipien dargestellt auf Grund des Zellenbaues, Leipzig, 1909, JA Barth.)
Language Imaging
Laboratory
- Our Questions
- Concept representation and retrieval
- (Phonological representation and retrieval)
- Aphasia diagnosis, classification, and treatment
- Language lateralization
- Preoperative language mapping and network abnormalities in epilepsy
- Our Tools
- Structural and fMRI
- Cognitive and psychophysical measures
- Computational modeling
- MEG, TMS, tDCS
me!
Where is word meaning?
Wernicke
The Flourens concept of the intellect as single unity, claiming equivalence of all brain areas, has long proved untenable. […] However, primary functions alone, can be referred to specific cortical areas. […] The cerebral surface is a mosaic of such primary elements whose properties are determined by their anatomical connections to the body-periphery. All processes which exceed these primary functions (such as synthesis of various perceptions into single concepts and the more complex functions such as thoughts and consciousness) are dependent upon the fiber bundles connecting different areas of the cortex.
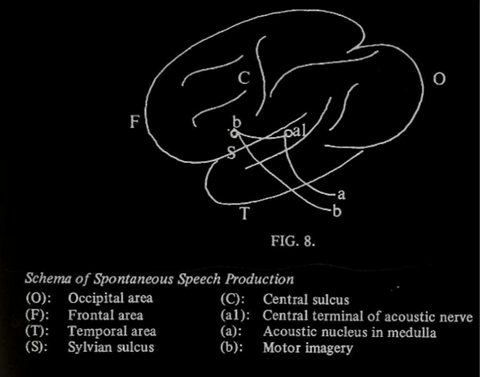
Wernicke. (1874). Der Aphasiche Symptomencomplex.
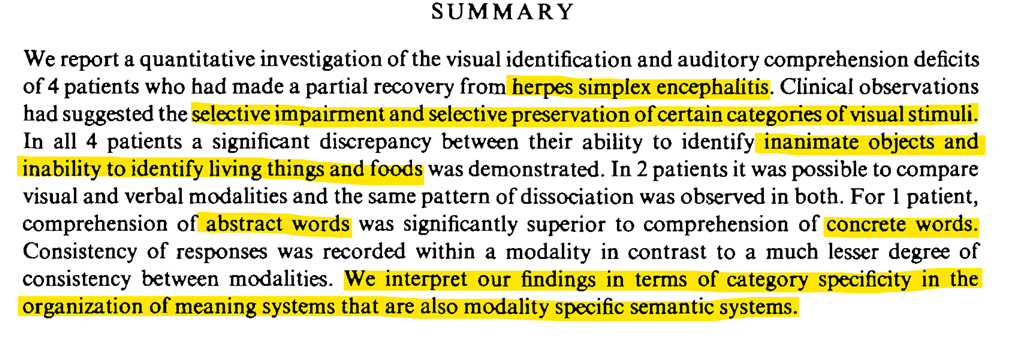
Modern Tools
- We can investigate representations in the brain based on how bloodflow changes when people read a word in the MRI scanner
- The word is read multiple times, and we then regress out the magnitude of blood-flow change in a volume (voxel) of the brain when they read a particular word

Main Points So Far
- Functional Localization
- General Frameworks
- Lesion Symptom Mapping, fMRI
- General Frameworks
- Key Points
- It is documented that categories have some degree of spatial localization in the brain
- Hypothesis:
- Categories spatially localize based on where (anatomically) the relevant modality specific streams intersect
- What is responsible for spatially localized category representation in the brain?
- Where in the brain do different streams of unimodal information intersect/integrate?
Questions
- What is responsible for spatially localized category representation in the brain?
Experiential Attributes
Please take this brief survey
Rating Based Theories
- Propose that concepts are composed of primitive components of meaning
- These features are "embodied" in the perception, action and other modal systems
- Our lab proposed and collected ratings for a set of 65 experiential attributes based on known functional divisions in the brain
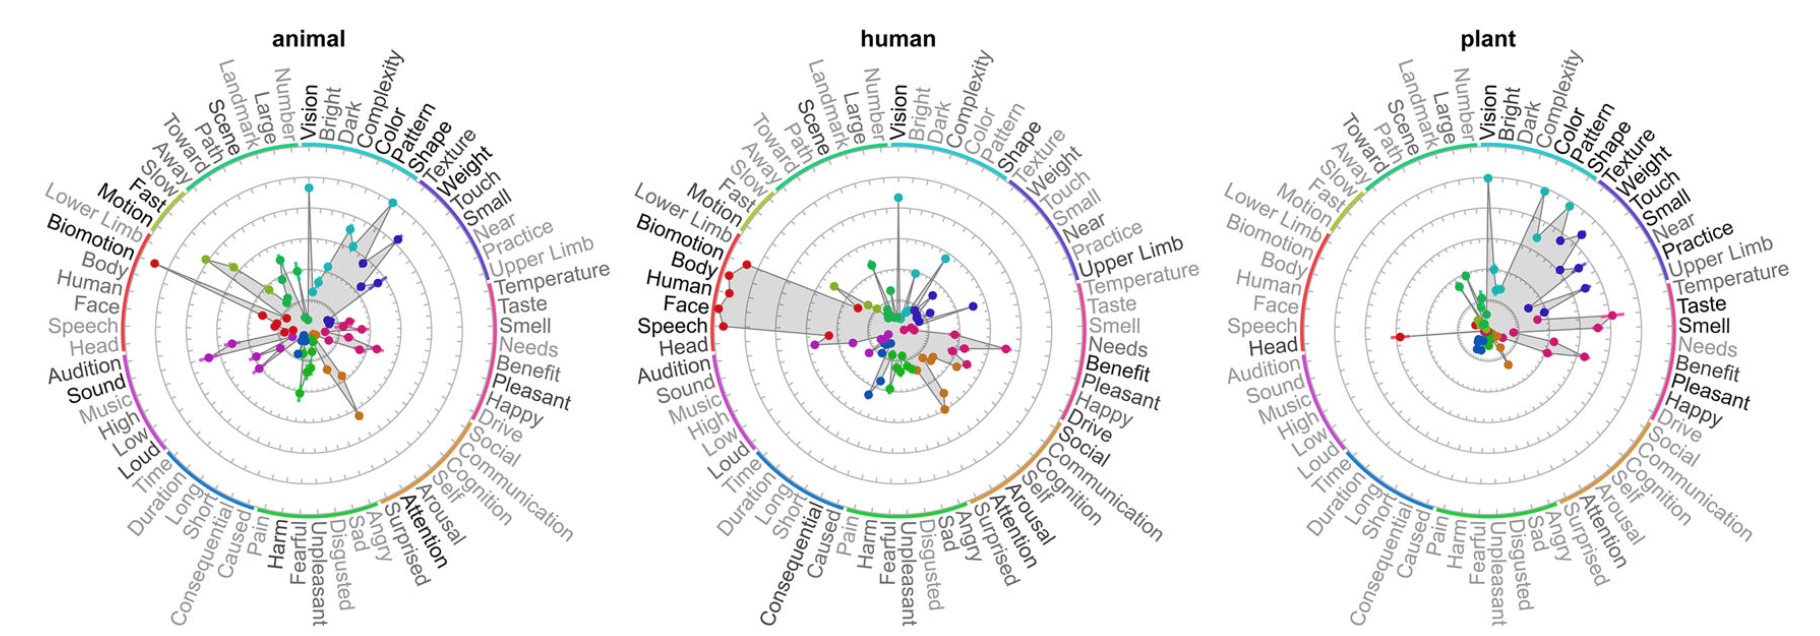
Average ratings for some categories of words
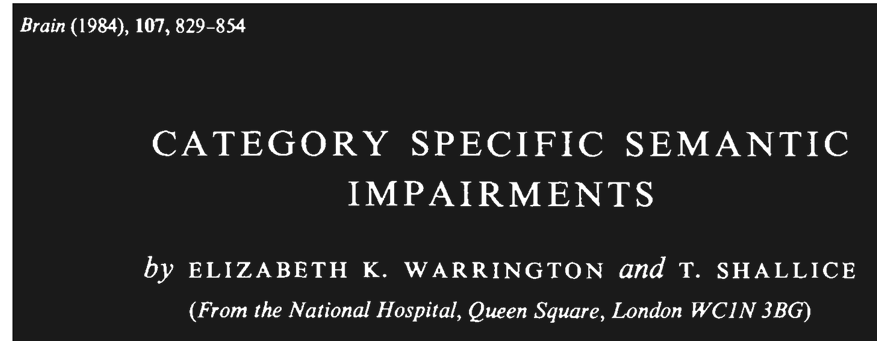
Cognitive Neuropsychology
- Events and objects separate cleanly from the ratings
- Behavioral ratings do well at capturing natural categories
Clustering Analysis
Summary
- Experiential ratings inform us about what is important for concepts
- Need to us fMRI to tell us where in the brain these concepts are represented
Suppose we have two models (or representations of the data). How do we compare them?
| Taste | Shape | Color | |
|---|---|---|---|
| Car | 0 | 4.2 | 4.9 |
| Airplane | 0 | 5.1 | 4.3 |
| Chicken | 5.5 | 2.2 | 2.2 |
| Voxel 1 | Voxel 2 | Voxel 3 | Voxel 4 | Voxel 5 | |
|---|---|---|---|---|---|
| Car | .23 | .58 | .49 | .78 | .86 |
| Airplane | .98 | .28 | .34 | .18 | .52 |
| Chicken | .62 | .82 | .91 | .36 | .17 |
Model 2
Model 1
Representational Similarity Analysis
How we compare models?
| Taste | Shape | Color | |
|---|---|---|---|
| Car | 0 | 4.2 | 4.9 |
| Airplane | 0 | 5.1 | 4.3 |
| Chicken | 5.5 | 2.2 | 2.2 |
| Taste | Shape | Color | |
|---|---|---|---|
| Car | 0 | 4.2 | 4.9 |
| Airplane | 0 | 5.1 | 4.3 |
| Chicken | 5.5 | 2.2 | 2.2 |
| Car | Airplane | Chicken | |
|---|---|---|---|
| Car | |||
| Airplane | |||
| Chicken |
RSA
How we compare models?
| Taste | Shape | Color | |
|---|---|---|---|
| Car | 0 | 4.2 | 4.9 |
| Airplane | 0 | 5.1 | 4.3 |
| Chicken | 5.5 | 2.2 | 2.2 |
| Taste | Shape | Color | |
|---|---|---|---|
| Car | 0 | 4.2 | 4.9 |
| Airplane | 0 | 5.1 | 4.3 |
| Chicken | 5.5 | 2.2 | 2.2 |
| Car | Airplane | Chicken | |
|---|---|---|---|
| Car | 1 | ||
| Airplane | |||
| Chicken |
RSA
How we compare models?
| Taste | Shape | Color | |
|---|---|---|---|
| Car | 0 | 4.2 | 4.9 |
| Airplane | 0 | 5.1 | 4.3 |
| Chicken | 5.5 | 2.2 | 2.2 |
| Taste | Shape | Color | |
|---|---|---|---|
| Car | 0 | 4.2 | 4.9 |
| Airplane | 0 | 5.1 | 4.3 |
| Chicken | 5.5 | 2.2 | 2.2 |
| Car | Airplane | Chicken | |
|---|---|---|---|
| Car | 1 | .62 | |
| Airplane | |||
| Chicken |
RSA
How we compare models?
| Taste | Shape | Color | |
|---|---|---|---|
| Car | 0 | 4.2 | 4.9 |
| Airplane | 0 | 5.1 | 4.3 |
| Chicken | 5.5 | 2.2 | 2.2 |
| Taste | Shape | Color | |
|---|---|---|---|
| Car | 0 | 4.2 | 4.9 |
| Airplane | 0 | 5.1 | 4.3 |
| Chicken | 5.5 | 2.2 | 2.2 |
| Car | Airplane | Chicken | |
|---|---|---|---|
| Car | 1 | .62 | .1 |
| Airplane | 1 | .12 | |
| Chicken |
| Taste | Shape | Color | |
|---|---|---|---|
| Car | 0 | 4.2 | 4.9 |
| Airplane | 0 | 5.1 | 4.3 |
| Chicken | 5.5 | 2.2 | 2.2 |
| Taste | Shape | Color | |
|---|---|---|---|
| Car | 0 | 4.2 | 4.9 |
| Airplane | 0 | 5.1 | 4.3 |
| Chicken | 5.5 | 2.2 | 2.2 |
| Car | Airplane | Chicken | |
|---|---|---|---|
| Car | 1 | .62 | .1 |
| Airplane | 1 | .12 | |
| Chicken | 1 |
| Voxel 1 | Voxel 2 | Voxel 3 | Voxel 4 | Voxel 5 | |
|---|---|---|---|---|---|
| Car | .23 | .58 | .49 | .78 | .86 |
| Airplane | .98 | .28 | .34 | .18 | .52 |
| Chicken | .62 | .82 | .91 | .36 | .17 |
| Voxel 1 | Voxel 2 | Voxel 3 | Voxel 4 | Voxel 5 | |
|---|---|---|---|---|---|
| Car | .23 | .58 | .49 | .78 | .86 |
| Airplane | .98 | .28 | .34 | .18 | .52 |
| Chicken | .62 | .82 | .91 | .36 | .17 |
| Car | Airplane | Chicken | |
|---|---|---|---|
| Car | 1 | .42 | .06 |
| Airplane | 1 | .31 | |
| Chicken | 1 |
Does it Work?
- We can use this procedure to compare any set of models!
- Two models we can compare are the visual similarities of the words and the \(\beta\) values regressed out!
- A simple metric for visual similarity is percent overlap
hello
world
hello
world
Left Hemisphere
Right Hemisphere
*These responses aren't corrected for multiple-comparisons. The spurious correlations do not survive correction
RSA Searchlight - CREA65
SVM Searchlight - Events > Objects
Credit: Tony Tong
Other Aims
- A major component of this project is the computational modelling of experiential features
- Utilize datasets which contain thousands of video labelled video segments
- Two general goals
- Why do some categories have spatial localization?
- How does the task influence spatial localization?

Visual input
Auditory input
Example of the detected action "blowing out candles"
Summary
- Experiental ratings capture an important part of concept representation
- We can use fMRI to study category localization
- Look at conditions necessary to induce "spatial localization" of categories in artificial neural networks
Future Directions
MSTP:
Joseph Barbieri, PhD
Calvin Williams, MD, PhD
Nita Salzman, MD, PhD
Gil White, MD
Sid Rao, MD, PhD
Ann Moll
Kim Peplinksi
Language Lab:
Jeffrey Binder, MD
Leonardo Fernandino, PhD
Songhee Kim, PhD
Lisa Conant, PhD
Alex Helfand, PhD
Jia-Qing Tong
RCC
Matt Flister, PhD
Biophysics
Can I Interest you in some links?
- Langauge Lab - https://www.neuro.mcw.edu/
- Wernicke Paper - OneDrive Link (large)
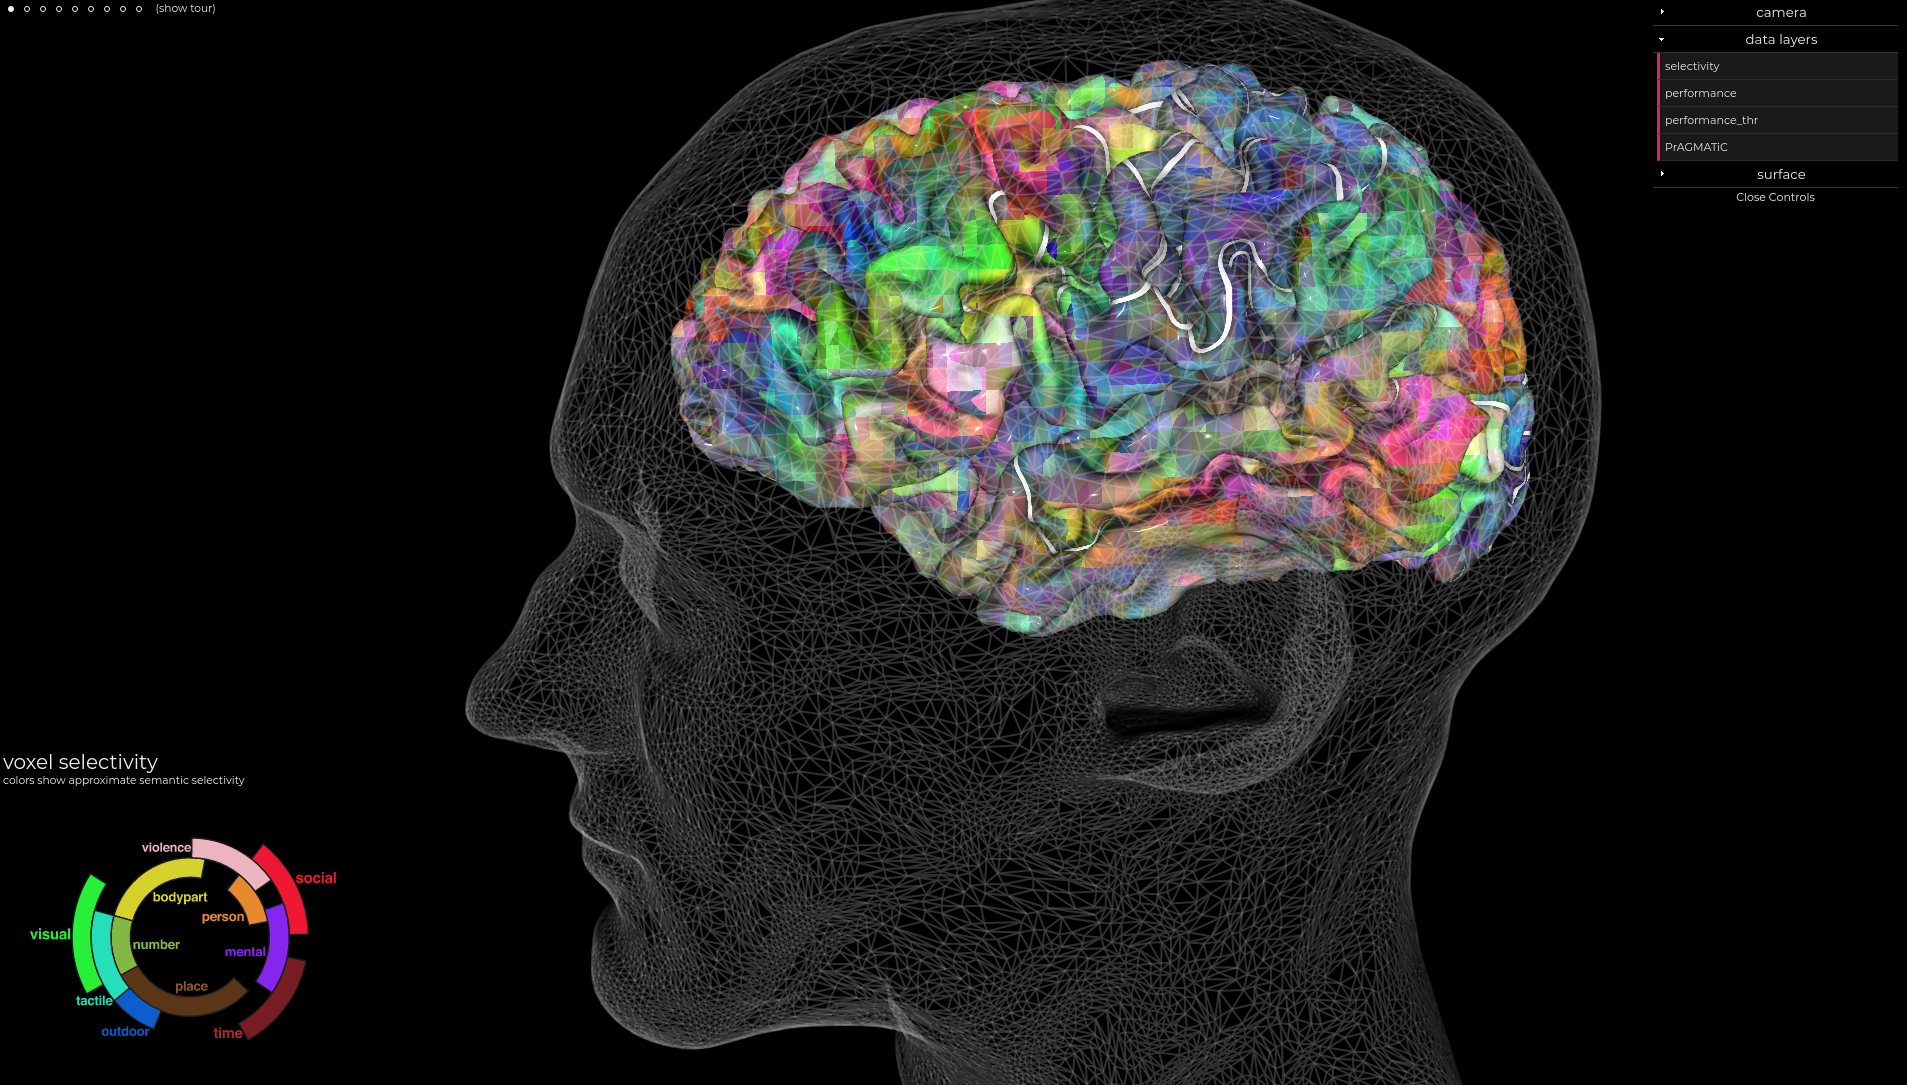
- Huth (Interactive Demo) - https://www.nature.com/articles/nature17637 - https://gallantlab.org/huth2016/
- Where is Semantic System? - (PDF)
- Experiential Ratings - (PDF)
- Questions, comments, concerns? \( \rightarrow \) smazurchuk@mcw.edu
Clinical Relevance
- Currently, only approved clinical use of fMRI is for pre-surgical mapping
- Improved mechanistic knowledge can minimize surgical morbidity
- Do not know the intermediate representations that exist in the brain
- Knowledge could help improve stroke/surgical prognosis ability
- Unable to explain how abstract concepts are stored in the brain
- Abstract words are the vast majority of our daily lexicon. Important to understand
Huth, A., de Heer, W., Griffiths, T. et al. Natural speech reveals the semantic maps that tile human cerebral cortex. Nature 532, 453–458 (2016). https://doi.org/10.1038/nature17637