Currently watching resting state data collected on our scanner
(
)
RIP 2021
Stephen Mazurchuk
Imaging Concepts
Currently watching resting state data collected on our scanner
(
)
Language Imaging Laboratory
Central Question:
What are the neural substrates that support concept representation?
Why?
- In general, there are many parts of the cortex that might be lesioned, and we want to be able to know what functions are supported by different regions
- Following focal lesions to the cortex, some patients have demonstrated selective impairments for knowledge about particular categories of things
Why should something like word meaning be localizable in the cortex?
Outline
- Brief history on concept representation
- What are concepts?
- How well can fMRI probe semantic representations?
- Introduction to representational similarity analysis
- Noise ceiling analysis
- Evidence in support of experiential models of concept representation
- Explaining individual concept activation patterns
- Explaining the emergence of semantic category deficits
Brief History
A
Brief History
A
not so
Plato
Aristotle
Universals (forms)
-
Cratylus (c. 390 BC)
- First recognition that regardless of the name, there exists a similarity (or form) that "horses" share, but cows, for example, do not
- Unchanging abstractions that make up the proper objects of human knowledge
- Locate the universal in things
- Identify shared common properties lying in the particulars
- Noticed the ever changing flux of meaning
- Words are symptoms or signs of mental states
* universals boded well with Christian theology
Empiricism
- Ideas and knowledge develop as a result of sensory images
- Contrast with rationalism
John Locke
David Hume
Essay Concerning Human Understanding
(17th Century)
"Tabula rasa"
Early Modern Period
"label these residuals of stimulation with which the cortex is populated "memory images" and would emphasize the differentiation of such from the sensory stimulation itself"
Wernicke. (1874). Der Aphasiche Symptomencomplex.
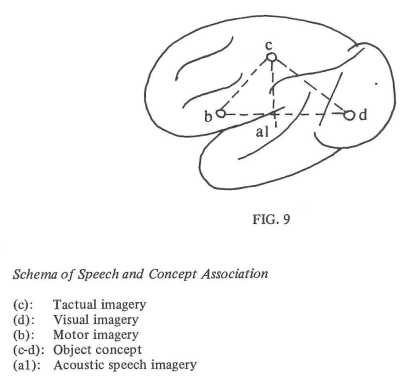
Carl Wernicke
- Basis of experiential models
Early Modern Period
"label these residuals of stimulation with which the cortex is populated "memory images" and would emphasize the differentiation of such from the sensory stimulation itself"
Wernicke. (1874). Der Aphasiche Symptomencomplex.
"The concept of the word "bell," for example, is formed by the associated memory images of visual, tactual and auditory perceptions. These memory images represent the essential characteristic features of the object, bell."
Carl Wernicke
- Basis of experiential models
Experiential Models
Experiential Models
Experiential Models
Animal
Vehicle
Tool
Plant
Experiential Models
Here forth called CREA
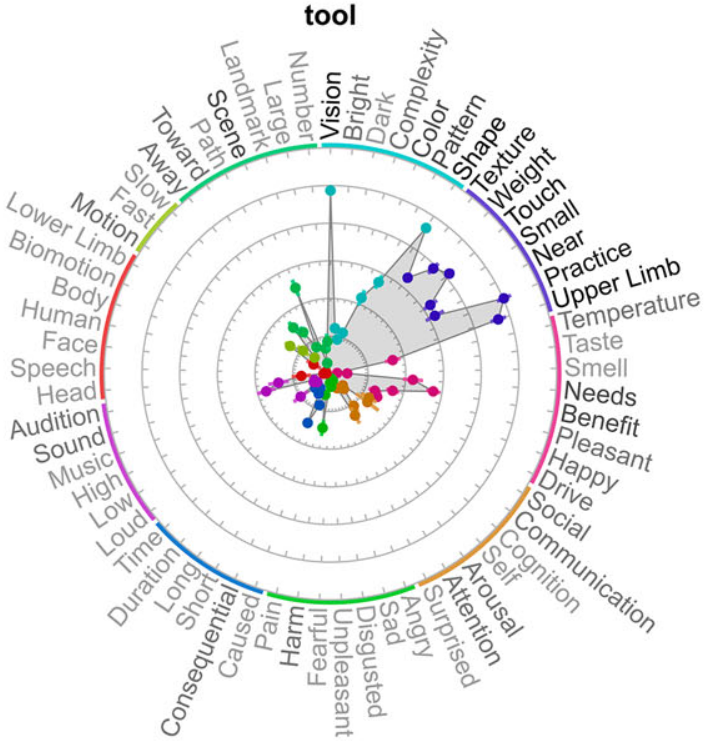
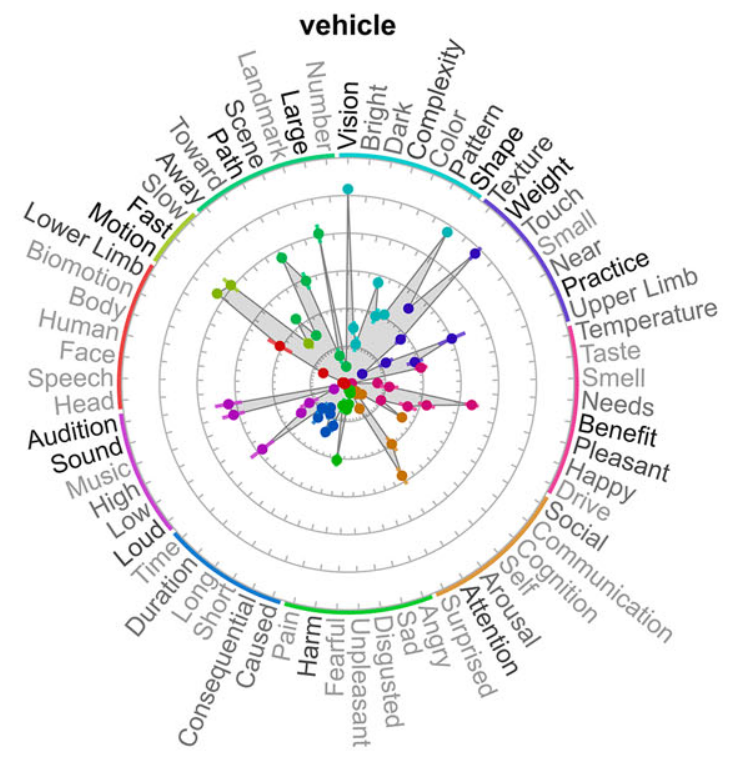
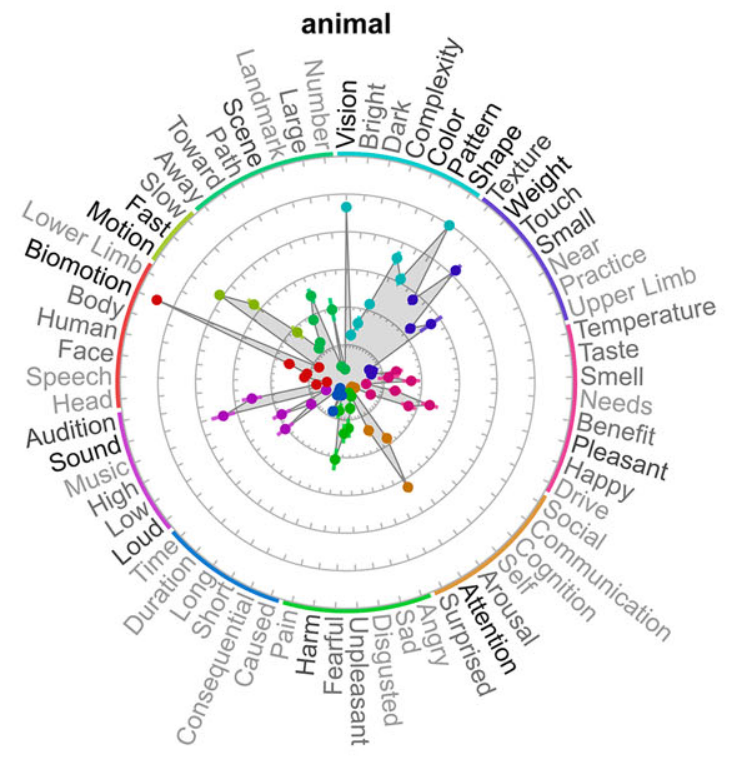
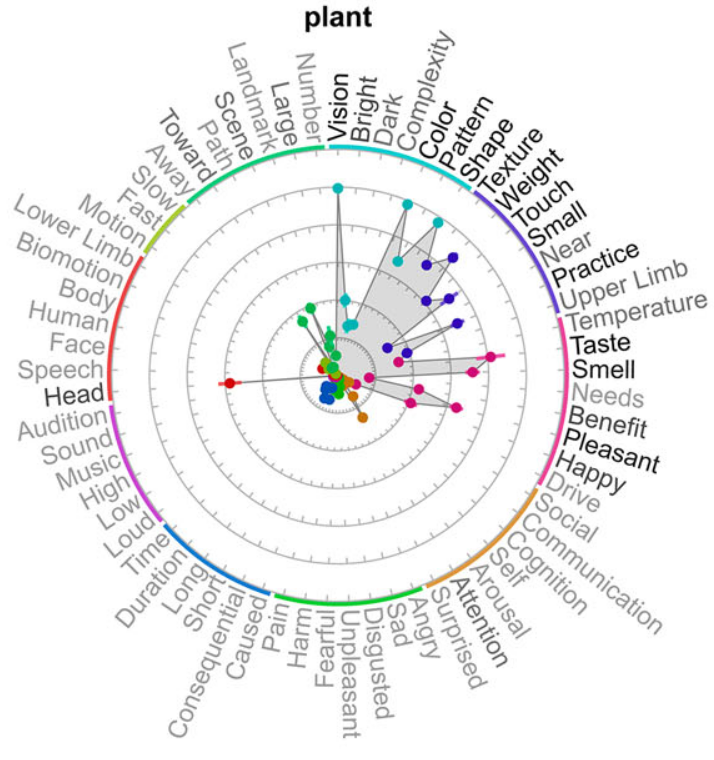
Animal
Vehicle
Tool
Plant
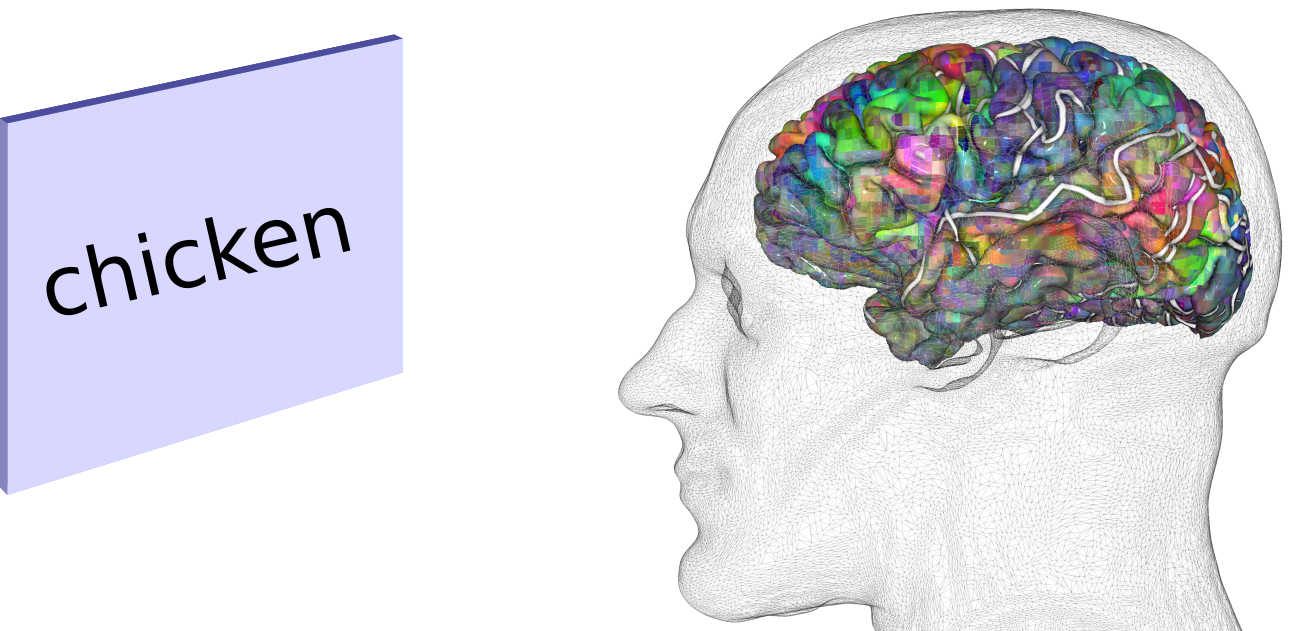
The Question
What information can fMRI tell us about concept representation?
(for today)
The tool
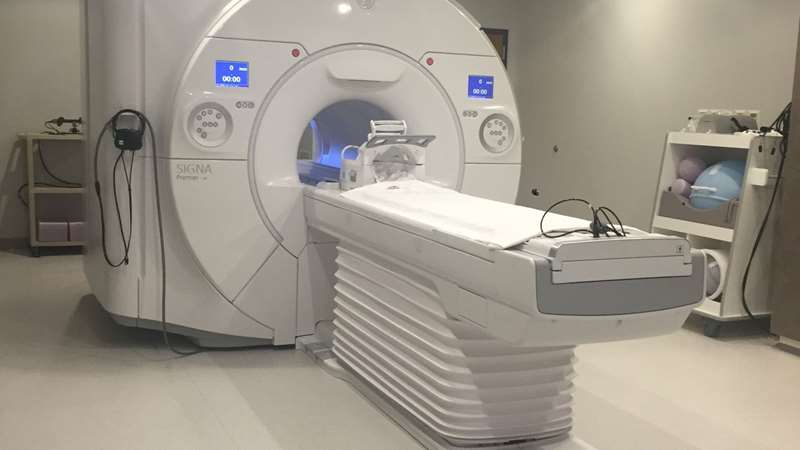

Extra Steps
- Control for imaging artifacts
- In order to study group effect
- Most processing on the surface
--> Susceptibility correction, Nuisance regressors
--> project volumetric data to cortical surface
--> warp data to common space
Surface normalization
Pial Surface Segmentation
So ...
Given that we have:
- A tool that generates a number for how responsive a brain region is to a concept
- A model (hypothesis) that predicts how similar or dissimilar two concepts are
How do we compare the model to the data??
We compare if the similarity between pairs of neural activation patterns correlates with the model-predicted pairwise similarity
Banana
Representational Similarity Analysis
Suppose we have two models (or representations of the data). How do we compare them?
| Taste | Shape | Color | |
|---|---|---|---|
| Car | 0 | 4.2 | 4.9 |
| Airplane | 0 | 5.1 | 4.3 |
| Chicken | 5.5 | 2.2 | 2.2 |
| Voxel 1 | Voxel 2 | Voxel 3 | Voxel 4 | Voxel 5 | |
|---|---|---|---|---|---|
| Car | .23 | .58 | .49 | .78 | .86 |
| Airplane | .98 | .28 | .34 | .18 | .52 |
| Chicken | .62 | .82 | .91 | .36 | .17 |
Model 2
Model 1
Representational Similarity Analysis
How we compare models?
| Taste | Shape | Color | |
|---|---|---|---|
| Car | 0 | 4.2 | 4.9 |
| Airplane | 0 | 5.1 | 4.3 |
| Chicken | 5.5 | 2.2 | 2.2 |
| Taste | Shape | Color | |
|---|---|---|---|
| Car | 0 | 4.2 | 4.9 |
| Airplane | 0 | 5.1 | 4.3 |
| Chicken | 5.5 | 2.2 | 2.2 |
| Car | Airplane | Chicken | |
|---|---|---|---|
| Car | |||
| Airplane | |||
| Chicken |
RSA
How we compare models?
| Taste | Shape | Color | |
|---|---|---|---|
| Car | 0 | 4.2 | 4.9 |
| Airplane | 0 | 5.1 | 4.3 |
| Chicken | 5.5 | 2.2 | 2.2 |
| Taste | Shape | Color | |
|---|---|---|---|
| Car | 0 | 4.2 | 4.9 |
| Airplane | 0 | 5.1 | 4.3 |
| Chicken | 5.5 | 2.2 | 2.2 |
| Car | Airplane | Chicken | |
|---|---|---|---|
| Car | 1 | ||
| Airplane | |||
| Chicken |
RSA
How we compare models?
| Taste | Shape | Color | |
|---|---|---|---|
| Car | 0 | 4.2 | 4.9 |
| Airplane | 0 | 5.1 | 4.3 |
| Chicken | 5.5 | 2.2 | 2.2 |
| Taste | Shape | Color | |
|---|---|---|---|
| Car | 0 | 4.2 | 4.9 |
| Airplane | 0 | 5.1 | 4.3 |
| Chicken | 5.5 | 2.2 | 2.2 |
| Car | Airplane | Chicken | |
|---|---|---|---|
| Car | 1 | .62 | |
| Airplane | |||
| Chicken |
RSA
How we compare models?
| Taste | Shape | Color | |
|---|---|---|---|
| Car | 0 | 4.2 | 4.9 |
| Airplane | 0 | 5.1 | 4.3 |
| Chicken | 5.5 | 2.2 | 2.2 |
| Taste | Shape | Color | |
|---|---|---|---|
| Car | 0 | 4.2 | 4.9 |
| Airplane | 0 | 5.1 | 4.3 |
| Chicken | 5.5 | 2.2 | 2.2 |
| Car | Airplane | Chicken | |
|---|---|---|---|
| Car | 1 | .62 | .1 |
| Airplane | 1 | .12 | |
| Chicken |
| Taste | Shape | Color | |
|---|---|---|---|
| Car | 0 | 4.2 | 4.9 |
| Airplane | 0 | 5.1 | 4.3 |
| Chicken | 5.5 | 2.2 | 2.2 |
| Taste | Shape | Color | |
|---|---|---|---|
| Car | 0 | 4.2 | 4.9 |
| Airplane | 0 | 5.1 | 4.3 |
| Chicken | 5.5 | 2.2 | 2.2 |
| Car | Airplane | Chicken | |
|---|---|---|---|
| Car | 1 | .62 | .1 |
| Airplane | 1 | .12 | |
| Chicken | 1 |
| Voxel 1 | Voxel 2 | Voxel 3 | Voxel 4 | Voxel 5 | |
|---|---|---|---|---|---|
| Car | .23 | .58 | .49 | .78 | .86 |
| Airplane | .98 | .28 | .34 | .18 | .52 |
| Chicken | .62 | .82 | .91 | .36 | .17 |
| Voxel 1 | Voxel 2 | Voxel 3 | Voxel 4 | Voxel 5 | |
|---|---|---|---|---|---|
| Car | .23 | .58 | .49 | .78 | .86 |
| Airplane | .98 | .28 | .34 | .18 | .52 |
| Chicken | .62 | .82 | .91 | .36 | .17 |
| Car | Airplane | Chicken | |
|---|---|---|---|
| Car | 1 | .42 | .06 |
| Airplane | 1 | .31 | |
| Chicken | 1 |
Called a DSM
Model 1
- Word voxel activation patterns
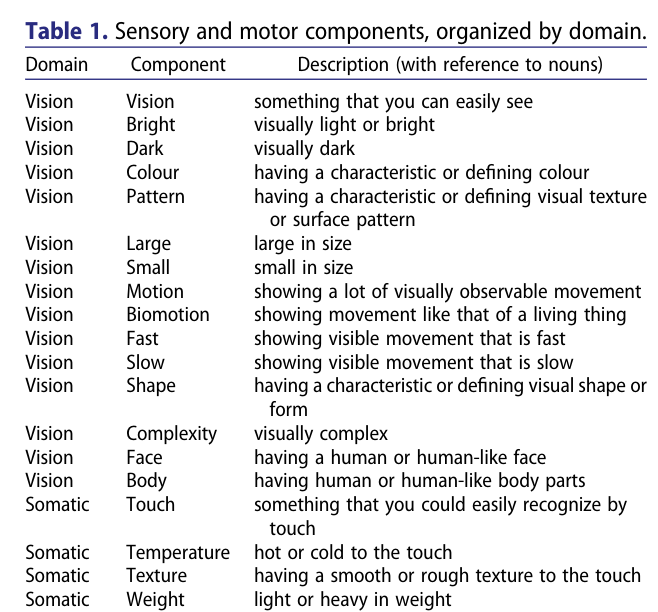
Model 2
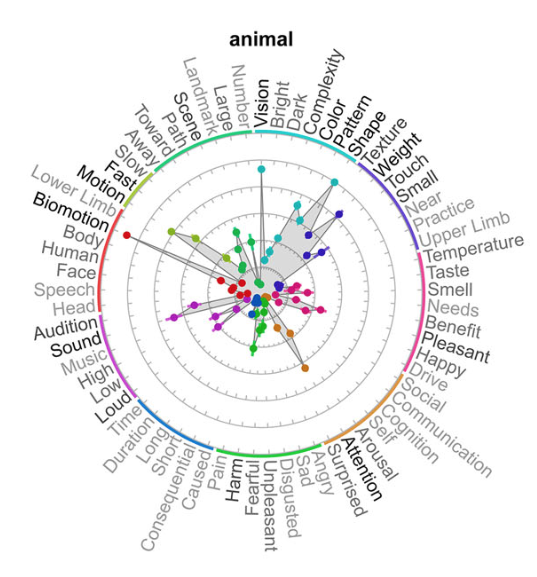
- Word attribute ratings
Advice
Banana
Celebration
Note:
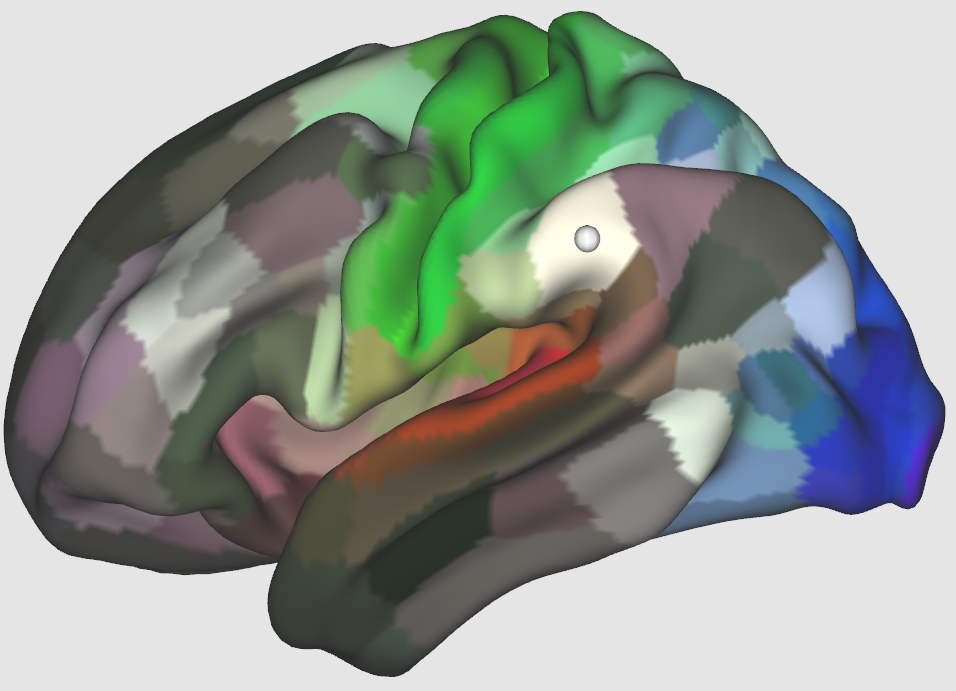
- Some regions of the cortex have been consistently measured to be involved with language
- We will limit ourselves to only looking at activation patterns from vertices within a liberal estimation of the generally accepted semantic areas
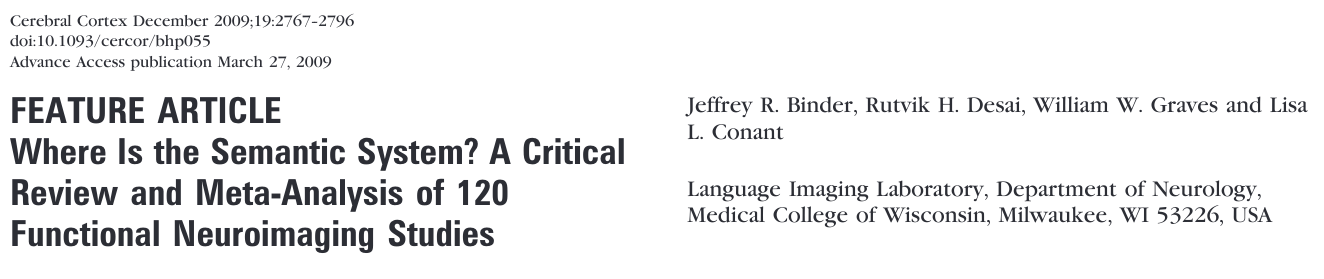
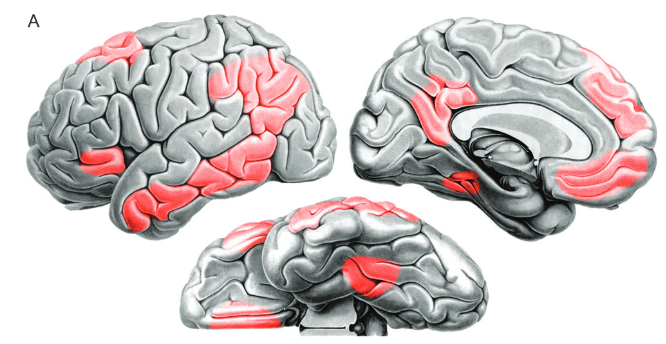
Yeo, T. B. et al. The organization of the human cerebral cortex estimated by intrinsic functional connectivity. J Neurophysiol 106, 1125–1165 (2011).
Result

Result
But, is this a good result?
Depends if subjects correlate with each other

Put Another way

So, is the model good?
Yes!
Our model does better than the between subject correlation
Yes!
Our model does better than the between subject correlation
But
Yes!
Our model does better than the between subject correlation
But
What's the best it could be?
The Noise Ceiling
Q:
What vector would have the smallest distance
- Imagine a bunch of two dimensional vectors
(most similarity)
to all of the vectors?
The average vector!
The best
The best that a model could be is given by:
The average correlation of one subject's similarity matrix with the average similarity matrix of all other subjects
Intuition
- The best possible model to the data is just the average similarity matrix of the subjects
- If subjects don't look like the average of all other subjects, than there is no shared variance!
Noise Ceiling

The model is about 1/2 as good as the best model to the data
Can we see where the model correlates?
One approach would be doing RSA within many different ROI's
... The computationally exhaustive approach would be to generate a ROI at every vertext
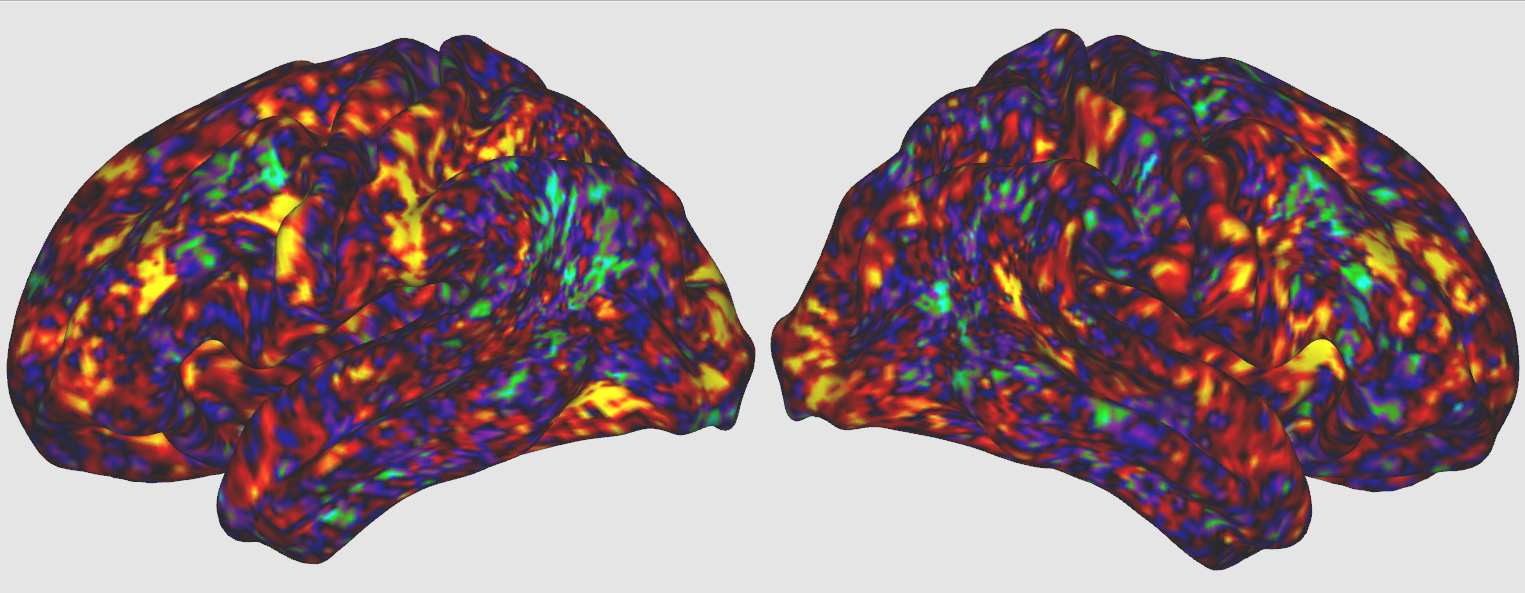
Searchlight
- RSA is performed at each vertex on the surface
Result
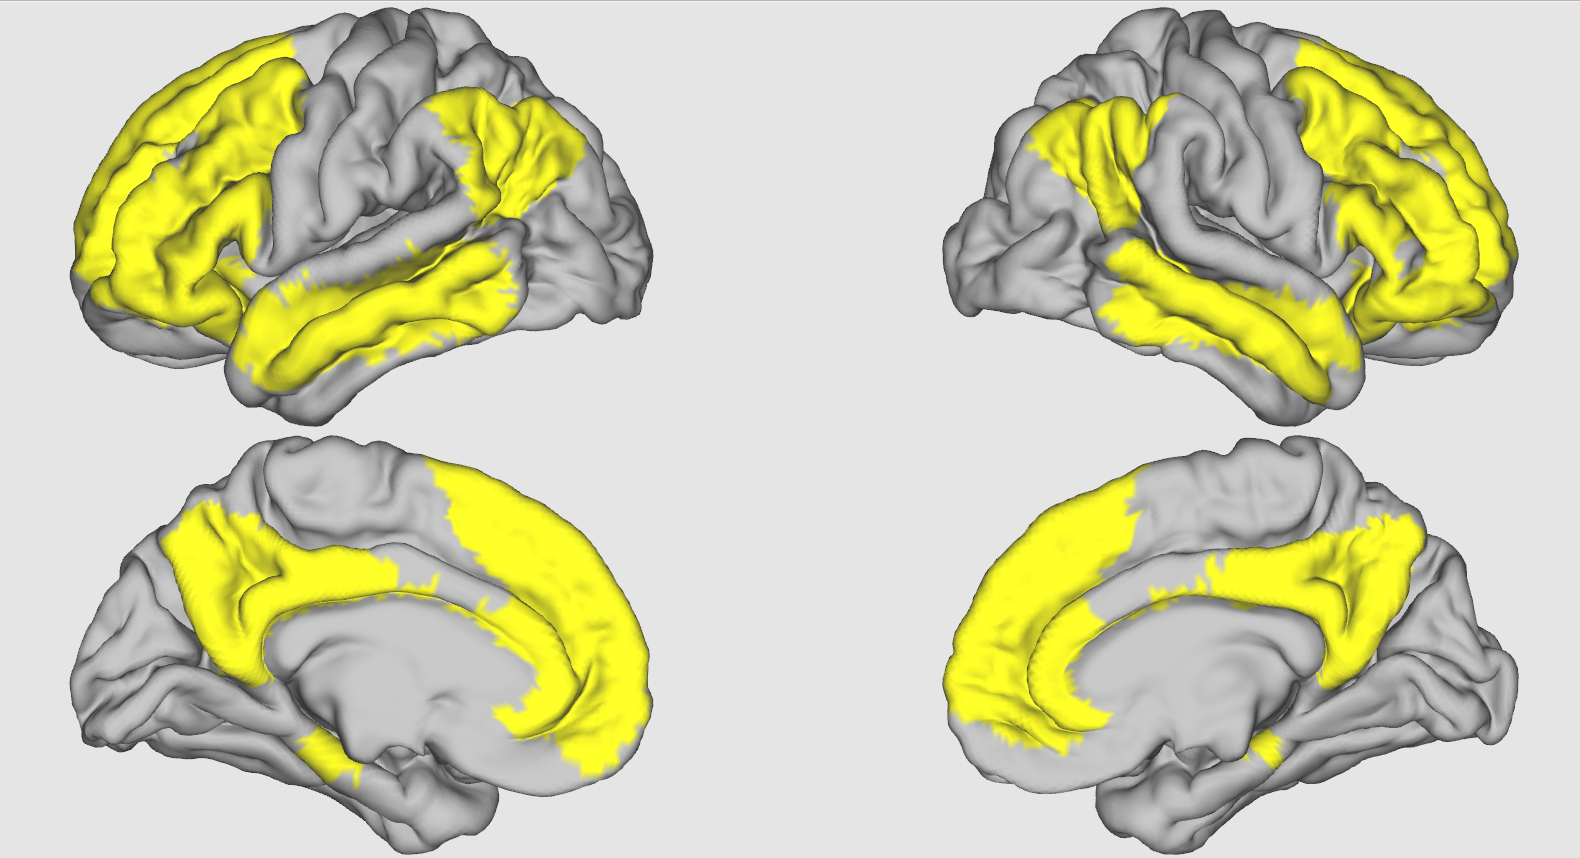
Searchlight With CREA
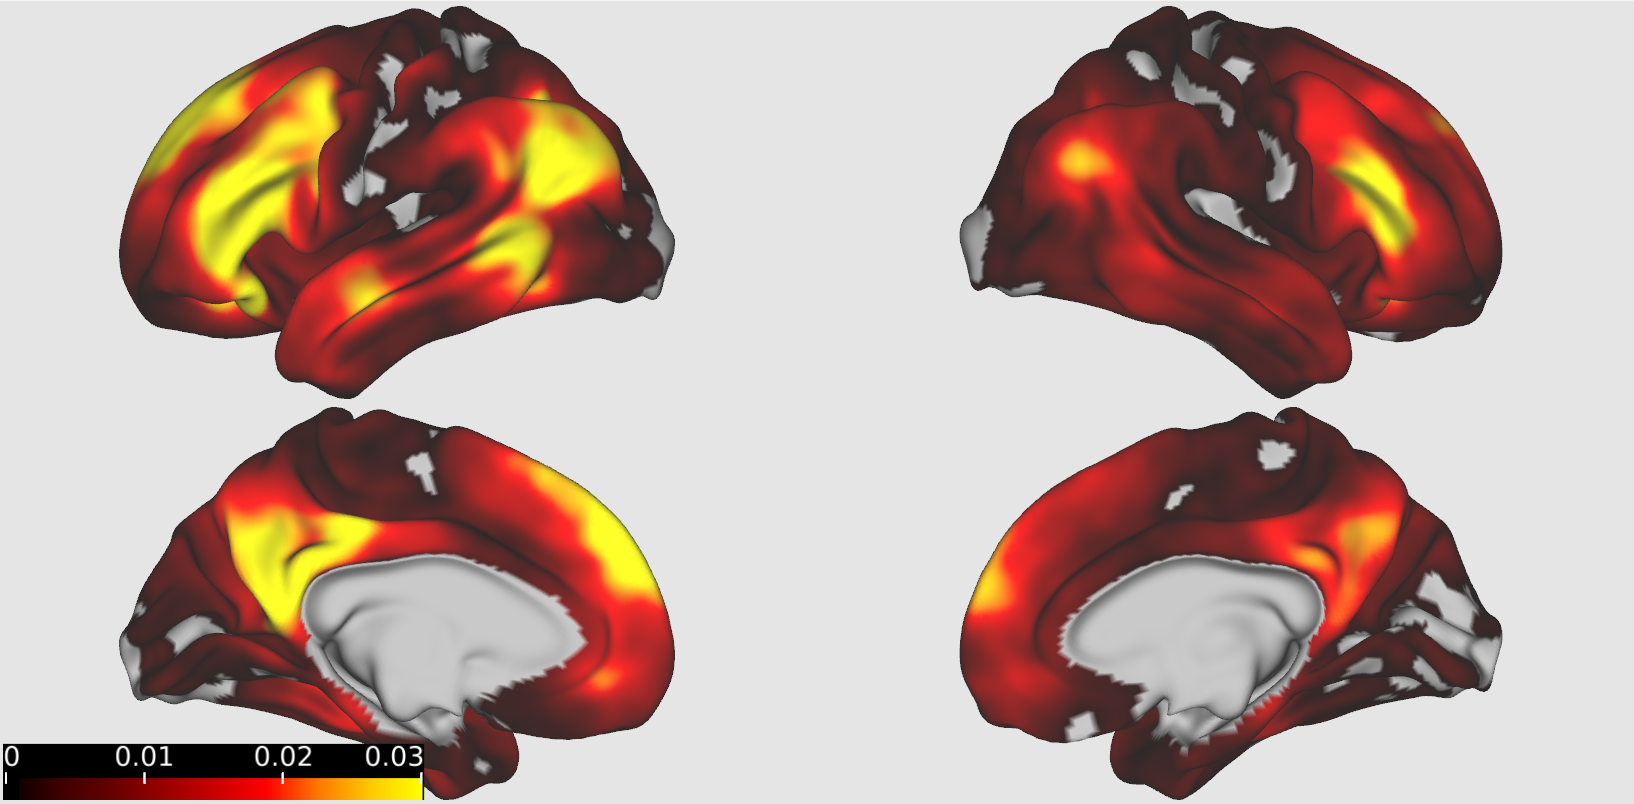
Searchlight With CREA - T Values
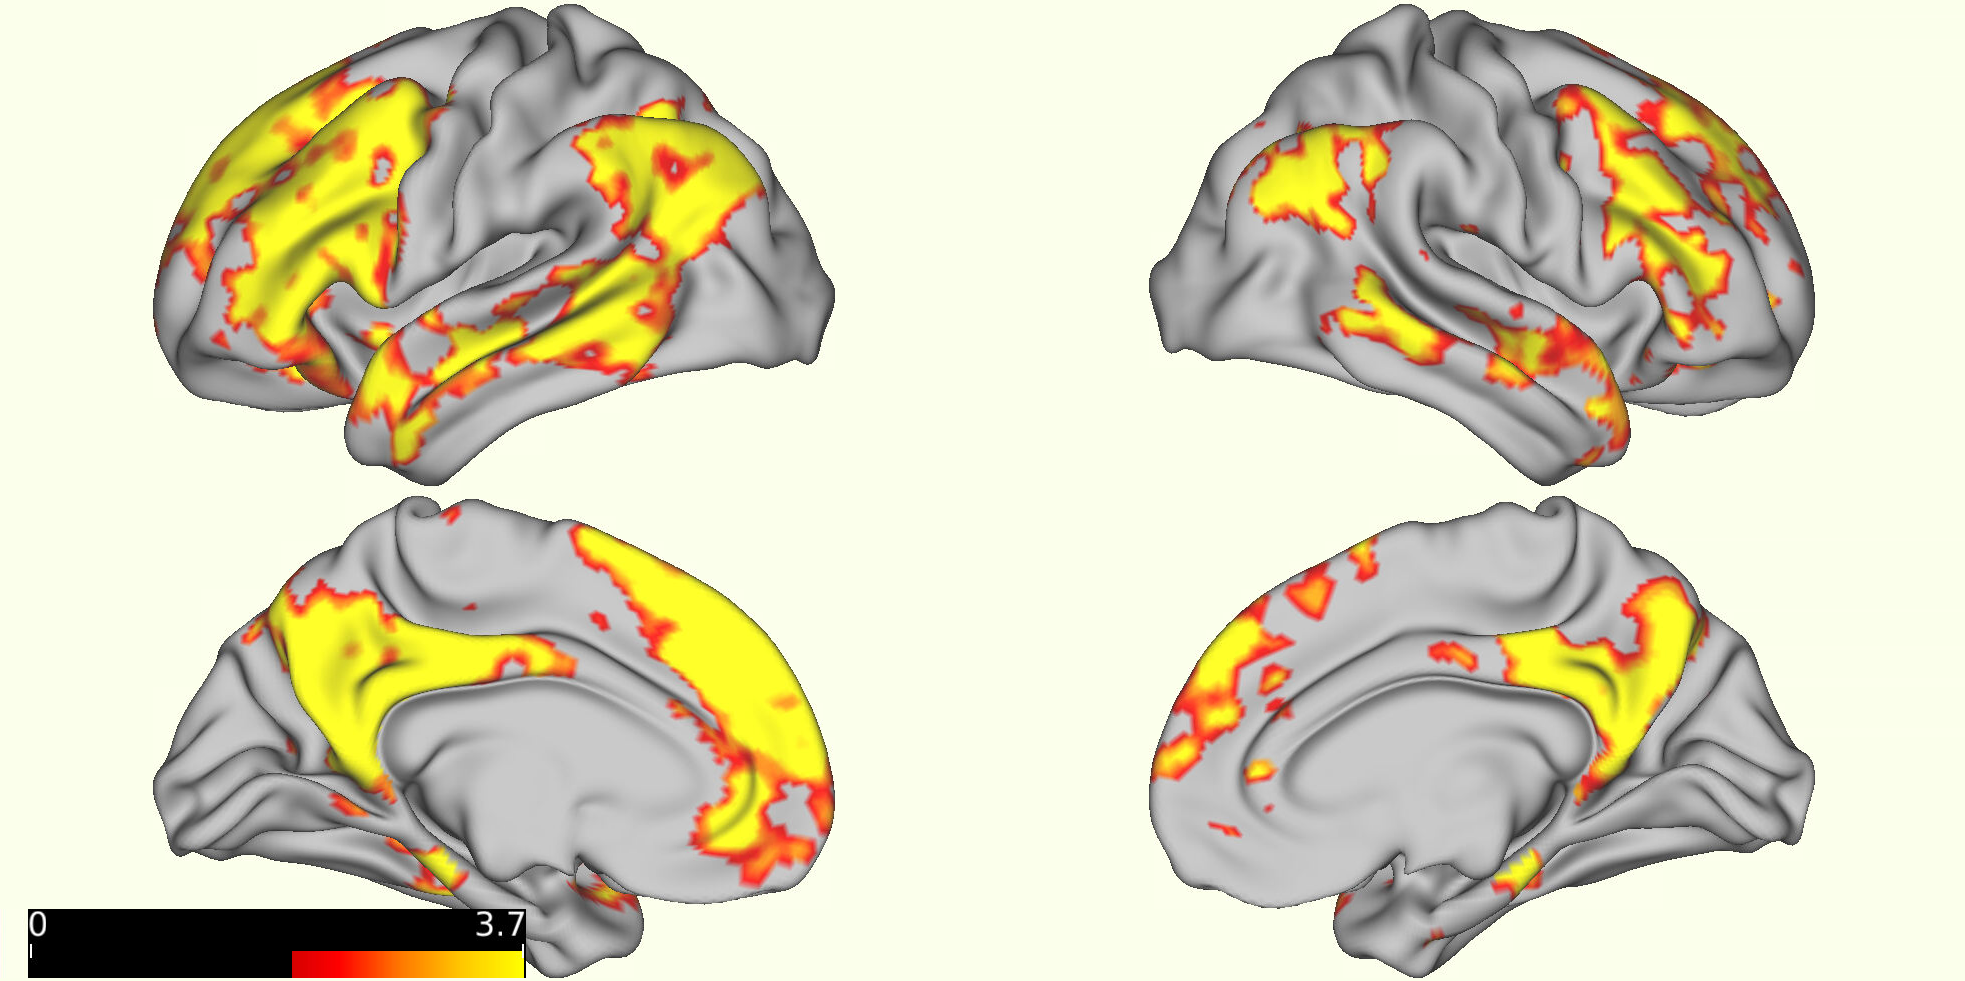
*FWE corrected, threshold at p=.05
What about searchlight based noise ceiling?
Average Correlation with All Others
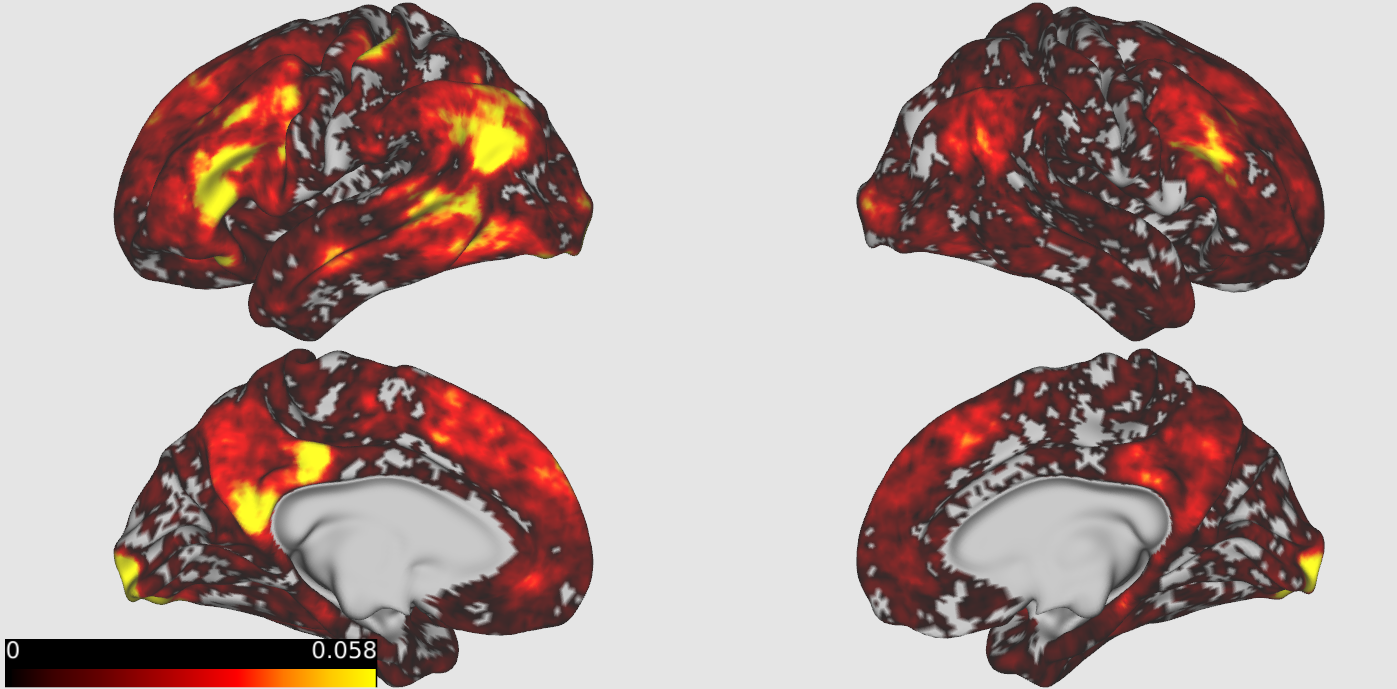
Correlation - T Value
Overlap
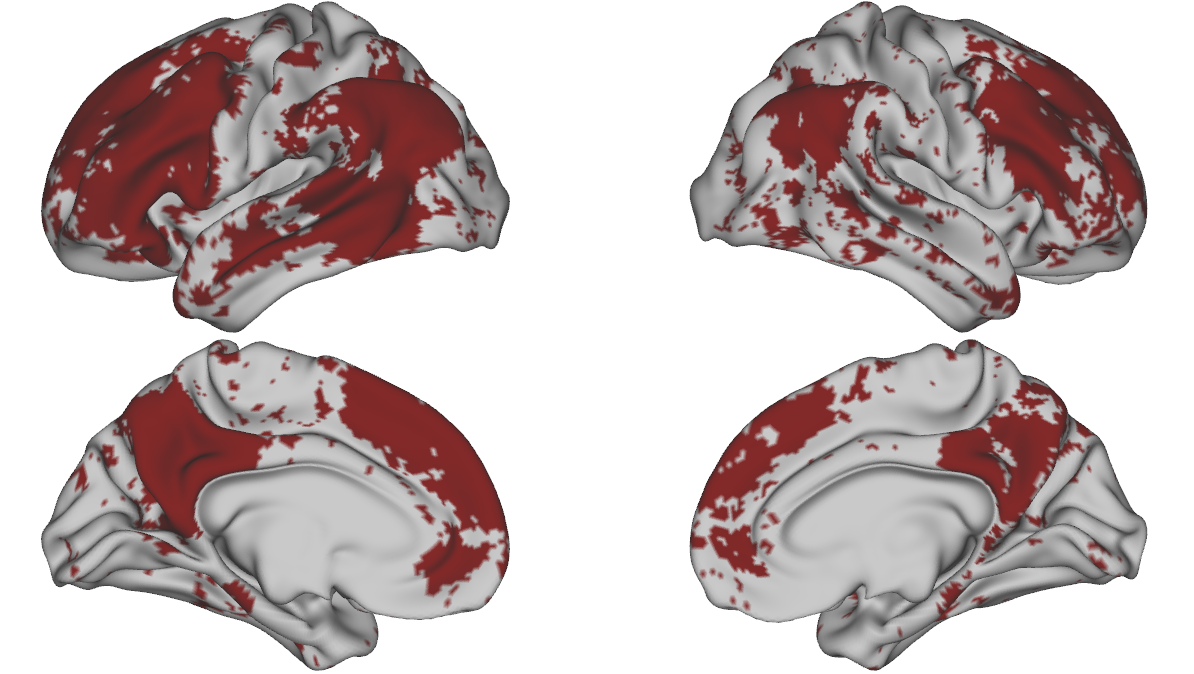
Regions where CREA is at least 20% of the noise ceiling
&
Noise ceiling is > .01
Takeaway 1)
- Experiential (CREA) model accounts for most of the shared variance in single word presentation fMRI paradigms
Takeaway 1)
- Experiential (CREA) model accounts for most of the shared variance in single word presentation fMRI paradigms
Question:
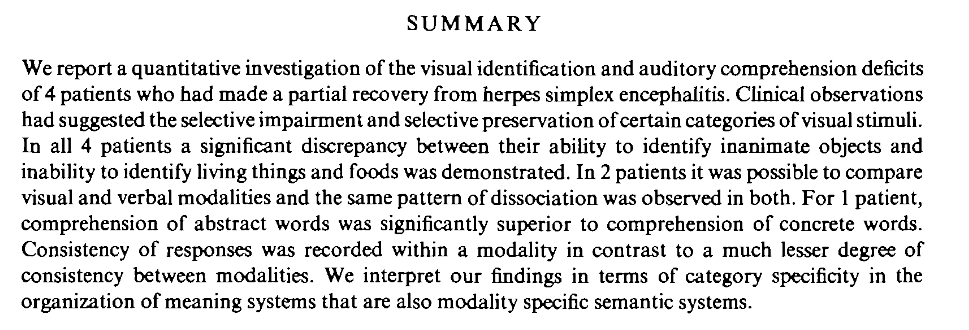
- Does CREA explain the emergence of category specific deficits?
The Development of Categories
Earliest Reference
"These three cases then suggest that animate objects may be recognized and revisualized by the left occipital lobe while the same functions for inanimate objects proceed through functional activity of the right lobe"
* 2nd revised edition, 1940
Early Modern Period
Cortex, 1966
"Impairment of auditory comprehension for body part names, but not for object names"
Experiential Evidence for Semantic Category Localization
Body Parts
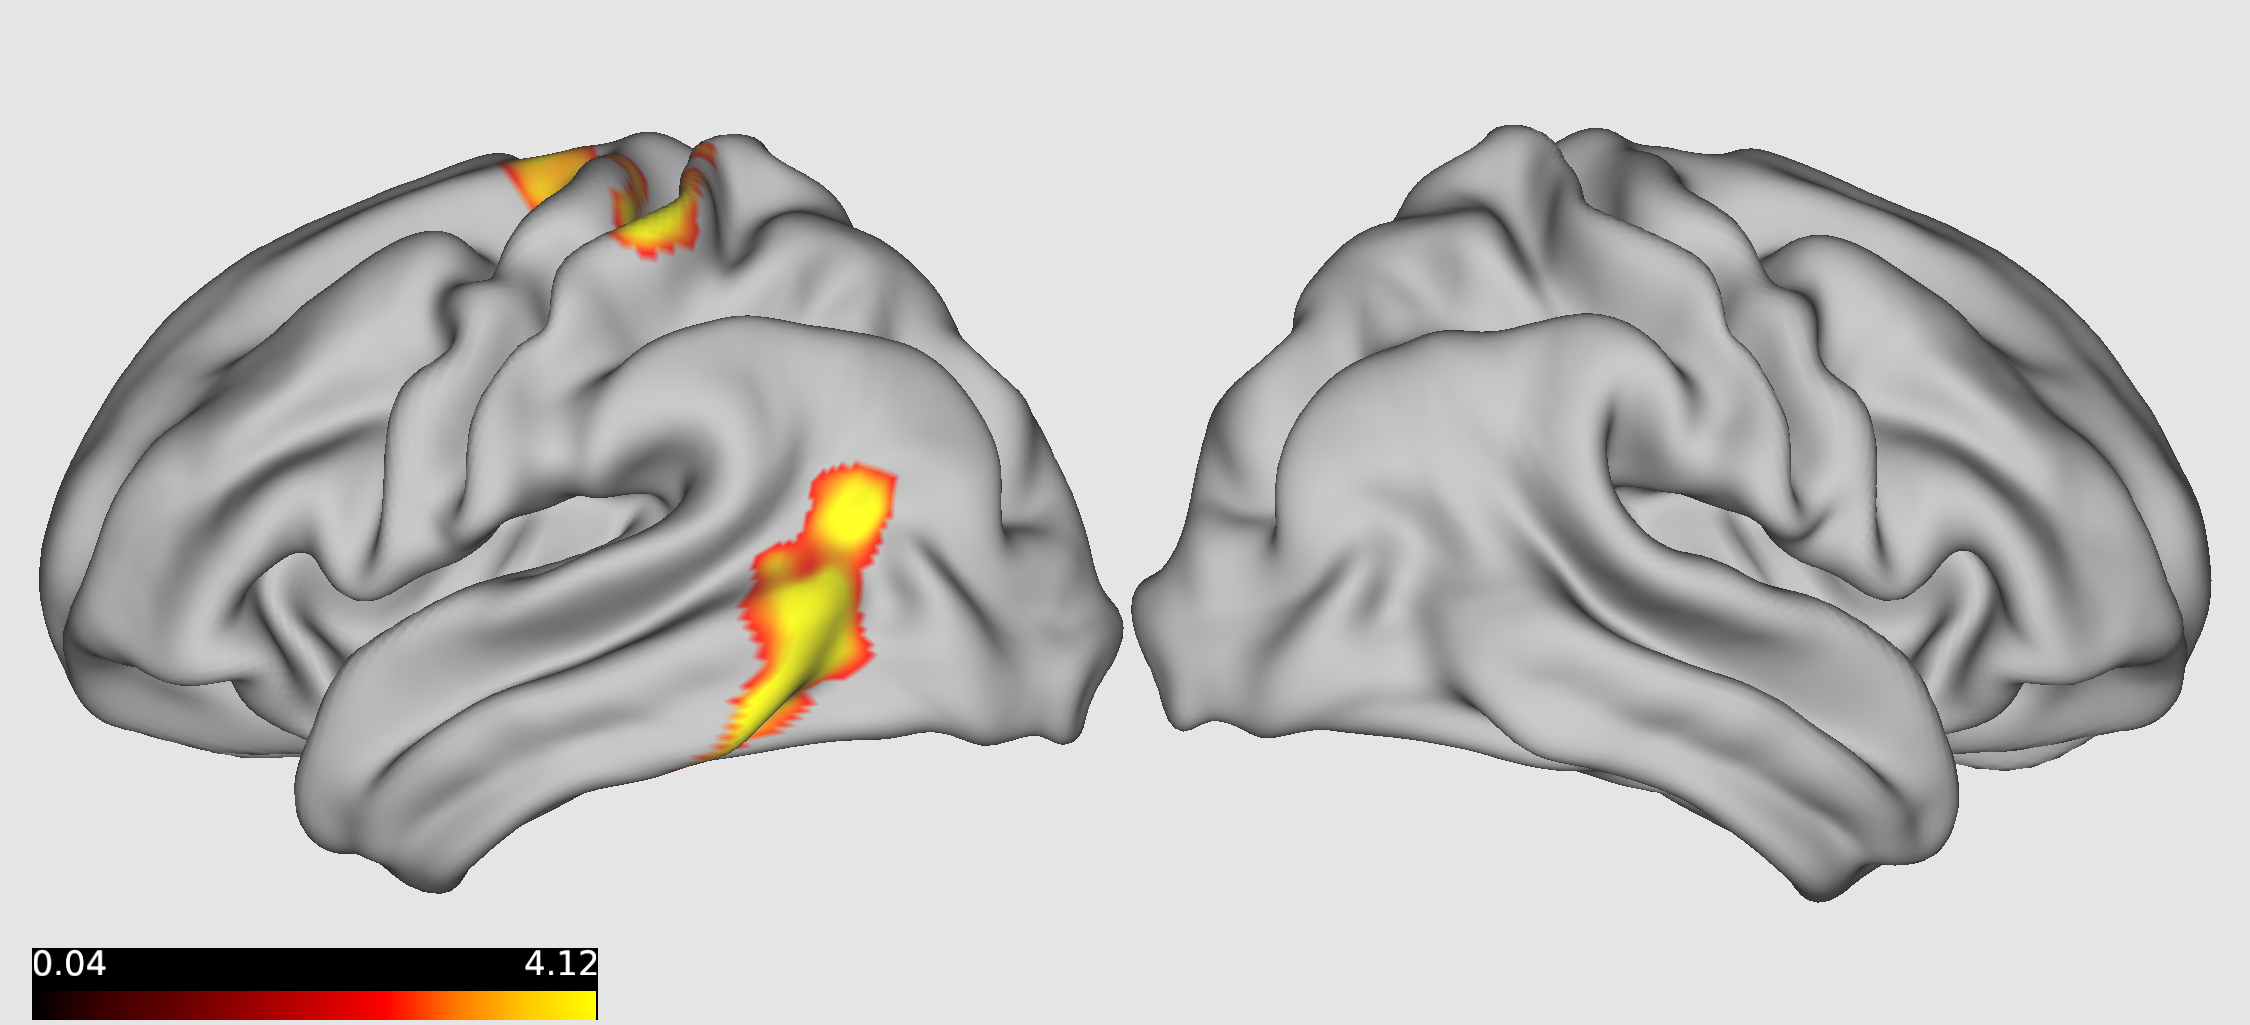
Body Part - Univariate
- Univariate analysis of body-part verses the other 3 concrete categories
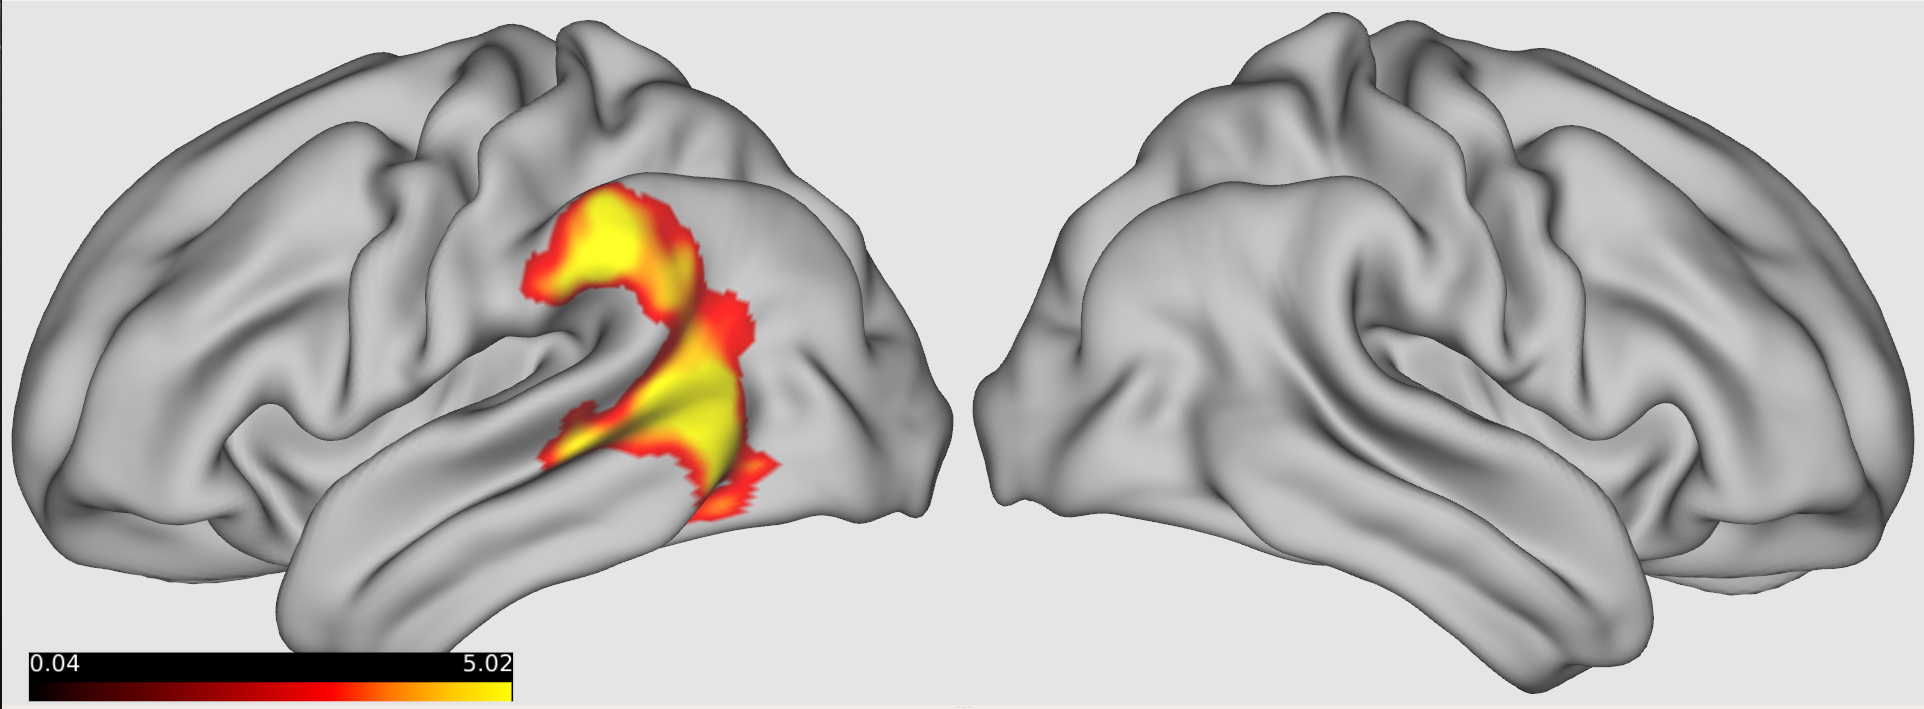
Supramarginal Gyrus
posterior Superior Temporal Sulcus
*Clusterwise corrected at p=.001
Automated
Meta-Analysis
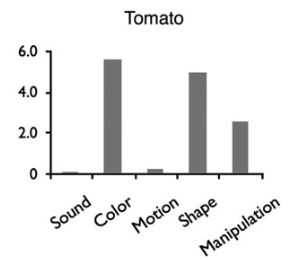
Crea Explanation
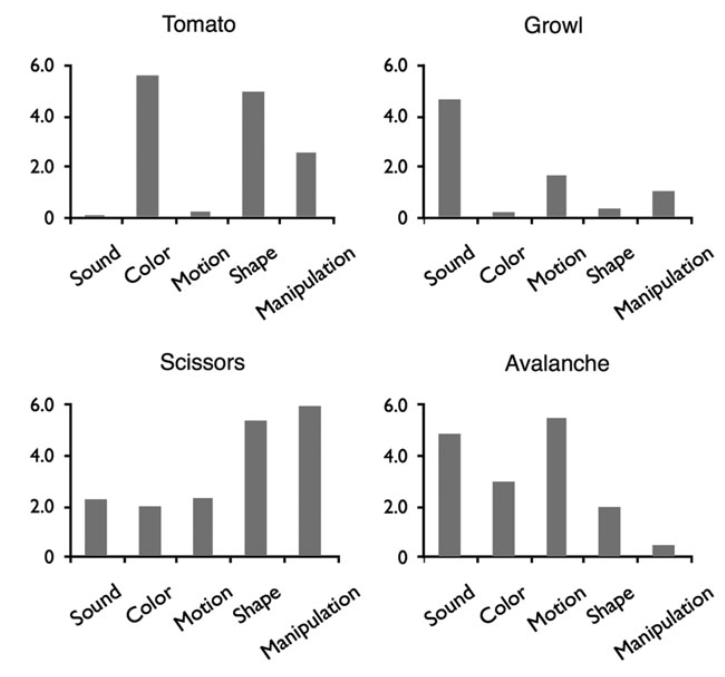
- We can perform RSA with each individual feature from the CREA model to see what type of information is represented in the region

Crea Explanation
- We can perform RSA with each individual feature from the CREA model to see what type of information is represented in the region
Future Directions
- fMRI data is noisy, but it can tell us some things about concepts, and there is some shared variance
- Experiential models account for most of the shared variance
- Experiential models tell us why categories have a degree of localization
Takeaways
- Narrow down what the essential experiential features are
- Comprehensively map what the neurobiologically relevant categories are
- Compare the ability of models to explain univariate category maps
- Determine the features in artificial neural networks that give rise to localized representations
Thank
You!
Thank You
Questions?
MSTP:
Joseph Barbieri, PhD
Calvin Williams, MD, PhD
Nita Salzman, MD, PhD
Gil White, MD
Sid Rao, MD, PhD
Ann Moll
Kim Peplinksi
Language Lab:
Jeffrey Binder, MD
Leonardo Fernandino, PhD
Songhee Kim, PhD
Lisa Conant, PhD
Alex Helfand, PhD
Jia-Qing Tong
RCC
Matt Flister, PhD
Biophysics
MSTP:
Joseph Barbieri, PhD
Calvin Williams, MD, PhD
Nita Salzman, MD, PhD
Gil White, MD
Sid Rao, MD, PhD
Ann Moll
Kim Peplinksi
Language Lab:
Jeffrey Binder, MD
Leonardo Fernandino, PhD
Songhee Kim, PhD
Lisa Conant, PhD
Alex Helfand, PhD
Jia-Qing Tong
RCC
Matt Flister, PhD
Biophysics
Previous Result
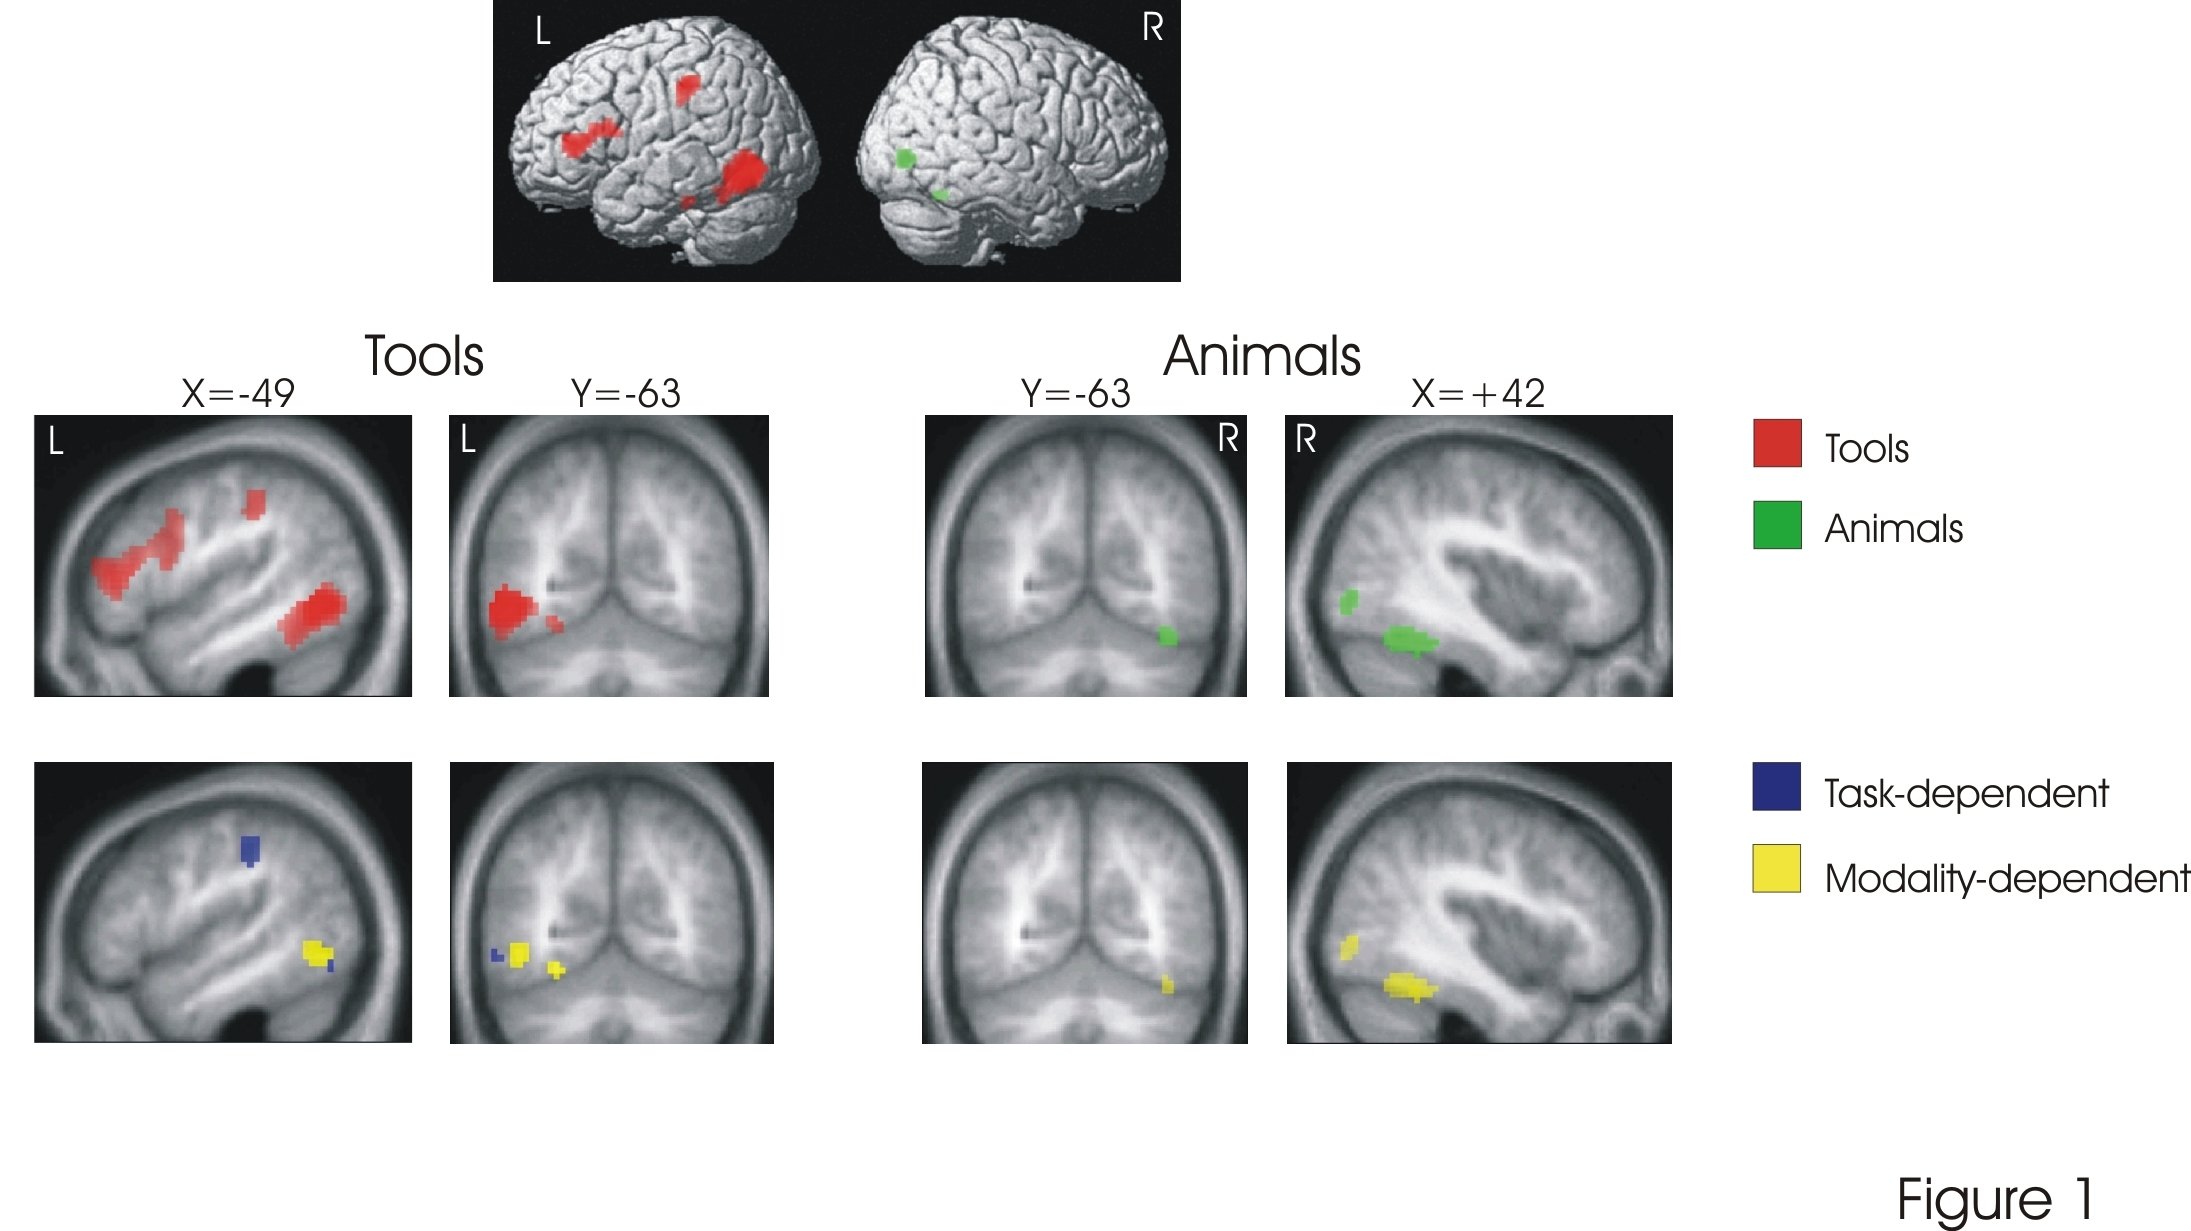
Our Data
Noppeney, U., Price, C. J., Penny, W. D. & Friston, K. J. Two Distinct Neural Mechanisms for Category-selective Responses. Cereb Cortex 16, 437–445 (2006).
Previous Results
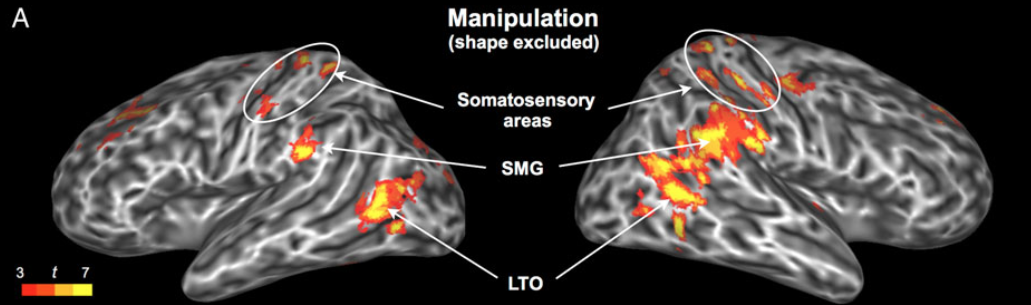
Fernandino, L. et al. Concept Representation Reflects Multimodal Abstraction: A Framework for Embodied Semantics. Cereb Cortex 26, 2018–2034 (2016).
Caspers, S., Zilles, K., Laird, A. R. & Eickhoff, S. B. ALE meta-analysis of action observation and imitation in the human brain. Neuroimage 50, 1148–1167 (2010).