Transformation and querying data
COMP63301 Data Engineering Concepts
Stian Soiland-Reyes


This work is licensed under a
Creative Commons Attribution 4.0 International License.
Intended Learning Outcomes
- Explain the purpose of data transformation
- Design transformed representations depending on data questions
- Reason about transformation execution, data movement and scale
- Compare and choose between alternative representations of data
- Compare batch and streaming data transformations

You have already...
- Built an understanding of the data (profiling, exploring)
- Considered representation and storage (e.g. tables, JSON)
- Data improvements (data quality, cleaning)
- Data harmonisation (schemas, semantics)
- Integrated data (multiple sources)
- Built a transformation pipeline (integrate, aggregate, derive)
- Prepared feature data for downstream use
Did we build the right transformation pipeline?
Can it work at scale?
Engineering a data transformation
We need to reason and decide on:
- representation/schema
- grain/granularity
- where we do the computation
- where/how we move data
- making our pipeline scalable
- making our pipeline reusable
- dynamics: time windows, streaming
Transformation vocabulary
Grain: granularity, primary key, what is a row?
Representation: schema, structure, format, table
Transformations: Harmonisation, reconciliation, integration
Change of grain: Aggregation, summarisation, feature encoding
Transformation considerations
What is the source representation? What does one row represent?
What is the purpose of the transformation? What questions will we ask?
What is the target representation? What should one row now represent?
Engagement
Enrollment
Students
Courses
?
Students
| Students | |||
|---|---|---|---|
| student_id | degree | entry_year | region |
| 1028802 | CS | 2024 | North |
| 1278181 | CS+Math | 2025 | South |
| (20,000 rows) |
| Courses | ||
|---|---|---|
| course_id | school | credits |
| COMP62301 | CS | 15 |
| COMP62452 | CS | 10 |
| (300 rows) |
| Enrollment | ||
|---|---|---|
| student_id | course_id | mark |
| 1028802 | COMP62301 | 78 |
| 1028802 | COMP62452 | 66 |
| 1278181 | COMP62301 | 81 |
| (150,000 rows) |
| Engagement | ||||||
|---|---|---|---|---|---|---|
| event_id | student_id | course_id | event_time | duration | resource_type | completed |
| 13121 | 1278181 | COMP62301 | 2025-12-06 | 50 | video | true |
| 13122 | 1028802 | COMP62452 | 2026-02-14 | 45 | video | false |
| 13123 | 1028802 | COMP62452 | 2026-02-20 | 9 | quiz | true |
| (3,000,000 rows) |
Understanding the source schema
Relational schema notation
Students (student_id, degree, entry_year, region)
Courses (course_id, school, credits)
Enrollment (student_id, course_id, mark)
Engagement (event_id, student_id, course_id, event_time, duration,
resource_type, completed)
| Students | |||
|---|---|---|---|
| student_id | degree | entry_year | region |
| Courses | ||
|---|---|---|
| course_id | school | credits |
| Enrollment | ||
|---|---|---|
| student_id | course_id | mark |
| Engagement | ||||||
|---|---|---|---|---|---|---|
| event_id | student_id | course_id | event_time | duration | resource_type | completed |
grain: per event per student per course
grain: per student per course
grain: per student
grain: per course
grain: one row represents what?
Transformations can change granularity
| Students | |||
|---|---|---|---|
| student_id | degree | entry_year | region |
| Courses | ||
|---|---|---|
| course_id | school | credits |
| Engagement | ||||||
|---|---|---|---|---|---|---|
| event_id | student_id | course_id | event_time | duration | resource_type | completed |
(Transaction) Fact table: Append-only list of events
Dimension tables: Mostly static, attributes
Ralph Kimball, Margy Ross (2013):
The Data Warehouse Toolkit: The Definitive Guide to Dimensional Modeling, Third Edition
ISBN 978-1118530801
Engagement
Enrollment
Students
Courses
Kimball star schema:
The fact table is augmented by attributes in each of the dimensions.
facts
dimension or fact?
dimension
dimension
Resources
dimension
Date
dimension
Transformation to.. what?
Consider what questions we want answered
How engaged was a student in a course?
How much time was spent on a course?
How many activities did each student complete?
Do engaged students achieve higher marks?
Data transformation create new data products to make questions (more easily) answerable

First: Decide on the grain of the desired table
Second: Which attributes do we wish were there?
Validate: What can we assert after the transformation?
Aggregations:
EventSummary (student_id, course_id, event_count, total_duration, completion_rate, video_duration, reading_duration, last_activity)
Features:
StudentCourseFeatures (student_id, course_id, mark,
engagement_level, degree, entry_year, region, school, event_count,
total_duration, completion_rate, video_duration, reading_duration, last_activity)
Deciding on target schema
How do we capture our transformations?
Reusable
Each view designed to answer a set of possible questions
CREATE VIEW EventSummaryView AS
SELECT
    student_id,
    course_id,
    ...
CREATE TABLE EventSummaryMaterialised AS
SELECT
student_id,
course_id,
...A materialised view captures the result of a transformation query
A view captures a reusable transformation as a named query
Changes in source reflected immediately.
No modifications at target.
Transformation result is stored and must be regularly refreshed
Designing features
Categorical values inform schema design
| Engagement | ||||||
|---|---|---|---|---|---|---|
| event_id | student_id | course_id | event_time | duration | resource_type | completed |
| 13121 | 1278181 | COMP62301 | 2025-12-06 | 50 | video | true |
| 13122 | 1028802 | COMP62452 | 2026-02-14 | 45 | video | false |
| 13123 | 1028802 | COMP62452 | 2026-02-20 | 9 | quiz | true |
| (3,000,000 rows) |
| EngagementFeatures | ||||||
|---|---|---|---|---|---|---|
| student_id | course_id | video_count | video_duration | video_completion | quiz_count | quiz_completion |
| 1 | 244 | 12 | 259 | 0.81 | 8 | 1.0 |
| 2 | 104 | 5 | 260 | 0.74 | 4 | 0.75 |
Columns per resource_type
What happens if a new resource_type appears?
Values in one representation become columns in another
Split feature tables
| Engagement | ||||||
|---|---|---|---|---|---|---|
| event_id | student_id | course_id | event_time | duration | resource_type | completed |
| 13121 | 1278181 | COMP62301 | 2025-12-06 | 50 | video | true |
| 13122 | 1028802 | COMP62452 | 2026-02-14 | 45 | video | false |
| 13123 | 1028802 | COMP62452 | 2026-02-20 | 9 | quiz | true |
| (3,000,000 rows) |
| VideoFeatures | ||||
|---|---|---|---|---|
| student_id | course_id | video_count | video_duration | video_completion |
| 1278181 | COMP62452 | 12 | 259 | 0.81 |
| 1028802 | COMP62301 | 5 | 260 | 0.74 |
| (~ 120,000 rows) |
| QuizFeatures | |||
|---|---|---|---|
| student_id | course_id | quiz_count | quiz_completion |
| 1278181 | COMP62452 | 8 | 1.0 |
| 1028802 | COMP62301 | 4 | 0.75 |
Feature tables per resource_type
There may be multiple valid feature tables!
Features over time
| Engagement | ||||||
|---|---|---|---|---|---|---|
| event_id | student_id | course_id | event_time | duration | resource_type | completed |
| 41423 | 1 | 244 | 2025-12-04 | 50 | video | false |
| 41424 | 1 | 244 | 2026-02-18 | 45 | video | true |
| (3,000,000 rows) |
| VideoFeatures | |||||
|---|---|---|---|---|---|
| student_id | course_id | video_count | video_duration | video_completion | until |
| 1 | 244 | 9 | 120 | 0.89 | 2025-12-01 |
| 1 | 244 | 10 | 170 | 0.80 | 2026-01-01 |
| 1 | 244 | 10 | 170 | 0.80 | 2026-02-01 |
| 1 | 244 | 11 | 215 | 0.82 | 2026-03-01 |
| (~ 300,000 rows) |
Feature tables per resource_type per time window (start--until)
Trends can be detected by aggregating per time window
| Time | |||
|---|---|---|---|
| month | academic_year | from | to |
| 2025-12 | 2025/2026 | 2025-12-01 | 2025-12-31 |
| 2026-01 | 2025/2026 | 2026-01-01 | 2026-01-31 |
Windowing over data
| Sales | ||
|---|---|---|
| sales_rep | amount | date |
| 141 | £120 | 2025-12-14 |
| 52 | £90 | 2025-12-23 |
| 141 | £2000 | 2025-12-23 |
| 141 | £244 | 2026-01-01 |
| 52 | £1900 | 2026-01-31 |
| 141 | £3000 | 2026-03-02 |
2025-12
2026-01
Tumbling window (e.g. average per month)
2025-12-02 / 2025-12-31
Hopping window (e.g. rolling average of 30 days, per week)
2025-12-09 / 2026-01-07
2025-12-16 / 2026-01-14
2025-12-23 / 2026-01-21
| SalesPerMonth | |||
|---|---|---|---|
| sales_rep | amount_avg | amount_tot | month |
| 141 | £1060 | £2120 | 2025-12 |
| 52 | £90 | £90 | 2025-12 |
| 141 | £244 | £244 | 2026-01 |
| 52 | £1900 | £1900 | 2026-01 |
| SalesRolling30d | ||||
|---|---|---|---|---|
| sales_rep | amount_avg | amount_tot | starting | ending |
| 141 | £1060 | £2120 | 2025-12-02 | 2025-12-31 |
| 141 | £788 | £2364 | 2025-12-09 | 2026-01-07 |
| 141 | £1122 | £2244 | 2025-12-16 | 2026-01-14 |
| 141 | £1122 | £2244 | 2025-12-23 | 2026-01-21 |
Partitioning aggregations: Can an event belong to multiple time periods?
Transforming semi-structured data
Identifying multi-dimensional data
| Courses | |||
|---|---|---|---|
| course_id | school | credits | keywords |
| COMP63301 | CS | 15 | database, data engineering |
| COMP62452 | CS & Business | 10 | data engineering,machine learning,statistics |
data engineering
database
machine learning
statistics
CS
Business
Semi-structured list of values hiding inside a string value — what is the format?
Decomposing semi-structured values
| Courses | |||
|---|---|---|---|
| course_id | school | credits | keywords |
| COMP63301 | CS | 15 | database, data engineering |
| COMP62452 | CS & Business | 10 | data engineering,machine learning, statistics |
data engineering
database
machine learning
statistics
| CourseKeywords | |
|---|---|
| course_id | keyword |
| COMP63301 | database |
| COMP63301 | data engineering |
| COMP62452 | data engineering |
| COMP62452 | machine learning |
| COMP62452 | statistics |
| Keywords | |
|---|---|
| keyword | alias |
| database | db |
| data engineering | |
| machine learning | ML |
| statistics | stats |
Clean
Validate
Split values
Clean
Match
Document concept scheme
| CourseSchools | |
|---|---|
| course_id | school |
| COMP63301 | CS |
| COMP62452 | CS |
| COMP62452 | Business |
| Schools | |
|---|---|
| school_id | full_name |
| CS | Department of Computer Science |
| Business | Alliance Manchester Business School |
"Just enough" database normalisation
Data Vault modelling & SCD
CourseSchools
Courses
Hub
Link
Schools
Hub
SchoolDesc
Satellite
| SchoolDesc | ||
|---|---|---|
| school_id | full_name | valid_from |
| CS | Department of Computer Science | 2019-09-21 |
| Business | Alliance Manchester Business School | 2015-09-21 |
| CS | School of Computer Science | 2014-09-21 |
| Business | Manchester Business School | 2014-09-21 |
Daniel Linstedt, Michael Olschimke (2015):
Building a Scalable Data Warehouse with Data Vault 2.0.
Hub: things we identify
Link: relationships between things
Satellite: descriptions of things
Slowly Changing Dimension (SCD)
Semi-structured data formats
{ "orders": [
	{ "price": 18.2,
      "product": "Shoelaces"
    }
  ]
}
<orders>
	<product name="Shoelaces">
      <price currency="GBP">18.20</price>
  	</product>
</orders>
orders:
 - price: 18.20
    product: Shoelaces
<order1> a :Order;
:price 18.20;
:product [
:name "Shoelaces"
] .
XML
Turtle
YAML
JSON
<ORDERS>
<PRODUCT NAME="Shoelaces">
<PRICE CURRENCY="GBP">18.20
</ORDERS>
SGML
Changing representation will often need to change grain
SQL/JSON
| EngagementFeatures | ||||||
|---|---|---|---|---|---|---|
| student_id | course_id | video_count | video_duration | video_completion | quiz_count | quiz_completion |
| 1 | 244 | 12 | 259 | 0.81 | 8 | 1.0 |
| 1 | 104 | 5 | 260 | 0.74 | 4 | 0.75 |
"courses": {
  "244": {
    "video": {
      "duration": 259
    },
    "reading": {
      "duration": 480
    },
    "engagement": {
      "event_count": 15,
      "completion_rate": 0.67
    }
  }
  "104": {
  	"video": ...
  }
}
API grain: per student
http://example.com/engagement/student/1
View grain: per student, per course
| student_id | course_id | mark | features (JSONB) |
|---|---|---|---|
| 1 | 10 | 83.7 |
{
  "video": {
    "duration": 103
  },
  "reading": {
    "duration": 480
  },
  "engagement": {
    "event_count": 15,
    "completion_rate": 0.67
  }
}
|
| 1 | 101 | 79.2 |
{
  "video": {
    "duration": 168
  },
  "reading": {
    "duration": 200
  },
  "engagement": {
    "event_count": 19,
    "completion_rate": 0.84
  }
}
|
| 1 | 168 | 67.2 |
{
  "video": {
    "duration": 298
  },
  "reading": {
    "duration": 199
  },
  "engagement": {
    "event_count": 18,
    "completion_rate": 0.89
  }
}
|
Example:
Querying semi-structured JSON in relational databases
| student_id | course_id |
|---|---|
| 1 | 168 |
Where do we do our transformation?
Principle: Push down work to where data lives (or will live)
Life of a query
SQL query
issued
Parsing and conversion
Query planning and optimization
Query execution
Results returned
Adapted from Figure 8.2 in Fundamentals of Data Engineering
🧑🏾💻
📃
🧐
👷🏽♀️
🧑🏿🍳
SELECT first,last
FROM t1
JOIN t2
ON ...
op: SELECT
cols: first,last
tables: t1, t2
joins:
- t1.id = t2.idscan t1
join t2
index t1.id
sorting
intermediate
resultsscan
join
index
sort
intermediate
results| first | last |
|---|---|
| Alice | Brown |
| Bob | Dalton |
Logical plan
Physical plan
Internal representation
first,last
alice,brown
bob,dalton
Temporary table
Results
The same logical transformation may have several possible queries, which again have several possible physical plans.
SQL is a declarative language
SQL instructions say what you want (logical result), not how
Relational databases are able to optimize the query to decide a physical execution plan e.g. which order to join tables or which rows to examine first
Queries are (largely) independent of implementation details (e.g. file vs memory vs distributed)
Restructuring the relational table design can help/complicate query writing and/or query execution
Query optimization
How can we improve query performance?
- Reduce data movement: push work (filter/transform/aggregate) close to the data
- Prejoin data: Denormalisation or materialised views
- Reduce complexity of query
- Multiple simpler queries may be faster (but use more data transfer)
- Try to avoid full-table scan, e.g.
SELECTwithoutWHERE
- Add indexes on frequently queried columns
- Use
EXPLAINto reveal the query plan
What can affect performance
- Using an LLM-generated query without checking it
- Sorting when a view is not for display
- Querying over larger periods than needed
- Unnecessary joins of tables that are then not used
- Unused aggregations
- Moving more data than needed (e.g. multiple times or wrong direction)
- Doing the work in the wrong place
How can we improve query performance? #2
- Consider impact of transactions and concurrency
- Vacuum dead records
- Ensure query results can be cached
- Avoid many almost-same queries
- Use prepared statements with parameters, don't embed values
pd.read_sql_query("""
SELECT Title, Authors, ISSNs, Year
FROM Articles
WHERE ISSNs=? AND Month=? AND YEAR=? ;
""", db,
params=['2056-9890', 2, 2015]).head()
Querying data streams
Streaming architectures
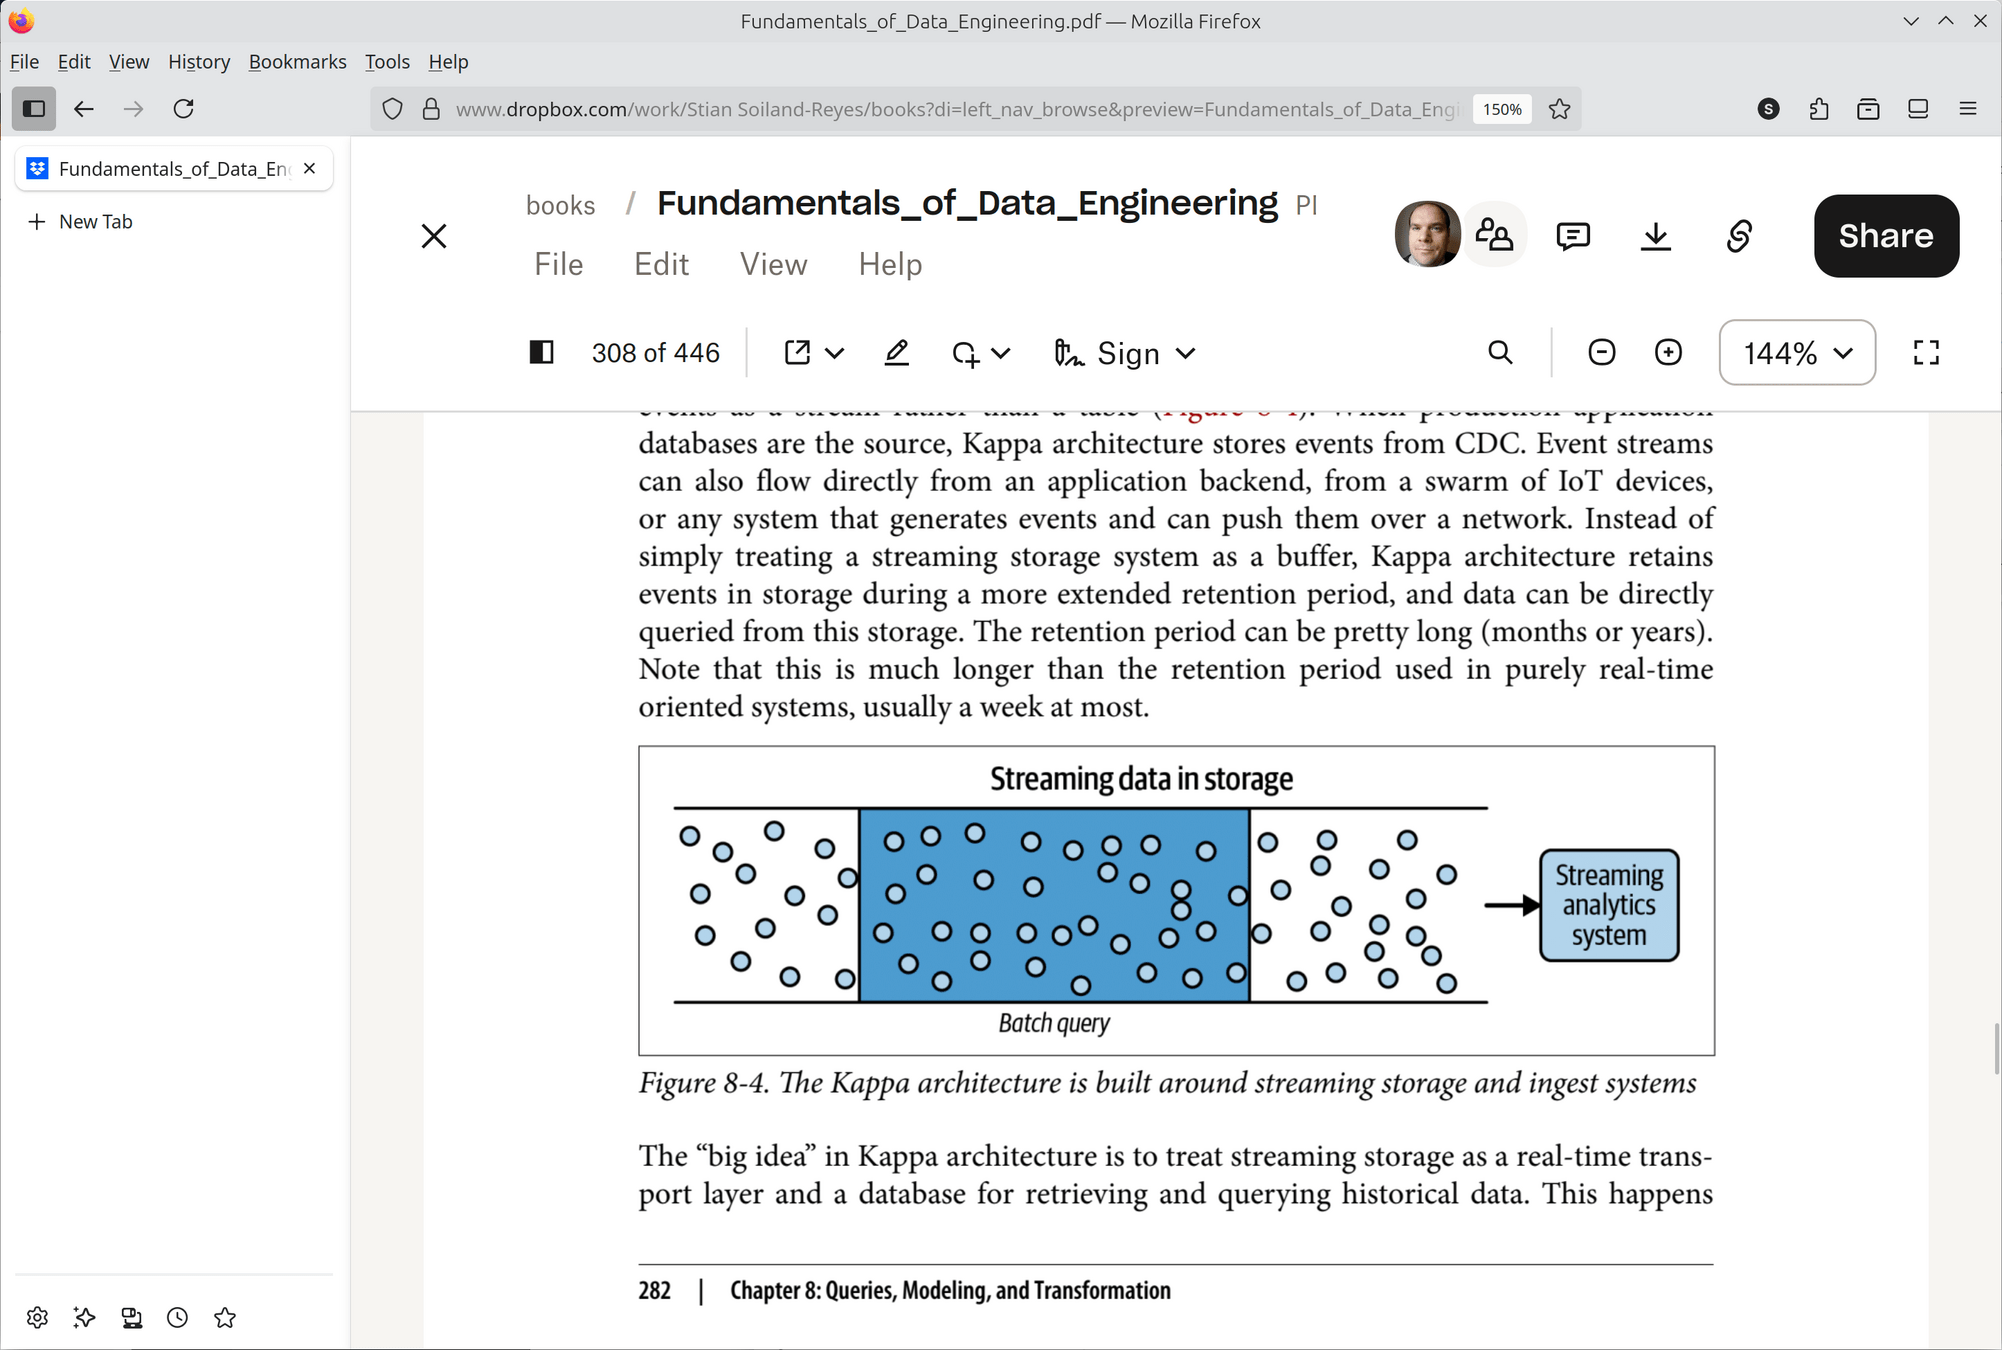
- Kappa architecture treat all data as continuous streams without a separate batch layer
Figure 3.4, 3.5 from Fundamentals of Data Engineering
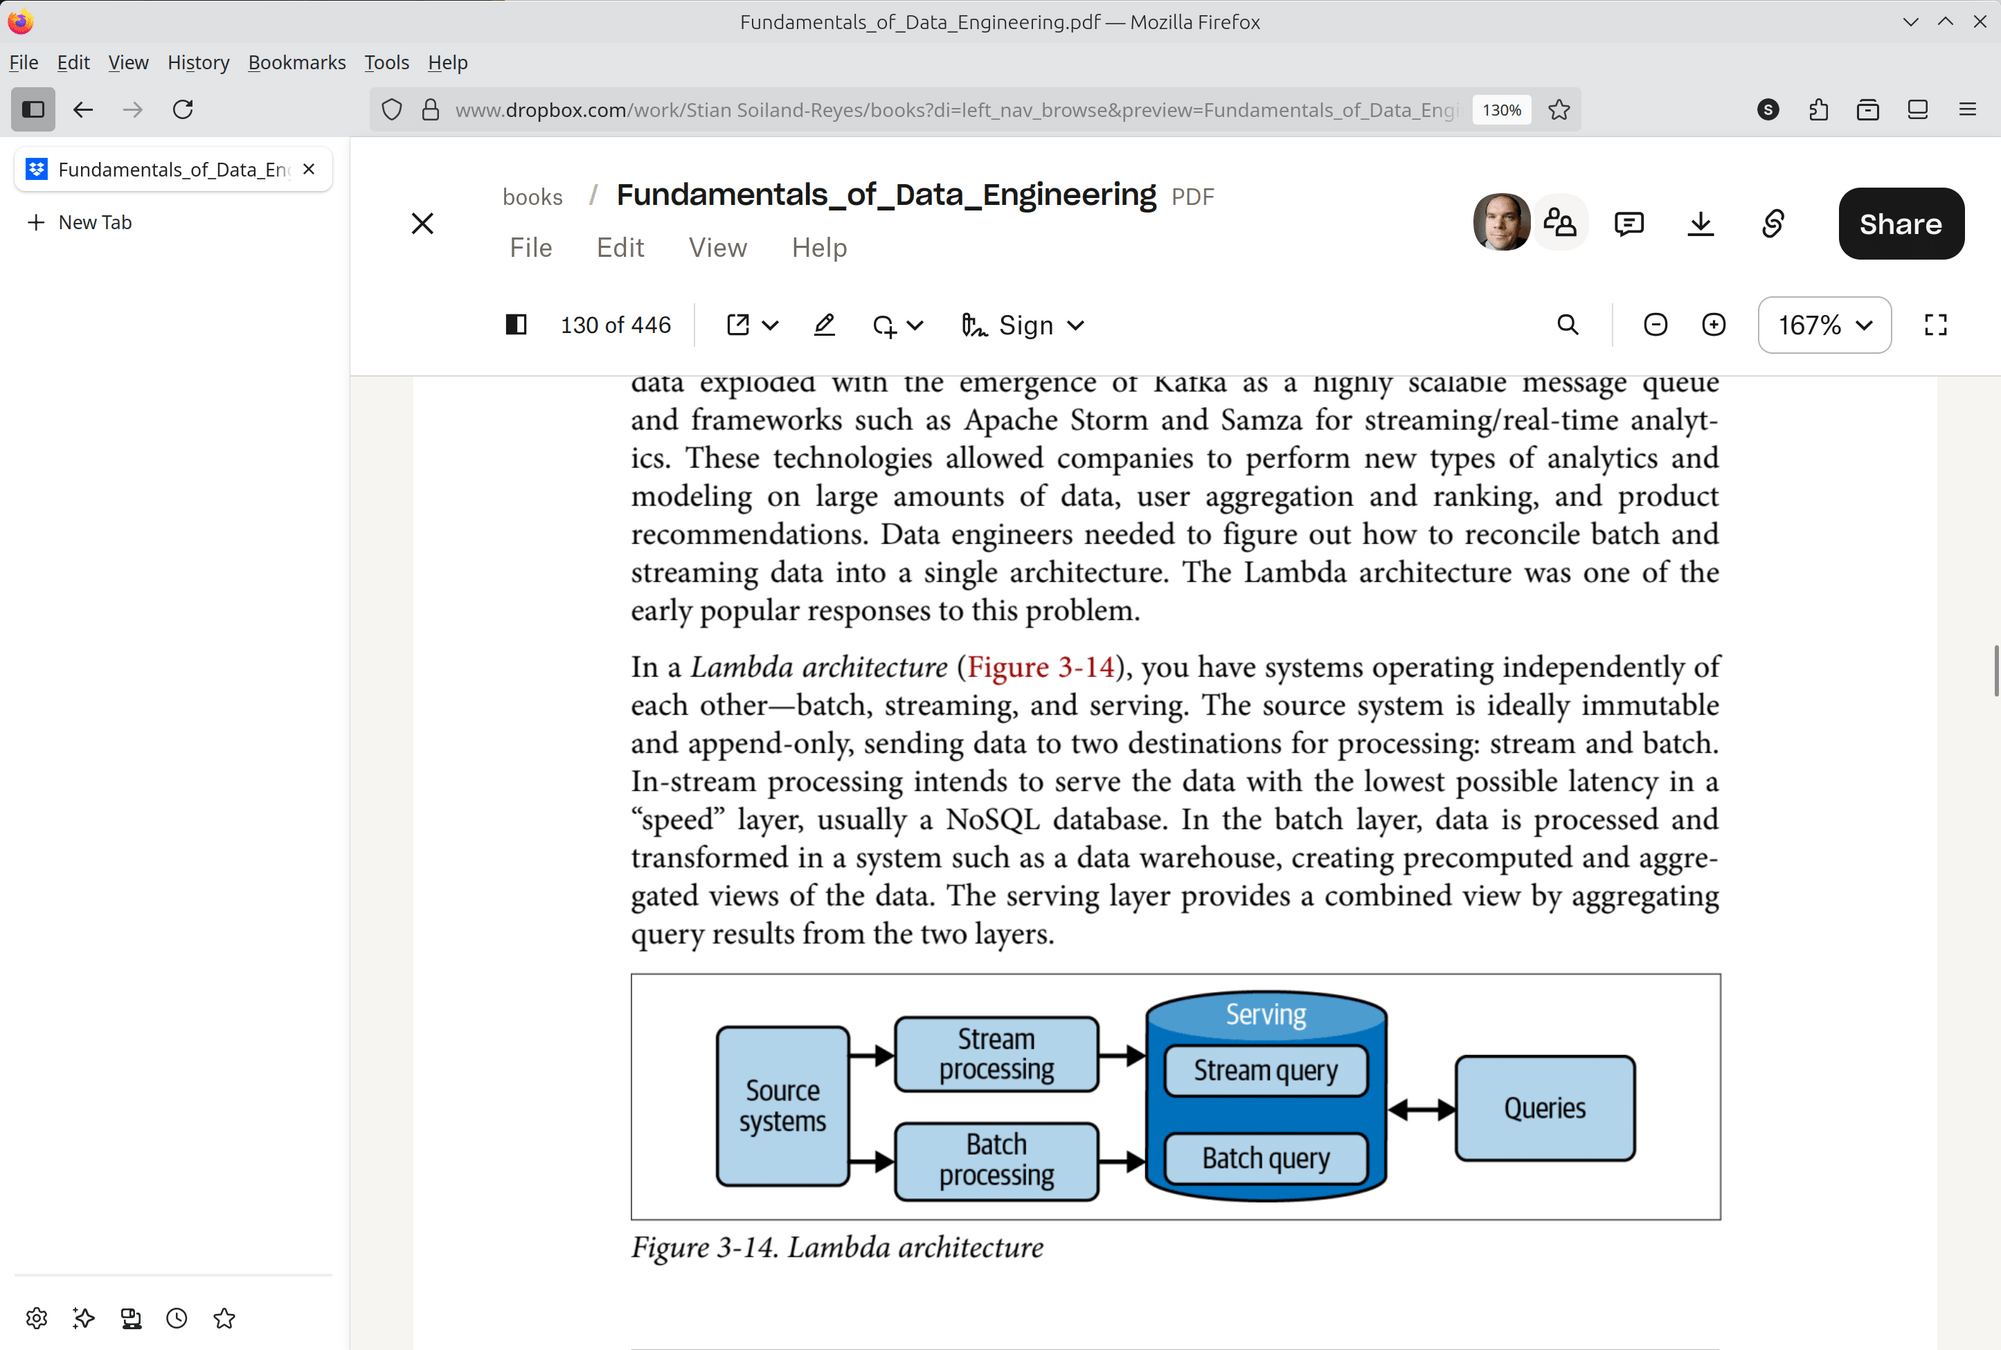
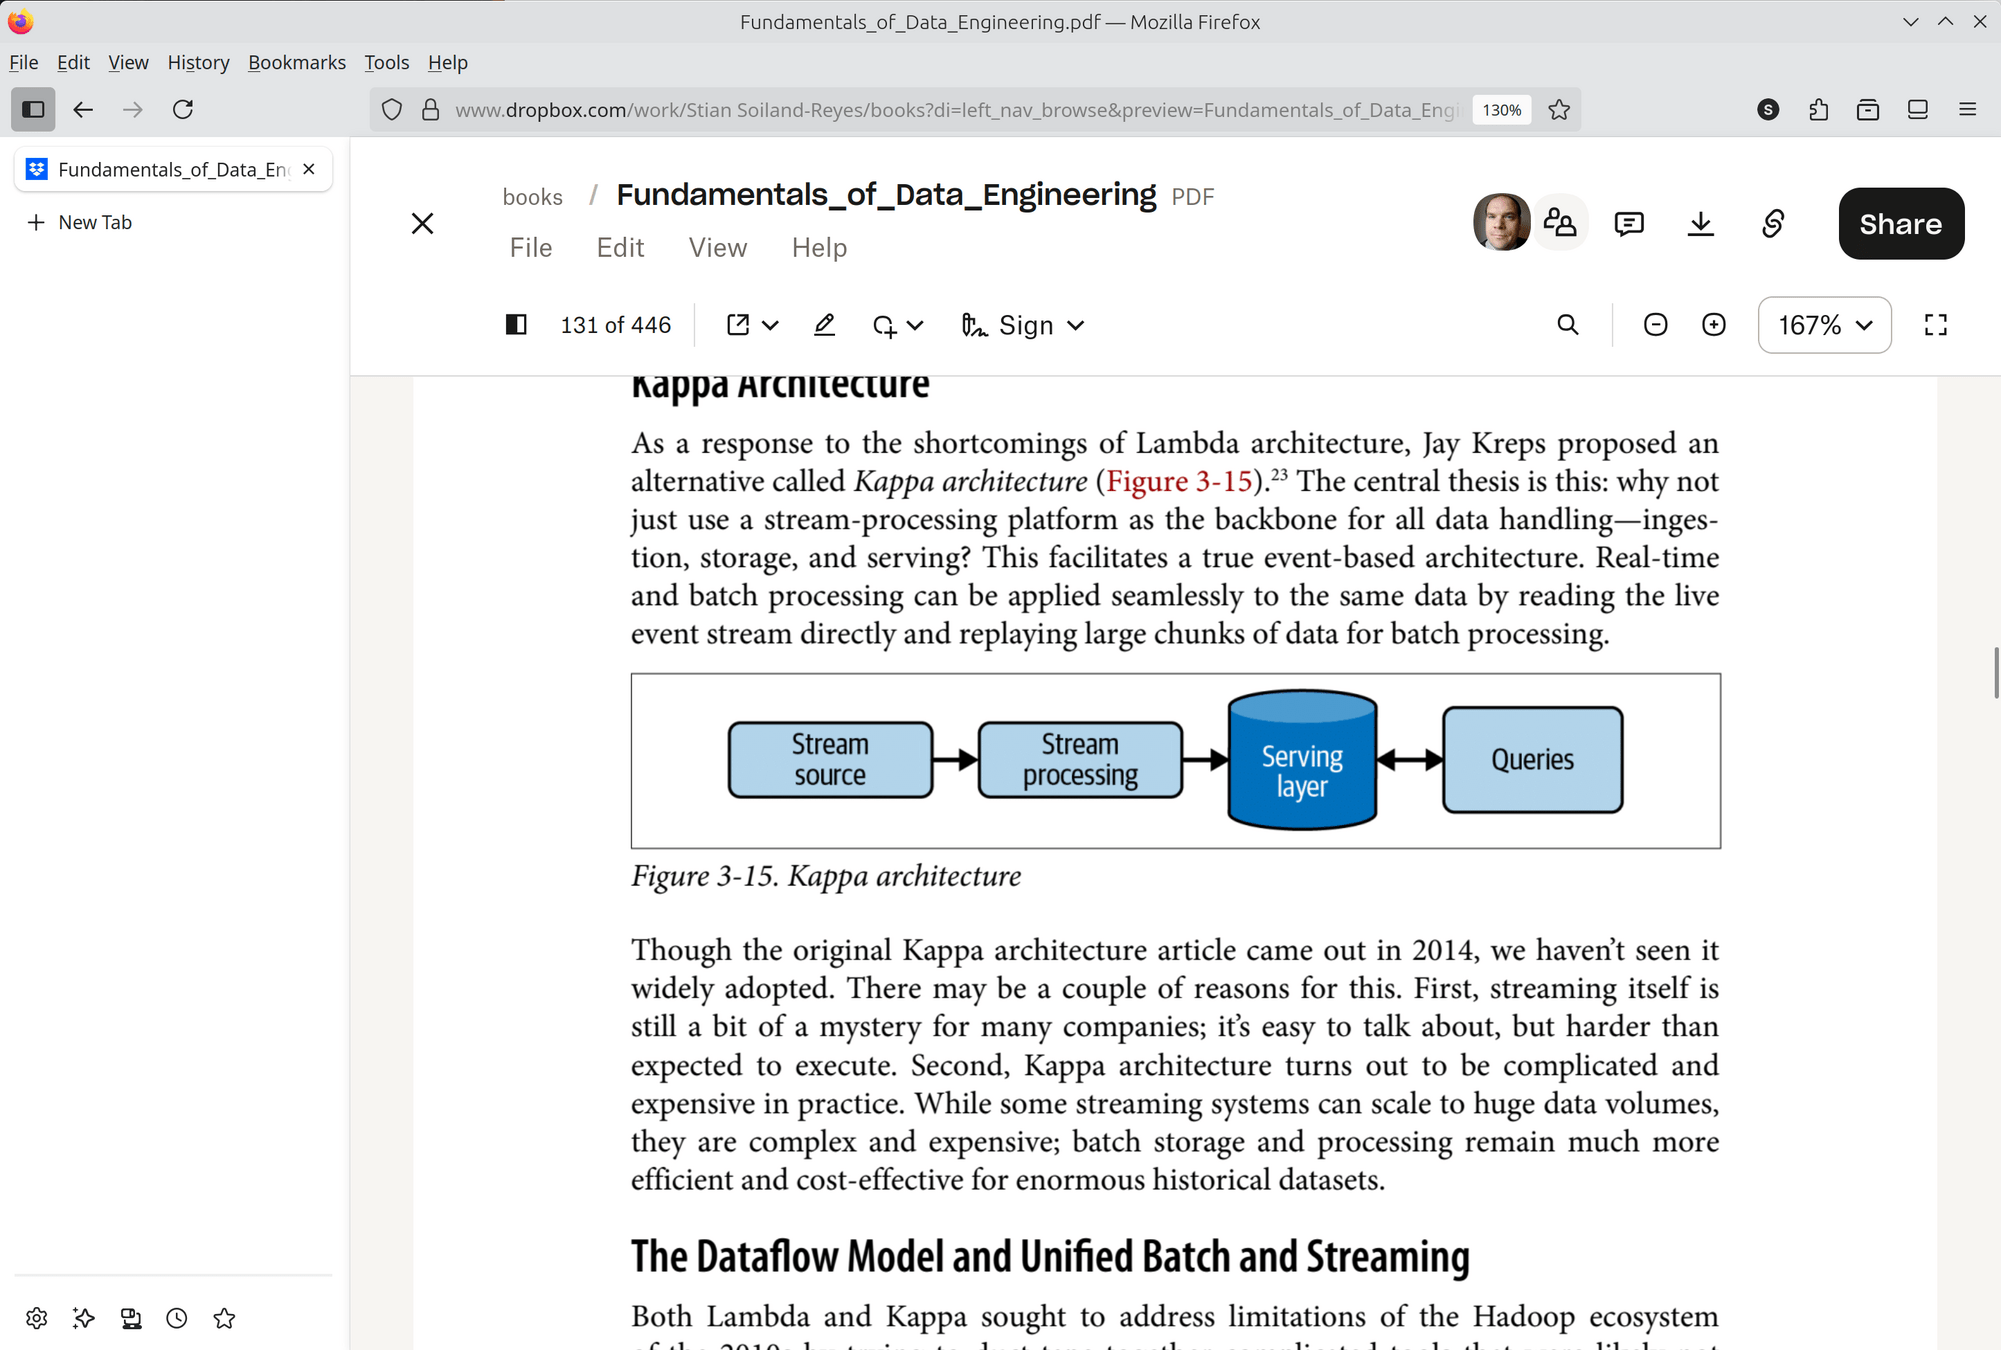
- Lambda architecture has separate stream and batch processing, serving separate query methods
Querying in Lambda architecture
Stream query
Batch query
Data processed in real-time
high speed, but incomplete data
Immediate response to events
"Top up" batch views with newest data
Examples: Spark structured Streaming, Flink, Storm
Operates on complete data (in batches)
high latency, with complete data
Historical accuracy
Each batch update pre-computes full views
Examples: Hadoop, Spark, Snowflake, BigQuery
Named after λ calculus, a functional mathematical system
Events carried by a log/queue, e.g. Kafka/Kinesis
Event time: When did it happen
Processing time: When we process event
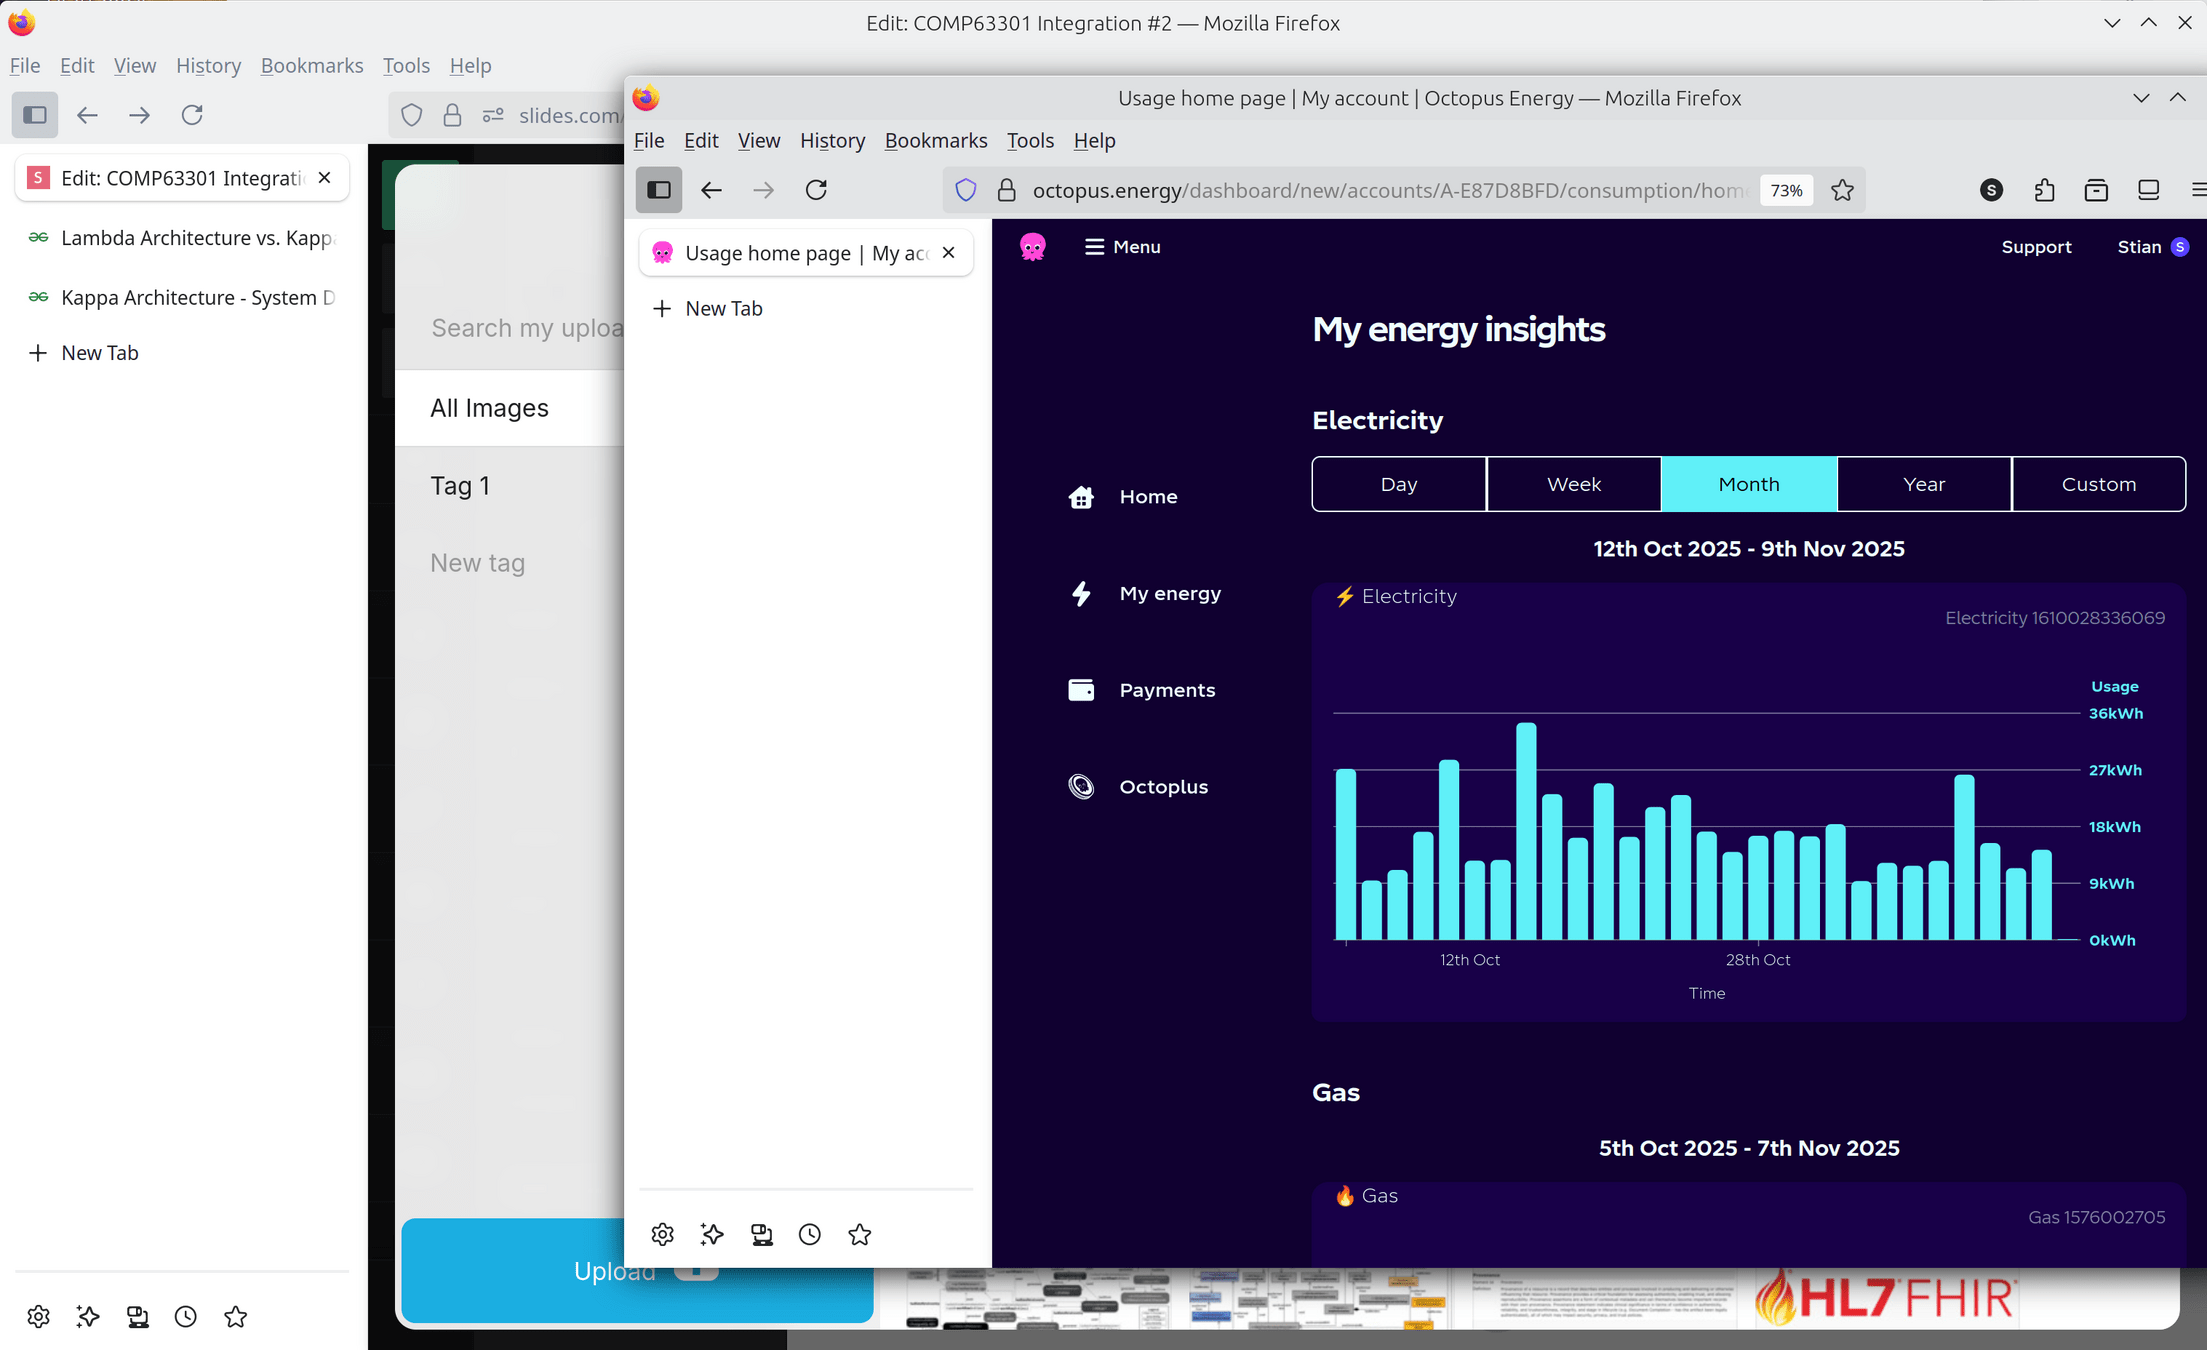
Smart Energy example
Batch query
Calculate cost for invoicing by 30 minute readings
Predict which periods are busiest
Latency: 60 minutes (or month!)
Accuracy: Gaps aligned by next readings
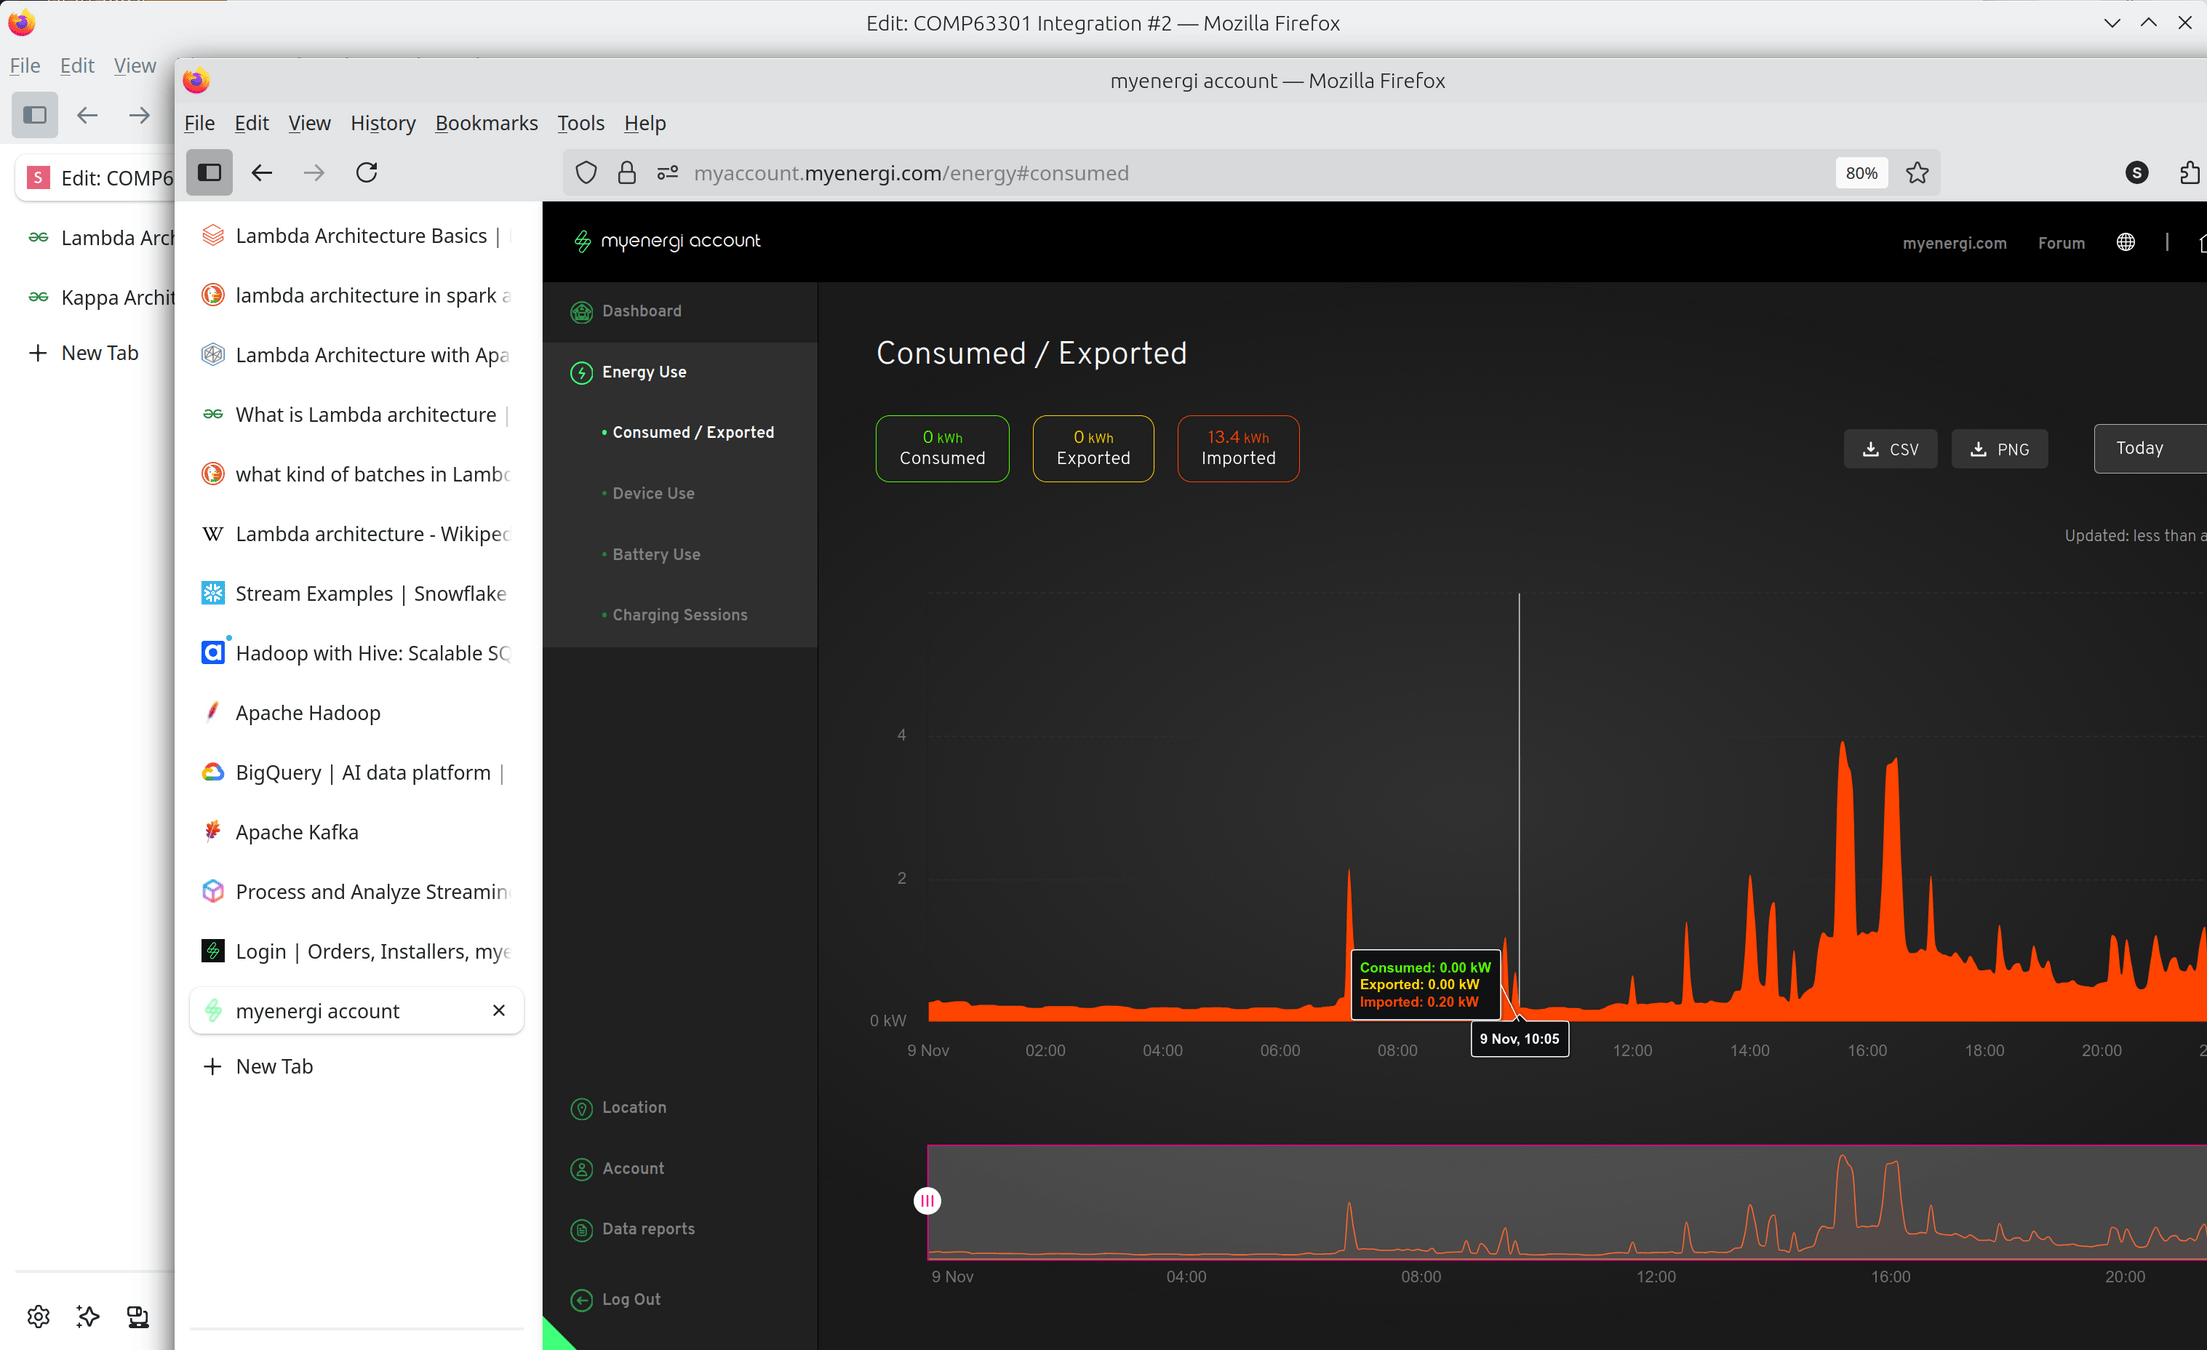
Stream query
Immediate feedback, what is using power?
Power generators can react quickly to sudden spikes (e.g. electric car charging)
Latency: 1 minute
Accuracy: Gaps ignored e.g. WiFi is down
Querying in Kappa architecture
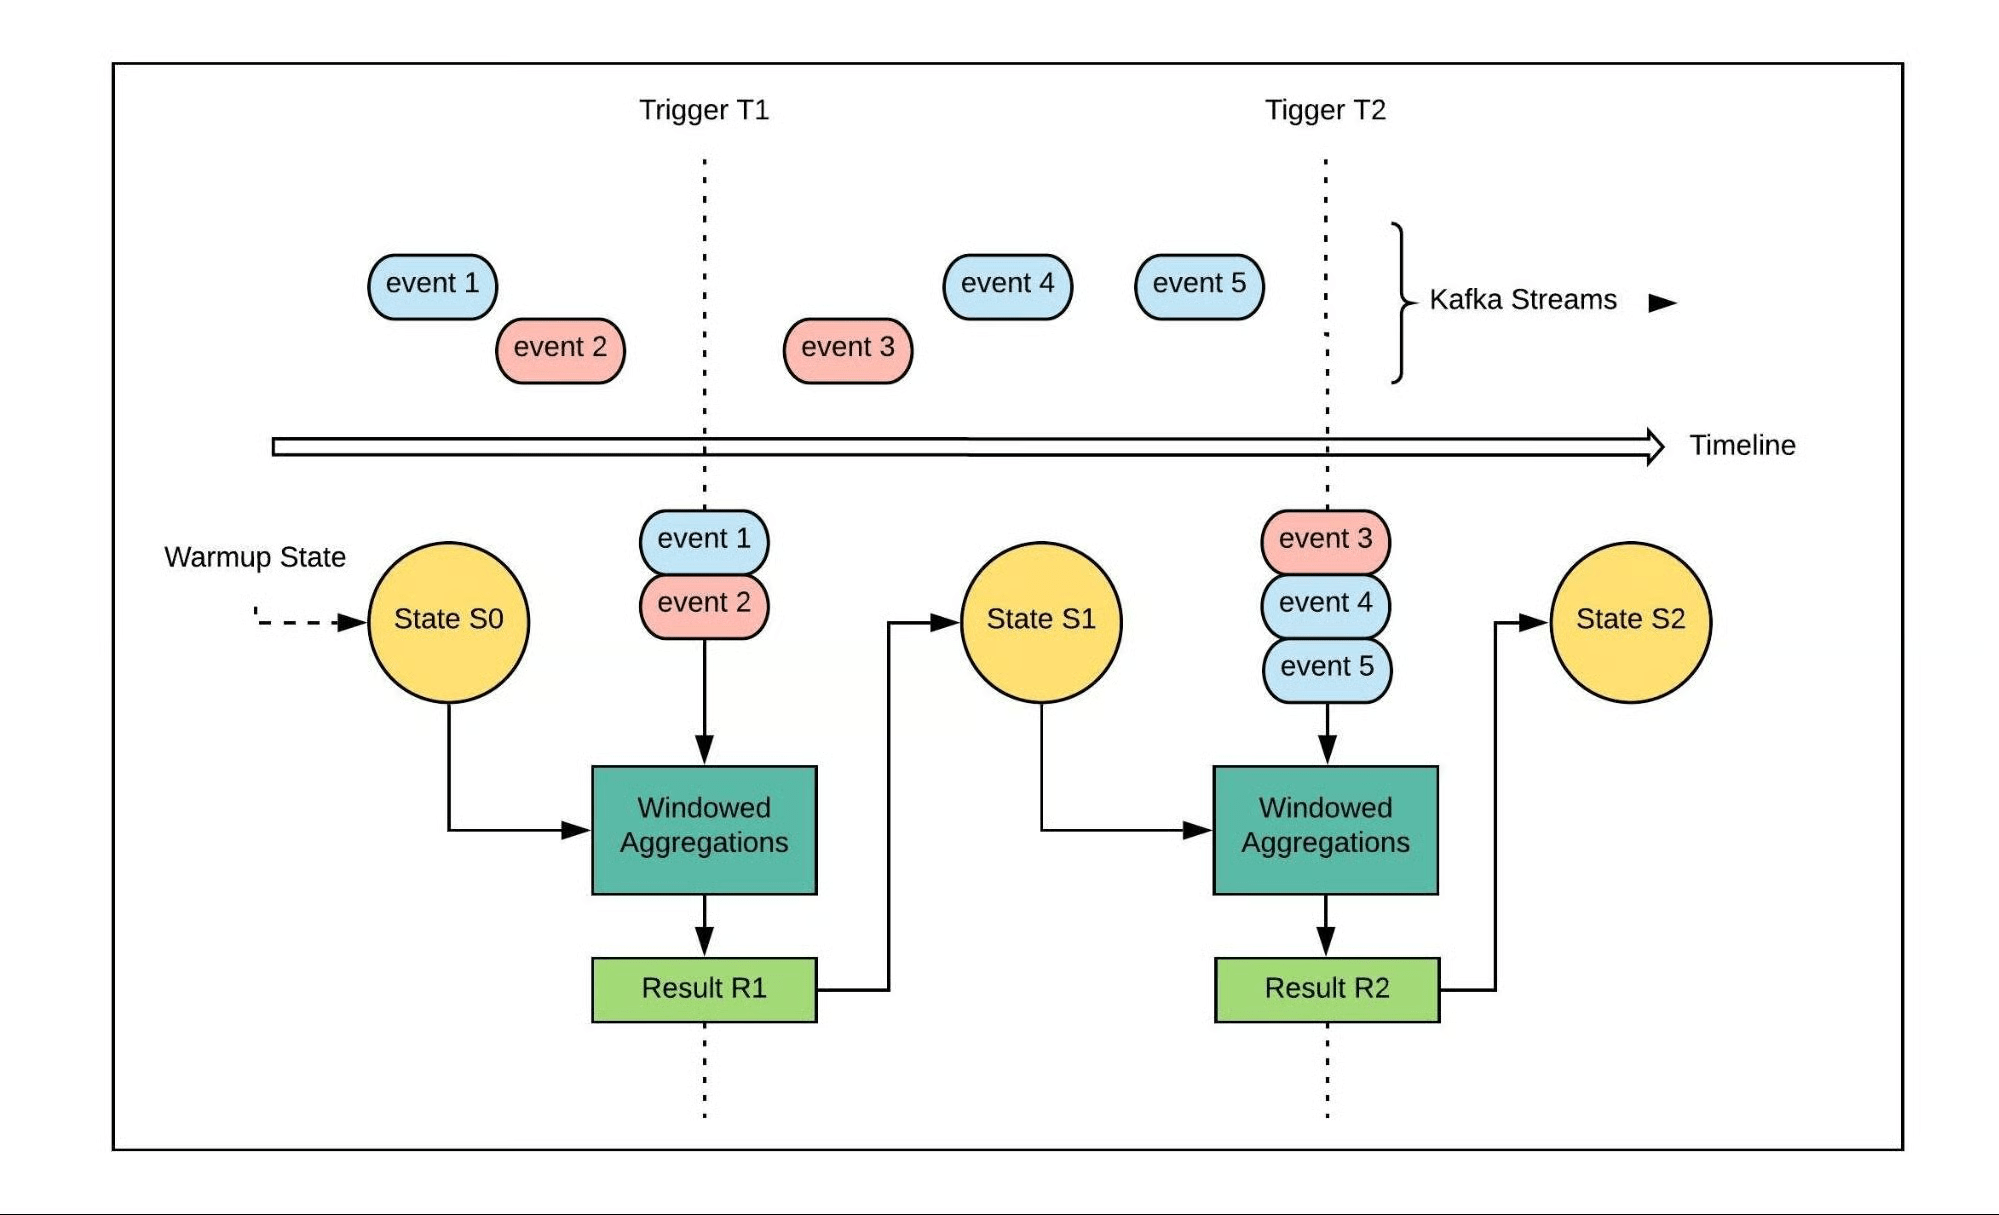
Real-time data processed directly, transforming on the fly
Data streams treated like immutable logs
New and historical data handled uniformly (replay)
Simplifies processing, avoiding duality of batch/stream (ensure business logic is consistent)
Low latency, but full reprocessing can be expensive
Examples: Kafka, Flink, Storm
Greek letter κ supersedes λ
Uber event processing
Challenge: backfilling of streaming workloads using a unified codebase.
Goal: Replay Uber rider sessions for accurate monthly business analysis
Example: Rider waits to rate a driver until their next Uber app session
Solution: Use Kappa architecture and process in event-time windows to allow late-arriving and out-of-order events
Benefit: Switching between streaming and batch job is just a switch of data source (live vs replay)
Querying streams with “SQL”
HiveQL: SQL-like queries on streams
Ingest streaming data from Kafka into Hive
Process streaming events using regular SQL
(~ materialised view)
| event_id | user_id | event_type | event_timestamp | region |
|---|---|---|---|---|
| 3133 | alice81 | purchase | 17:52 | Europe |
| … | not here yet! | |||
{ "event_id": 3133, "user_id": "alice81", "event_type": "purchase", … }| event_id | user_id | event_data |
|---|---|---|
| 3133 | alice81 | { … } |
| … | not here yet! | |
Each result rows output as their source data arrives
Structured Streaming with Spark SQL and DataFrames
spark.readStream.schema(schema).json("s3a://...") \
     .createOrReplaceTempView("events")

results = spark.sql(
  """SELECT * FROM events
  JOIN people
  ON events.device = people.device""")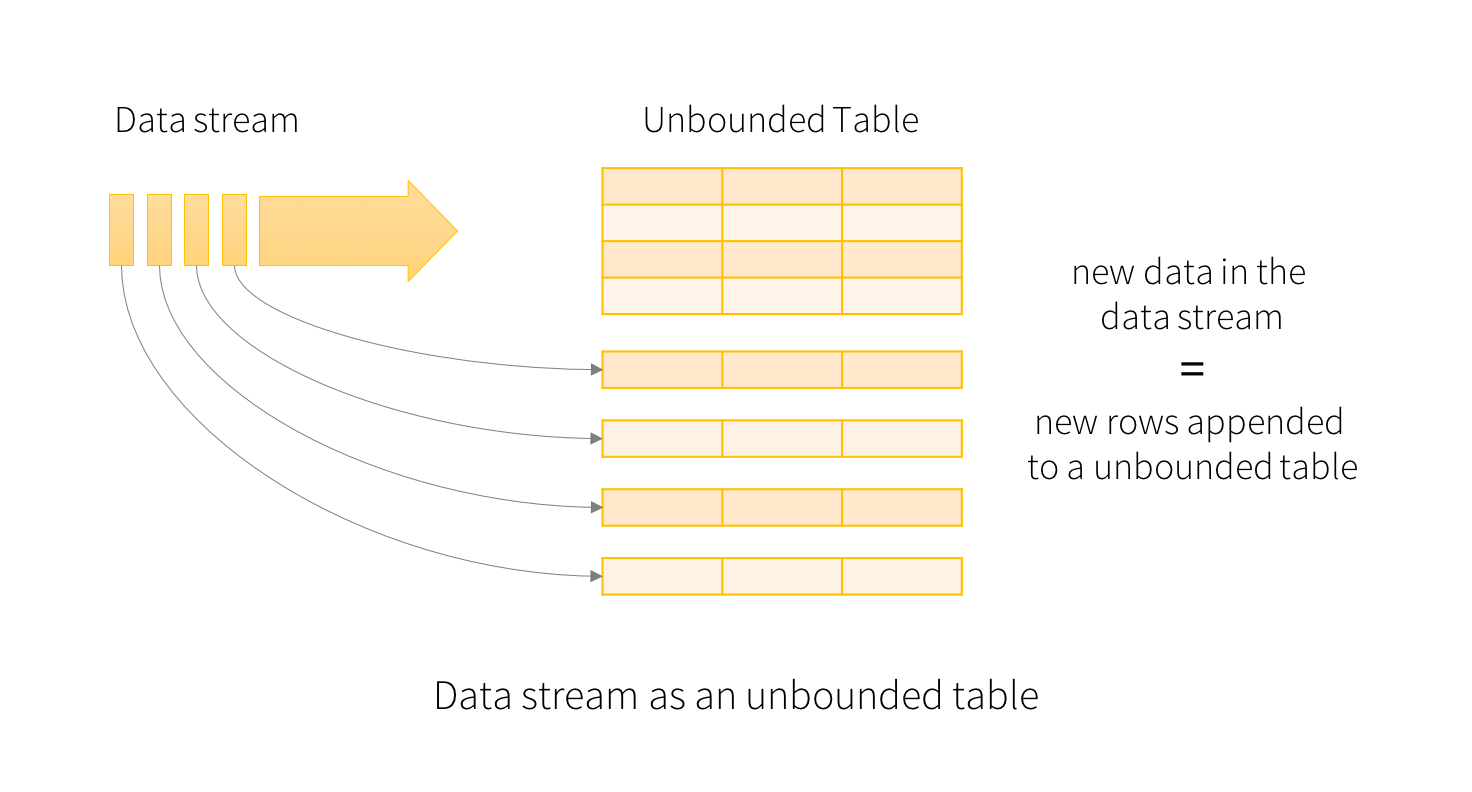
results.where("signal > 10").select("name") \
       .writeStream.format("console").start()
Any Spark data source can be queried
DataFrames have SQL-like methods
Kappa style using Kafka and replay
spark.readStream.format("kafka") \
     .option("subscribe", "events") \
     .option("startingOffsets", "earliest") \
     .load().createOrReplaceTempView("log")
Key points on transformation
Design: What questions do we support? What is our target grain and representation?
Engineer: Where do we compute? Make reusable transformations.
Represent: Decide on different dimensions, features and semi-structured representations. Time as a dimension.
Scale: Let the database/platform optimise your transformations. Design for use of cloud resources.
Stream: batch vs stream -- latency vs completeness.
SQL works on streams!