Serving and disseminating data
COMP63301 Data Engineering Concepts
Stian Soiland-Reyes


This work is licensed under a
Creative Commons Attribution 4.0 International License.
Intended Learning Outcomes
- Understanding of requirement needs for data products
- Ability to clarify data semantics
- Distinguish analytics, reports, dashboards and ad-hoc analytics
- Consider aspects of serving data, e.g. file vs db
- Reflect on machine learning needs
- Completing the data engineering life cycle

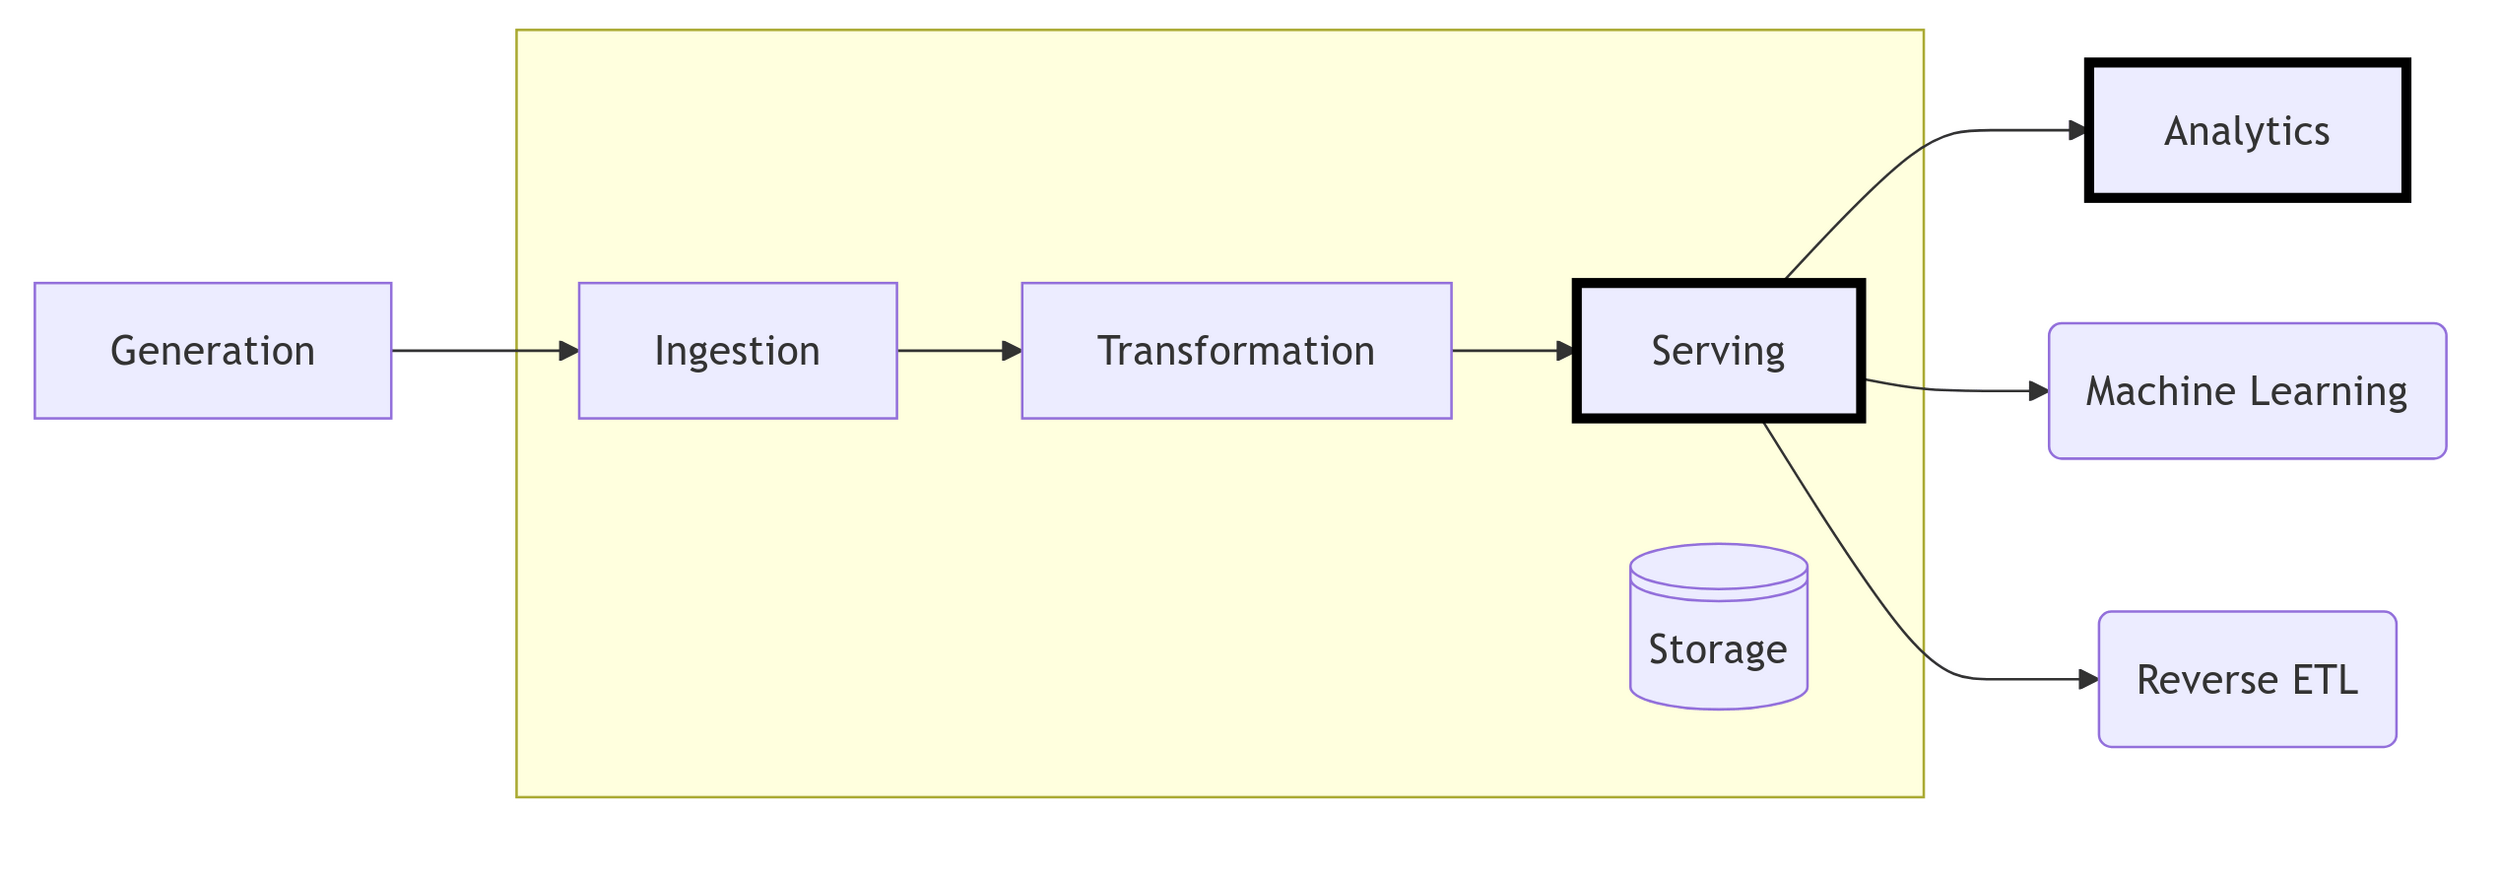
Serving
delivering data products
Data products
What are data products for?
- Delivering processed data to downstream stakeholders
- Data for analytics and
business intelligence (BI) - Data for statistical analysis
- Data for reporting and dashboards
- Data for machine learning
- Data for complementing original data platforms (reverse ETL)
tl;dr: Data helps the business make decisions


Engineering for users
Gather requirements
Understand end user needs
Get overview of the "arena", why do the they need data?
Improve data products based on feedback
Who and what is the data for?
What should be accomplished from using the data?
Is the data for internal or external users?
What will be the measurable outcomes?
Self-service or tight integration with analytics?

Understanding
data semantics
Data definitions
Explicit definitions help reduce data misunderstanding

Customer Account
The registered profile containing customer details such as name, contact information, and account preferences.
Trade Account
A special type of customer account for professional tradespeople, usually offering benefits such as credit terms, bulk pricing, or exclusive promotions
Product
An item we sell, such as tools, hardware, equipment, or supplies. Products have attributes like size, material, brand, and specifications.
Product Category
A grouping of similar products (e.g., “Power Tools”, “Plumbing”, “Electrical”). Helps customers navigate the catalogue.
Product Variant
A version of a product that differs by a specific attribute (e.g., size, color, voltage).
- Be pragmatic, avoid getting philosophical
- Definitions are approximations
- Always give examples
- Write down and share the definitions, verify your understanding of the concepts
- Definitions vary for different data products.

Data Logic
Expose business rules from underlying assumptions, e.g. in calculations or decisions
Brazil (Terry Gilliam, 1985) - Ministry of Information
https://www.youtube.com/watch?v=7xNnRBksvOU
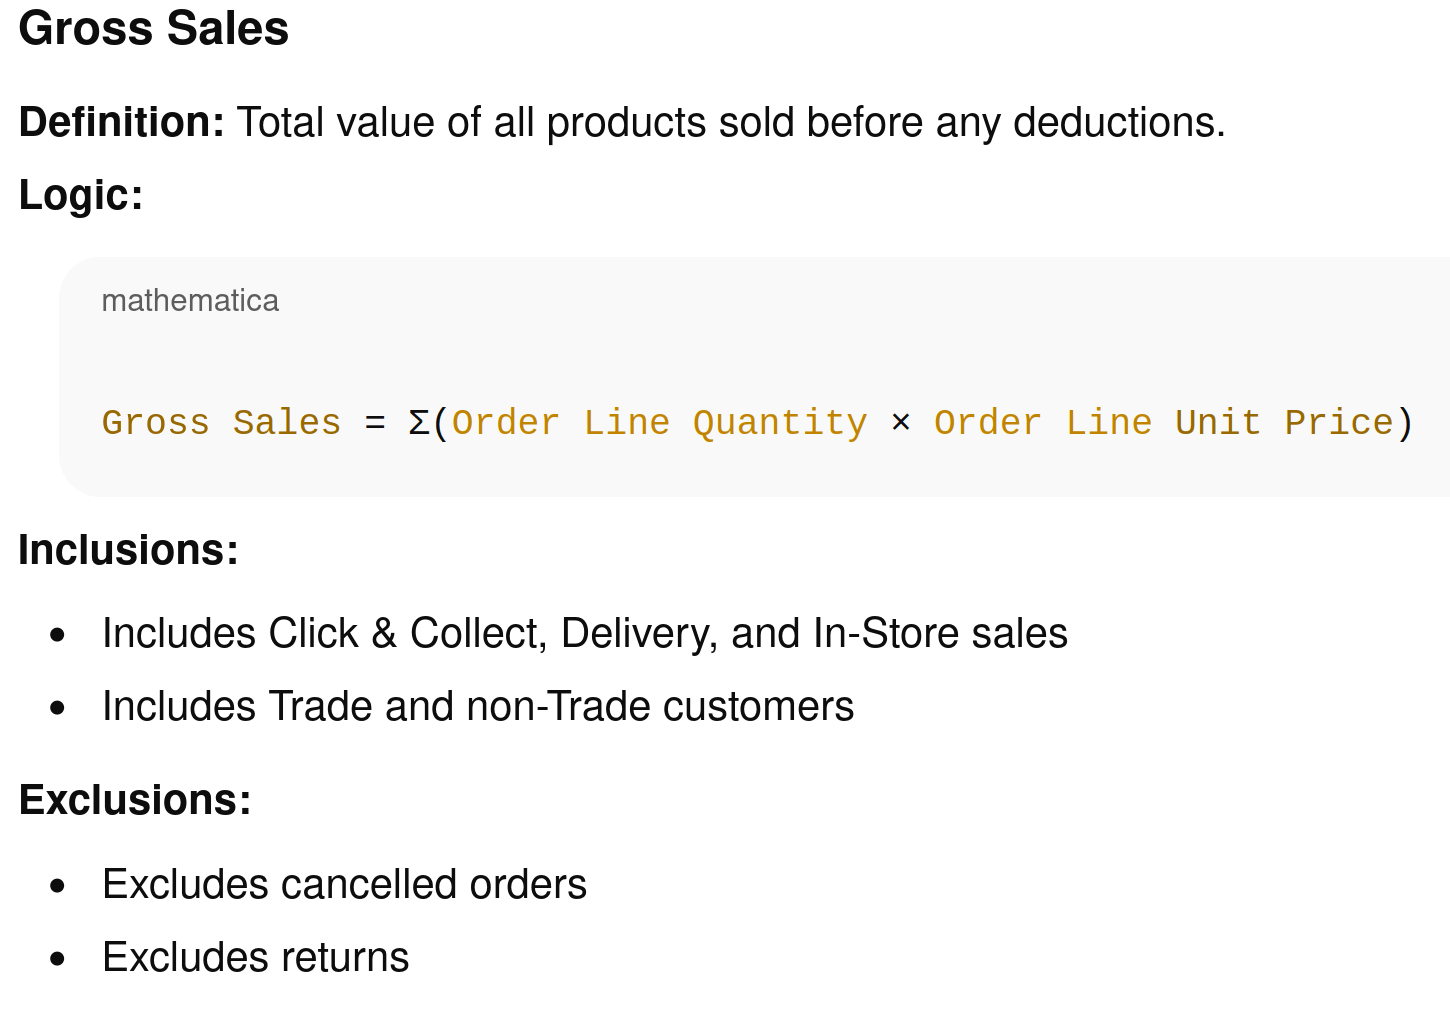
- Highlight edge cases you had to make assumptions for
- Don't be too precise, the director does not want to see your SQL!
- Consider that different data sources may not be consistent in their data logic
- Have you understand the business processes?
Describe data products
Metadata What data product is being provided for which purpose? Which data logic rules are assumed?
Schema What is the data structure? Relate to data definitions!
Provenance How was which data collected and processed?
Attribution Who did the work, and what was it based on?
Versioning e.g. "Sales report 2025Q2 v1.0.4"
(Data can also use Semantic Versioning)
Machine readable schemas
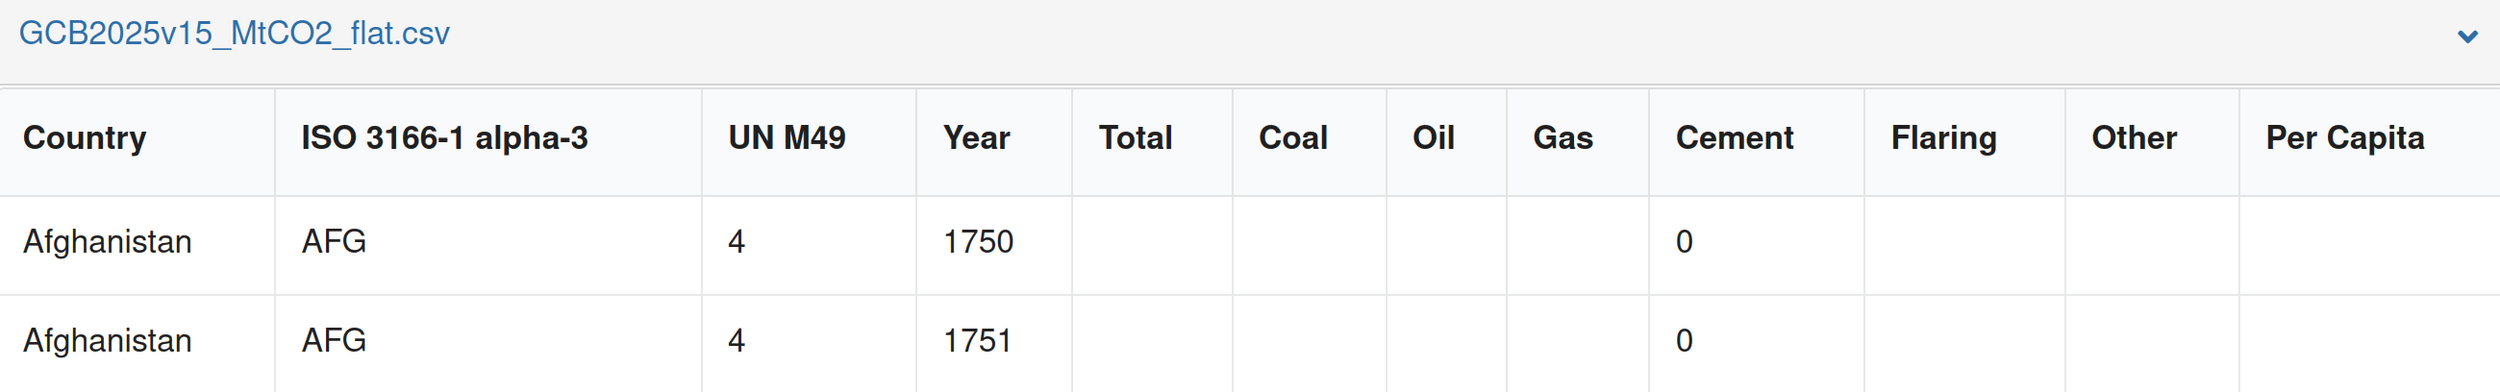
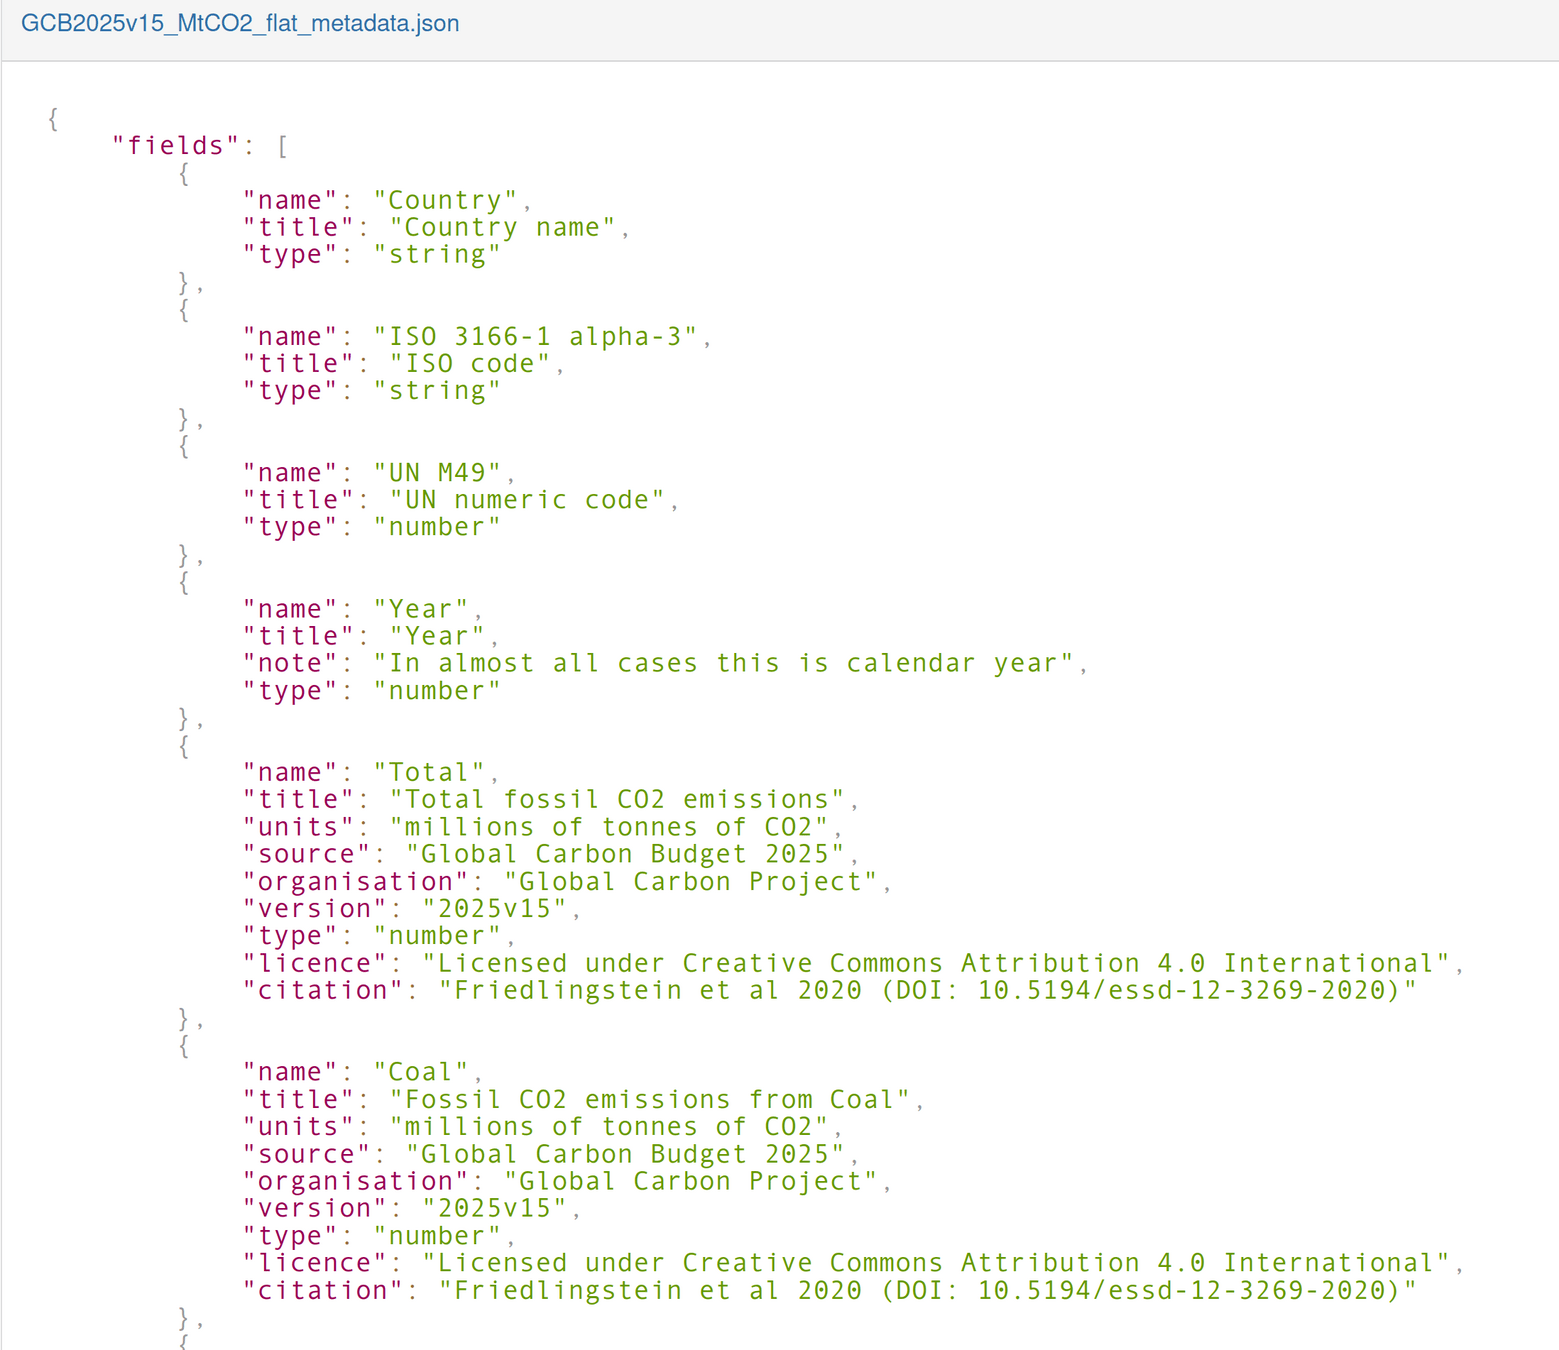
Column headers are usually not precise enough, nor consistent
Machine readable schemas can be validated and reasoned over


Analytics
Business analytics
Data for Actionable insight
Retrospective, finding
longer-term trends
Reflects on and informs strategic decisions (e.g. how effective was an advertising campaign)
Mixture of fixed metrics ("sales of screwdrivers this month") and ad-hoc data questions ("How many clicked on our campaign")
Operational analytics
Data for Immediate Action
Monitoring of current operations and applications
Real-time metrics e.g. requests per second, queue waiting time
May trigger automatic actions, e.g. Open new till to reduce queue
Can be predictive or reactive, e.g. increase cloud instances expecting spike in pizza orders as football match starts on TV


Reports
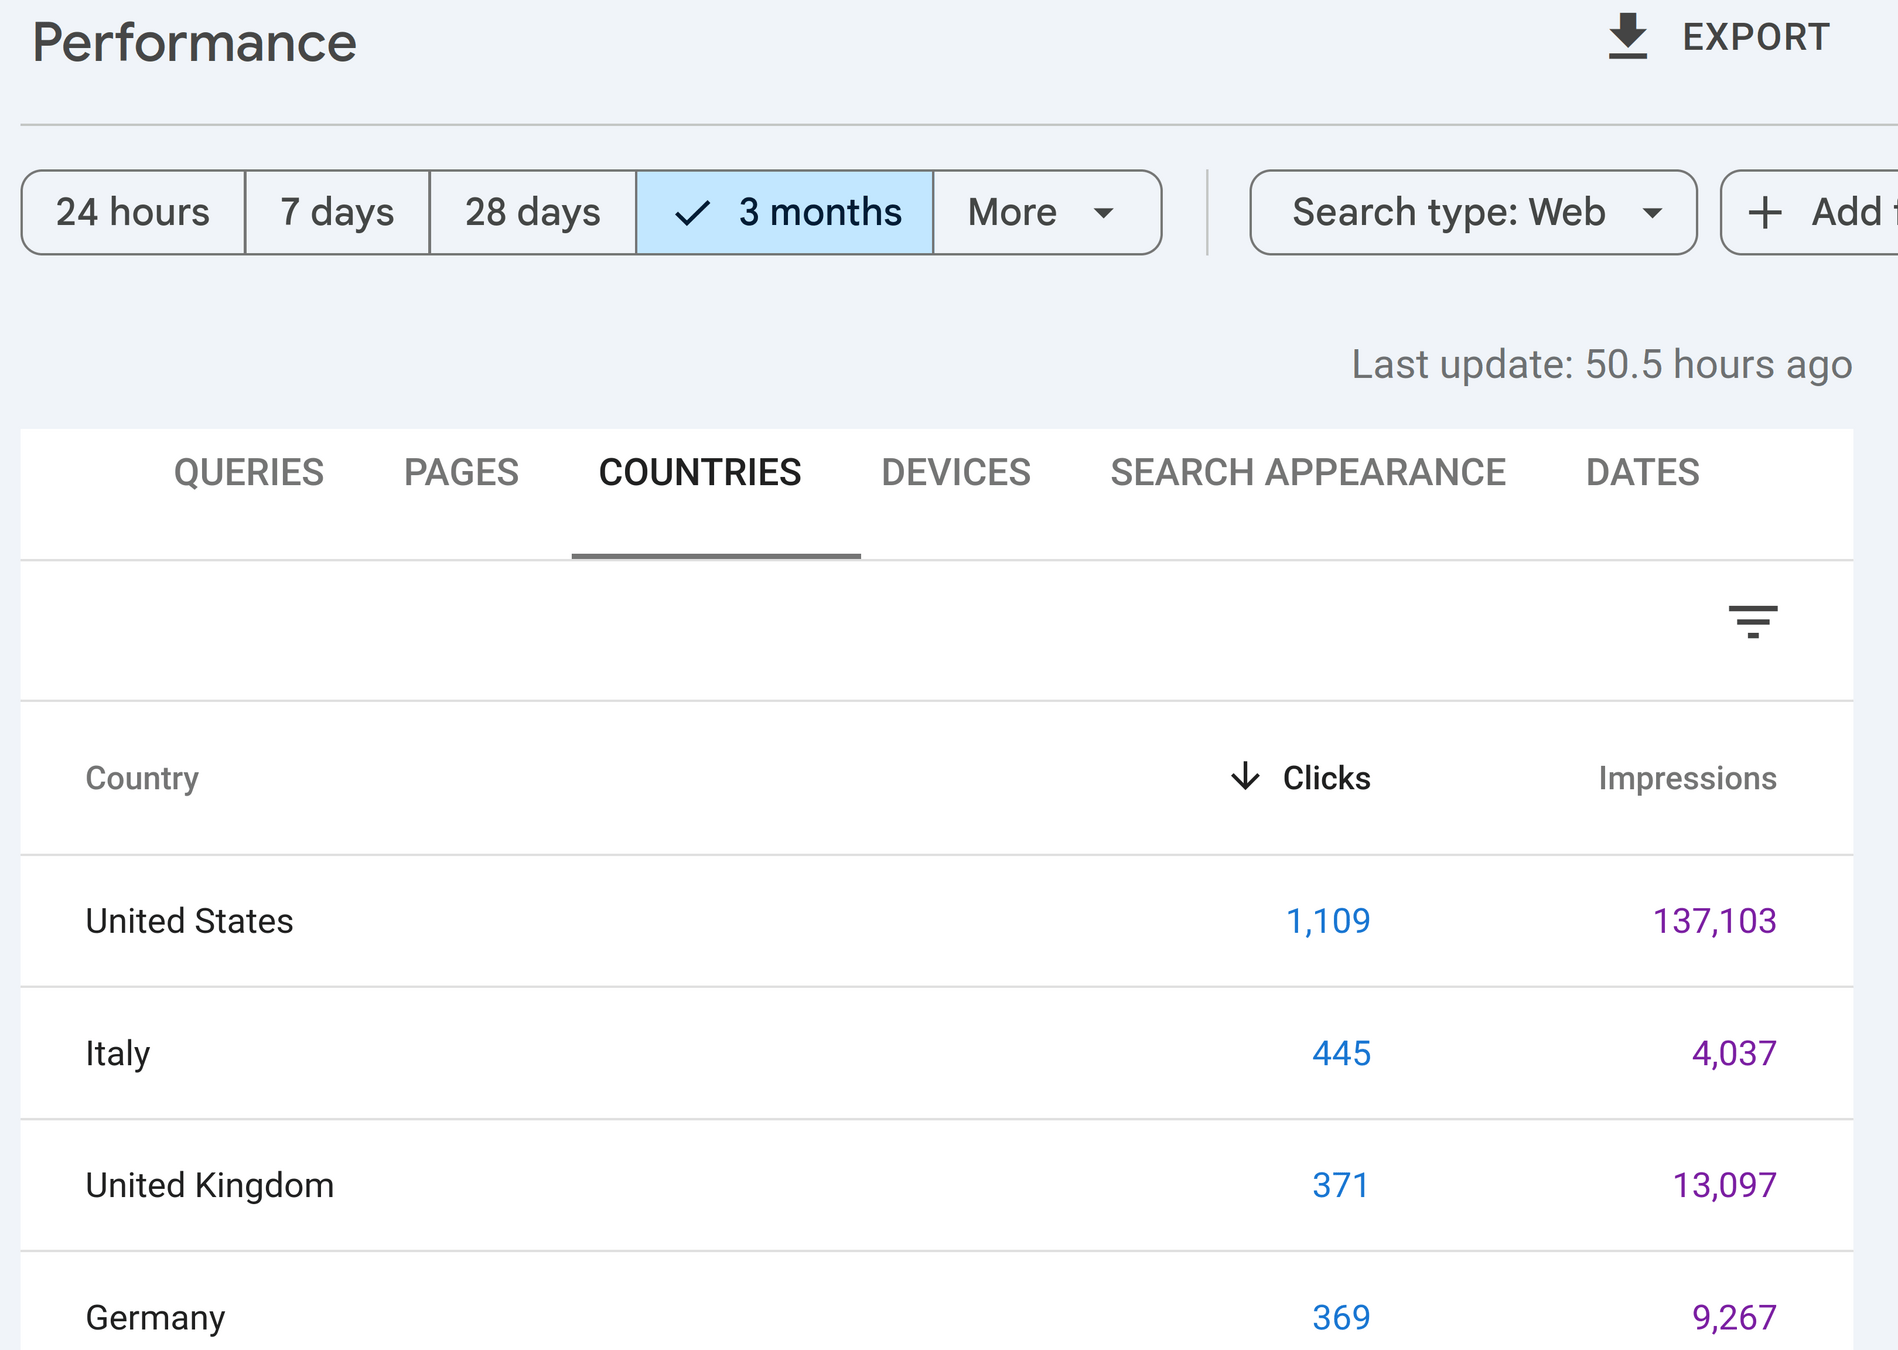

Reports answers predefined questions, typically presented in a table or charts
Reports can be interactive applications, e.g. filtering (e.g. Only mobile devices in Europe) and search (e.g. Views of "power drill")
Reports typically use already prepared queries and transformed datasets
Reports
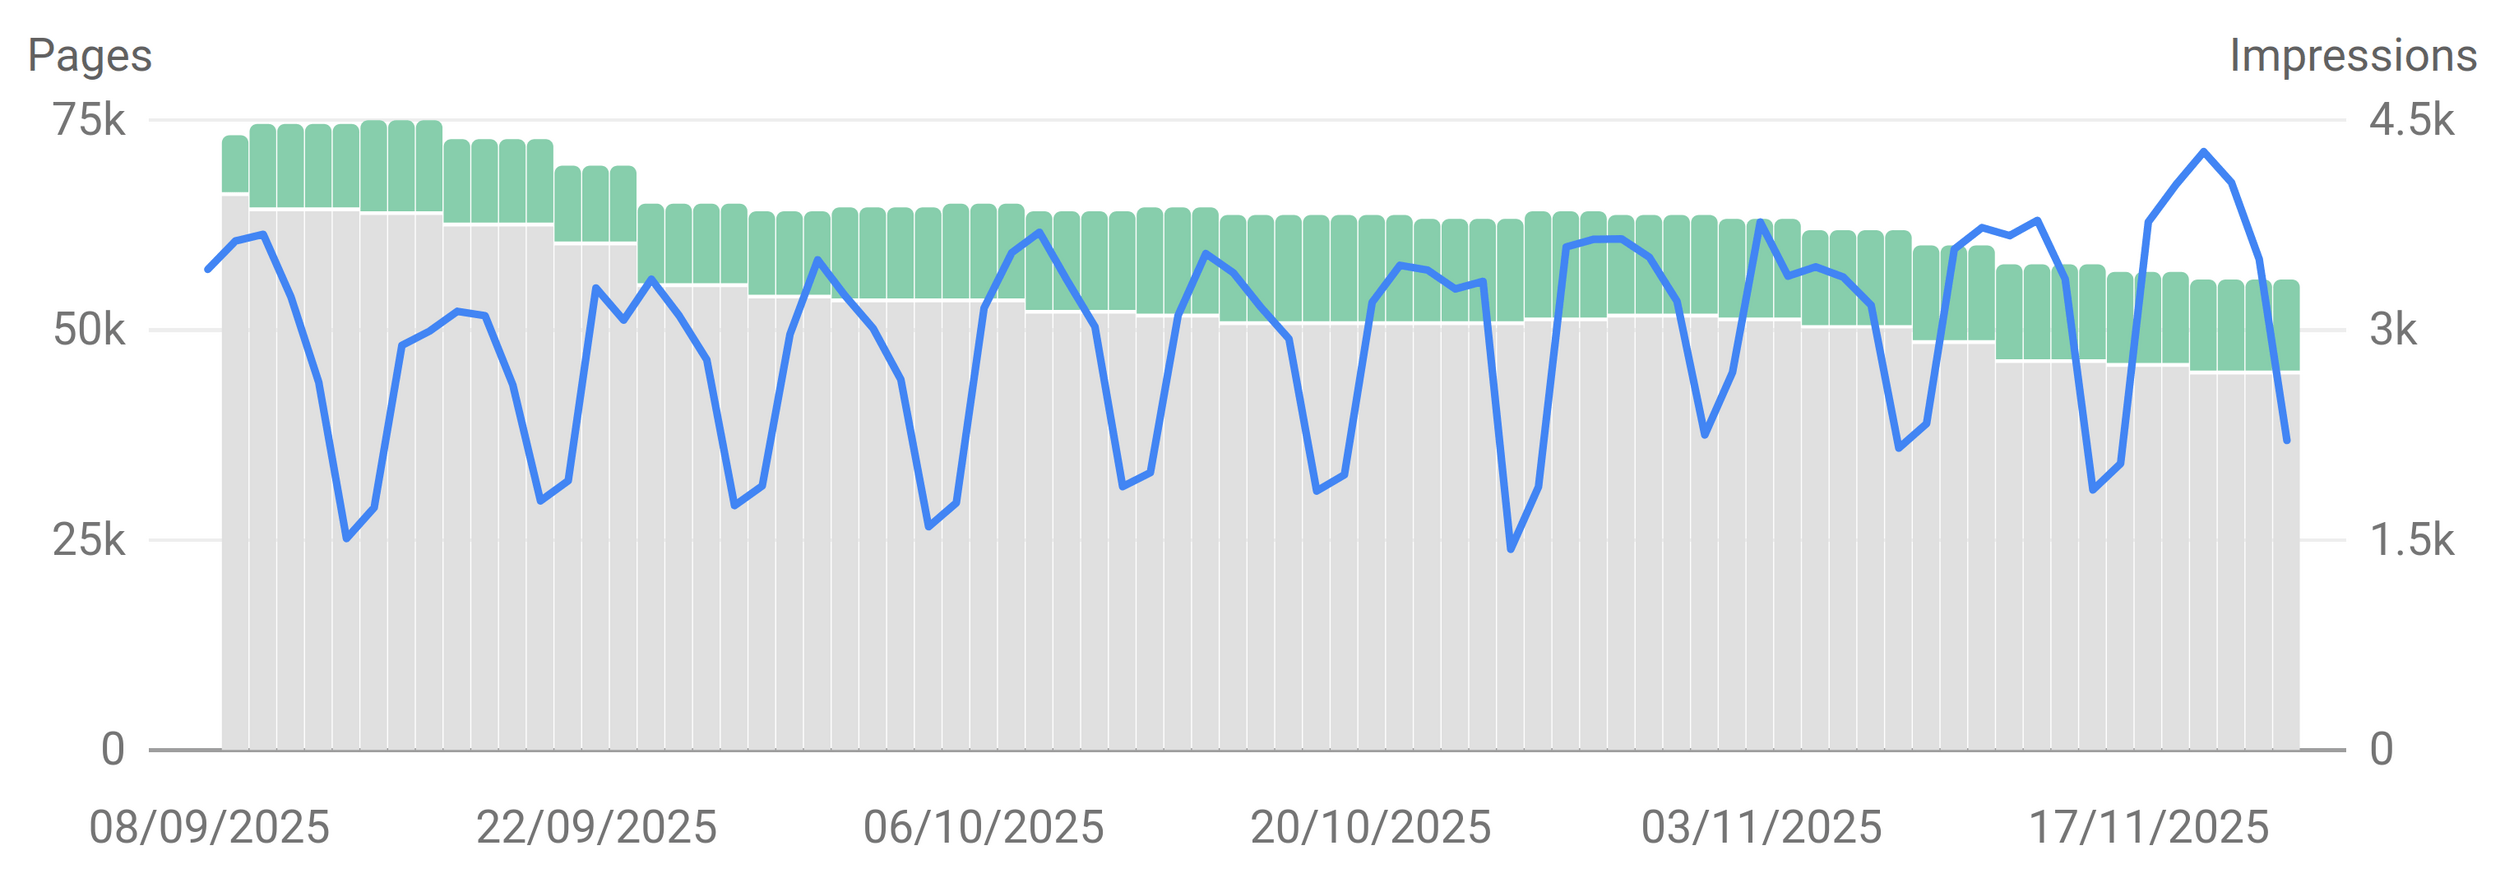
Dashboards
Displays performance against core metrics in a single view
Typically shows aggregates from multiple data sources, e.g. Total number of sales
Focus on critical aspects of already known importance
Limited level of interactivity
Starting point for navigating into deeper reports
Dashboards can be created by end users using platforms like Power BI and Apache Superset
Dashboard
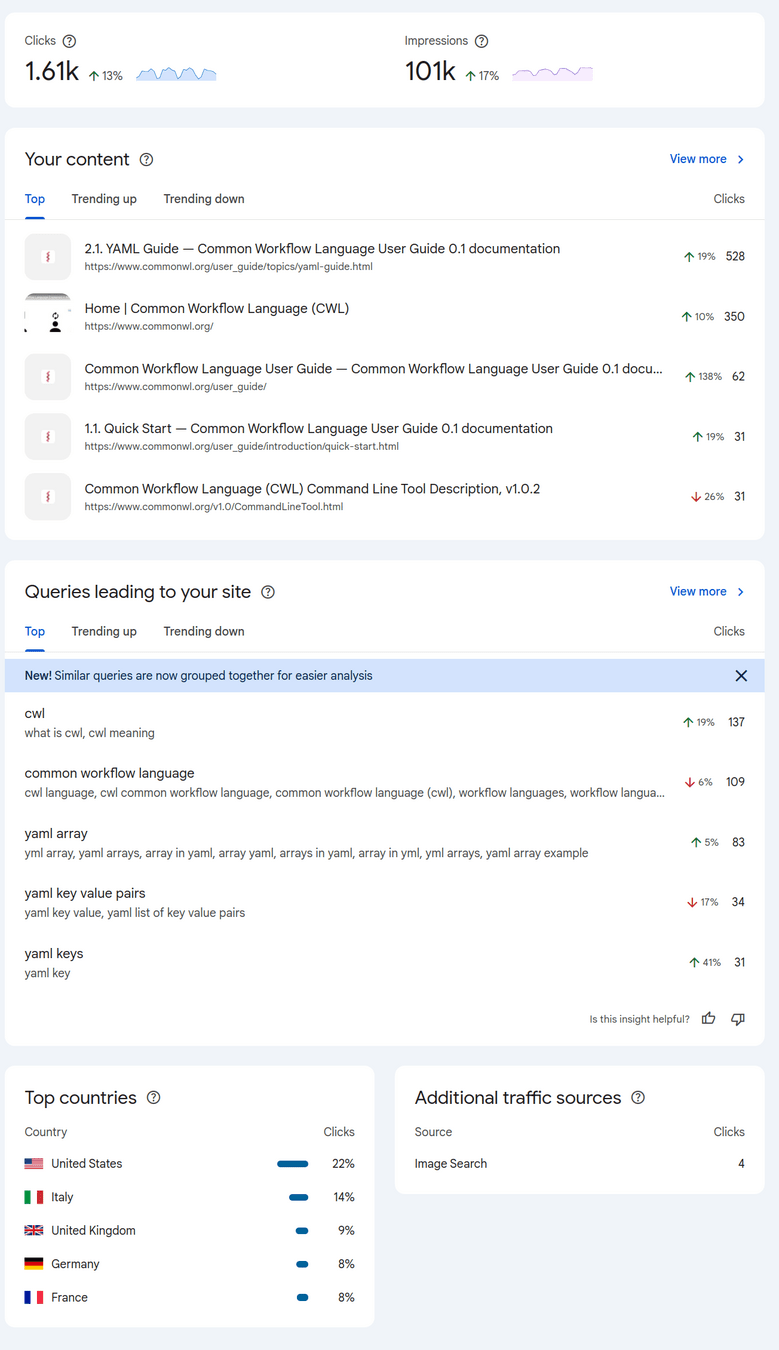
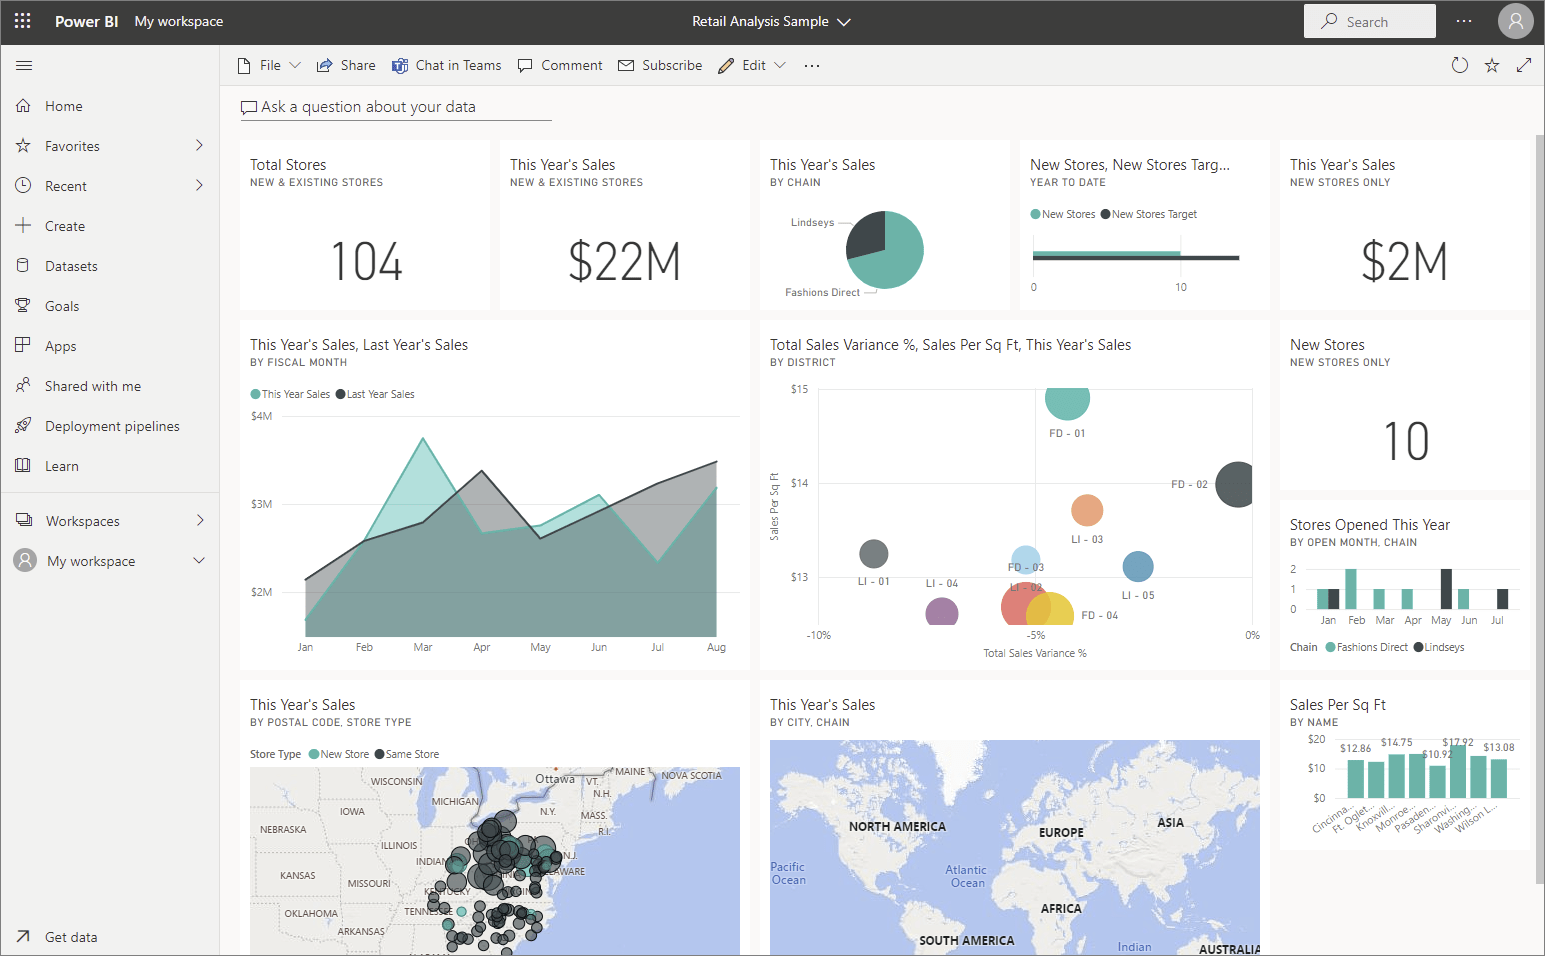
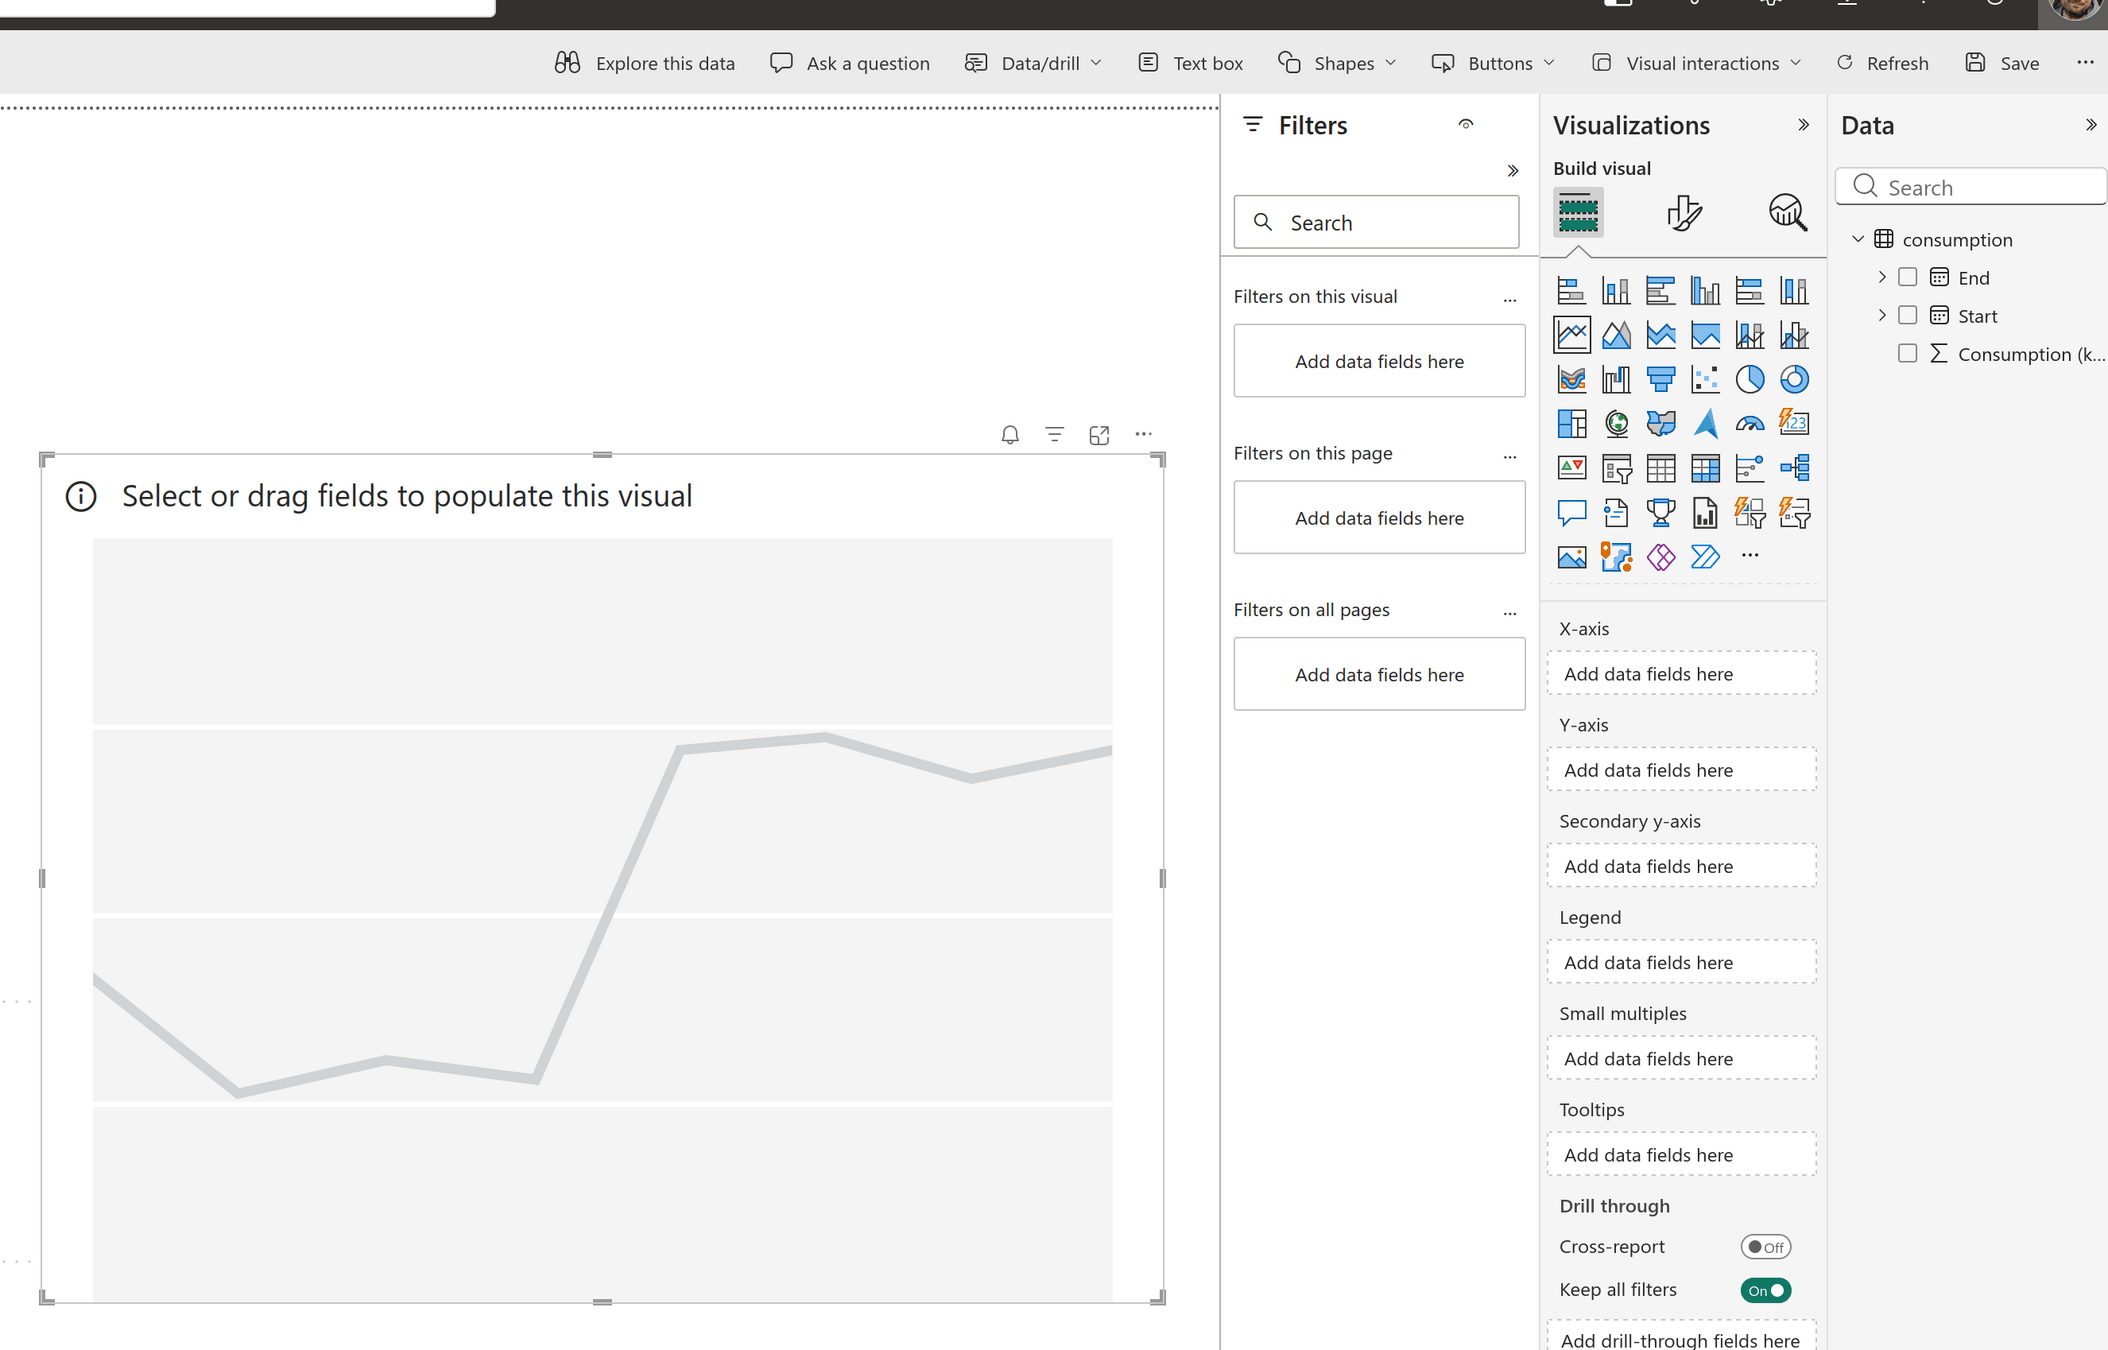
Business Intelligence tools have interactive report/dashboard editors
Ad-hoc analytics
Notebooks
Why using notebooks
Dynamic, quick to change analysis code (data playground)
Ad-hoc analyses are by their nature error-prone, e.g. under-specified requirements
Code is visible, but visual presentations are directly embedded

Turing Way illustration by Scriberia
https://doi.org/10.5281/zenodo.3332807
Machine learning
Using Machine Learning
Machine learning frameworks (e.g. PyTorch, scikit-learn, TensorFlow) can be used directly by data scientists (mostly using Python!)
Supervised Learning (Linear regression, Support Vector Machines, Sentiment Analysis)
Unsupervised Learning (k-means clustering, Principal Component Analysis)
Reinforcement Learning (deep learning, text mining)
Transformer networks (LLM, RAG, MCP)
Challenge: Choosing the most appropriate ML technique!

Preparing data for ML
Data much be transformed for ML use
Each ML framework needs dataset preparation, e.g. identifying columns, categories, training data.
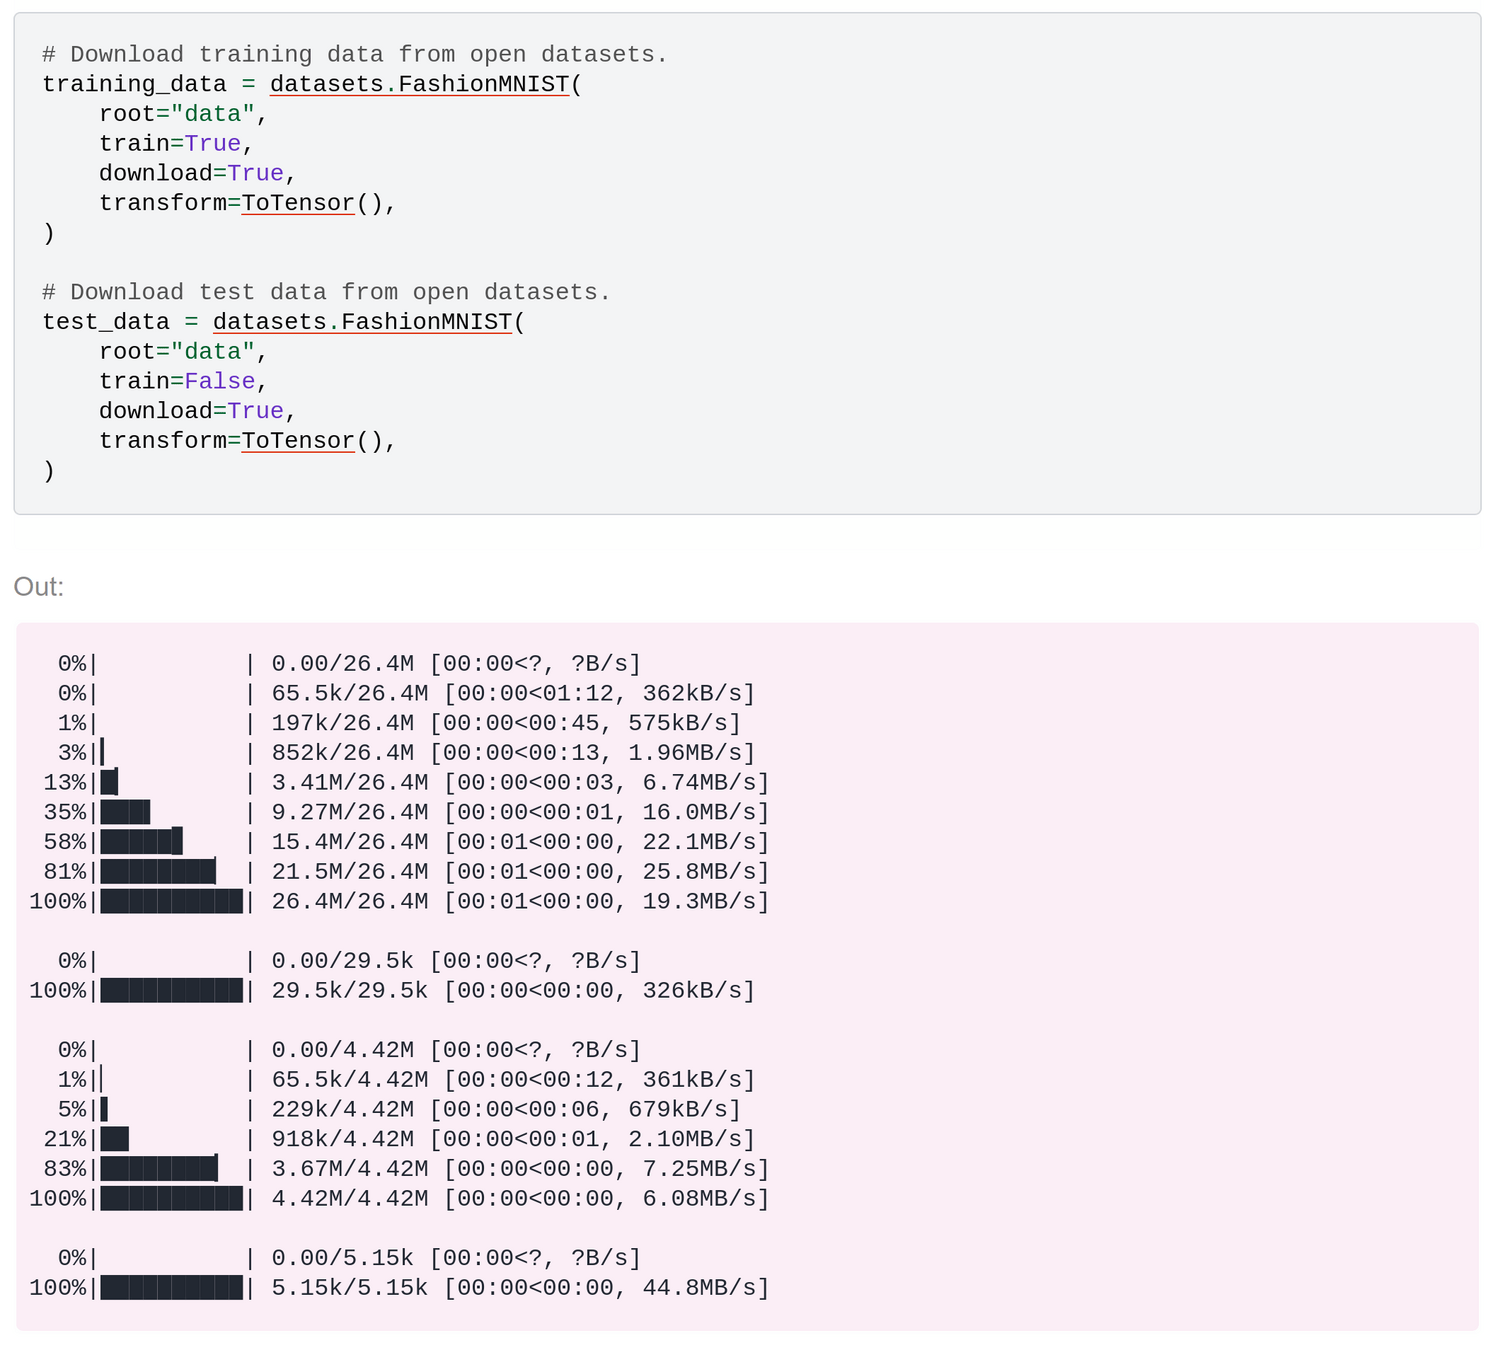
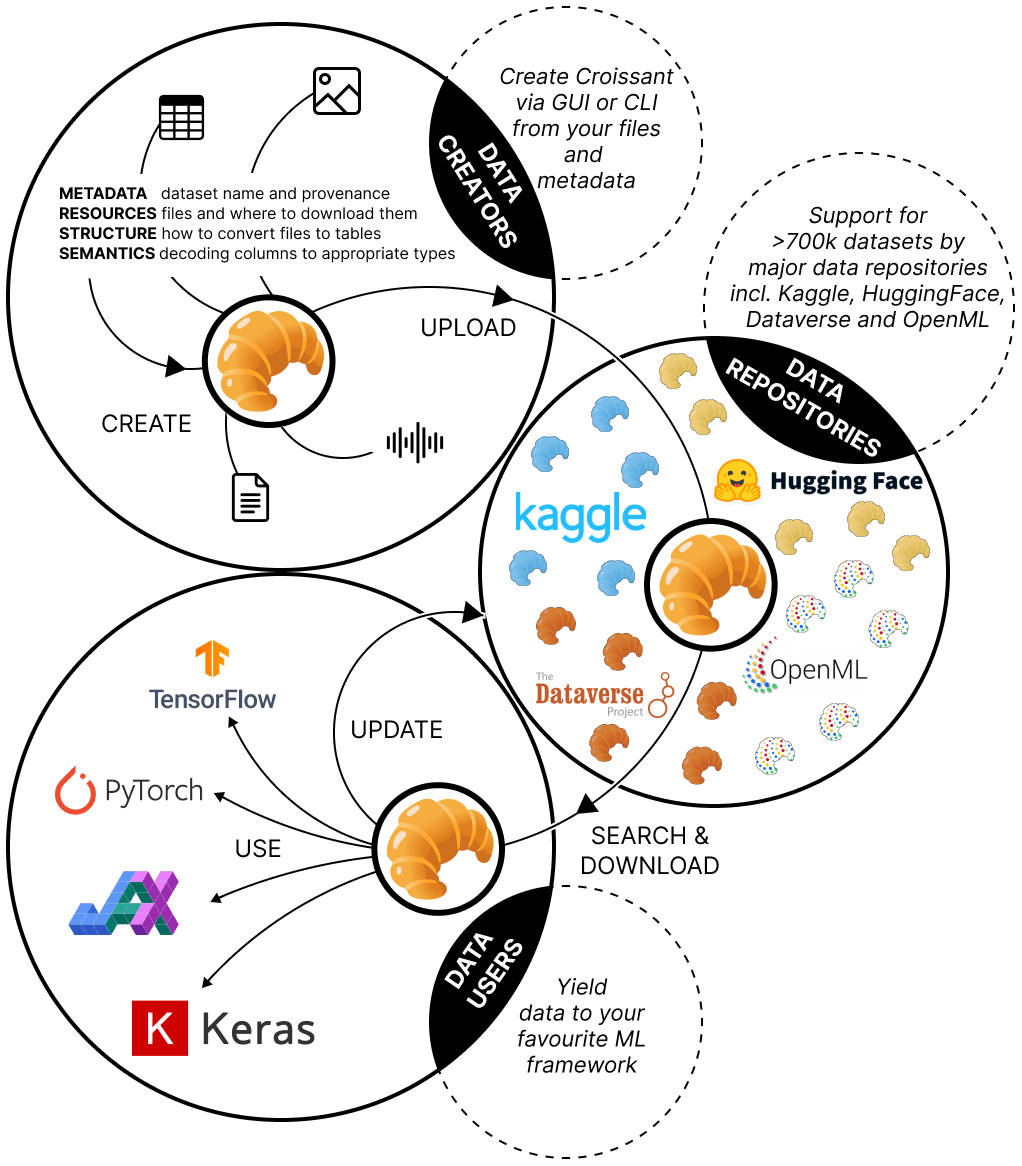
Croissant is a standardized metadata for ML datasets, to simplify load into ML tools
# 1. Point to a local or remote Croissant file
import mlcroissant as mlc
url = "https://huggingface.co/api/datasets/fashion_mnist/croissant"
# 2. Inspect metadata
print(mlc.Dataset(url).metadata.to_json())
# 3. Use Croissant dataset in your ML workload
import tensorflow_datasets as tfds
builder = tfds.core.dataset_builders.CroissantBuilder(
    jsonld=url,
    record_set_ids=["record_set_fashion_mnist"],
    file_format='array_record',
)
builder.download_and_prepare()
# 4. Split for training/testing
train, test = builder.as_data_source(
    split=['default[:80%]', 'default[80%:]'])
Serving data
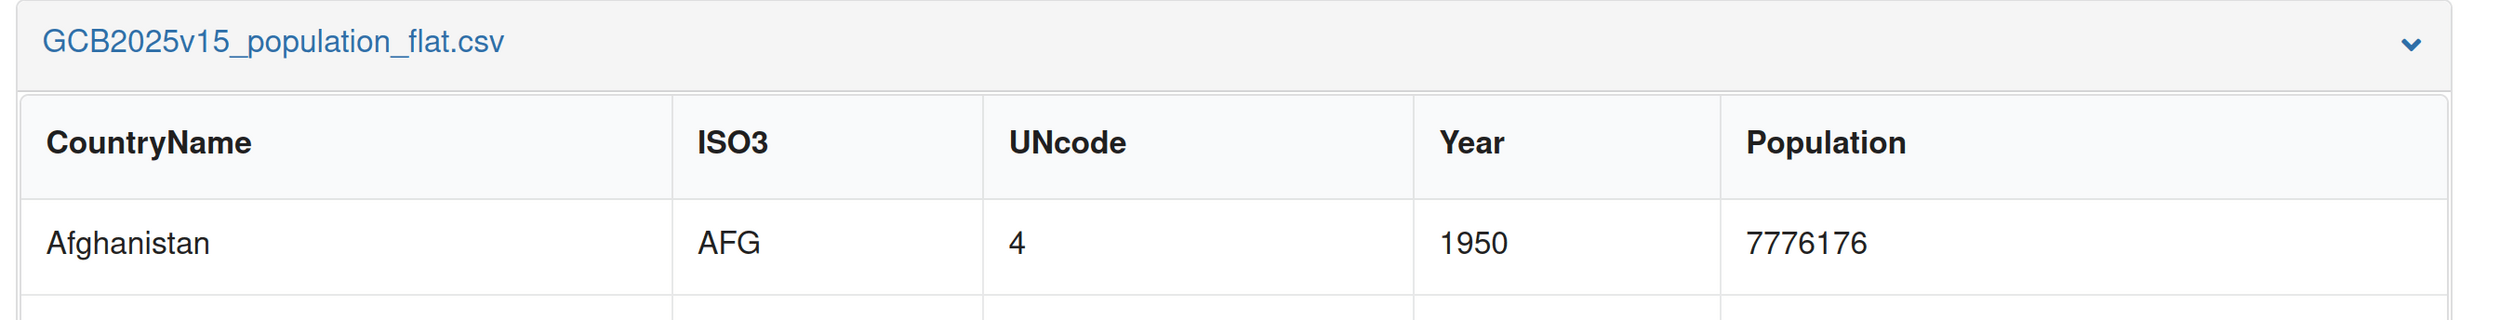
File exchange
Ye Olde CSV file lives again!
Saving to file is easy, but management of those files is not.
Don't send by email, use collaboration platforms!
Use clear versioning in filename. Include metadata!
Database
Data warehouse by the Data Lake
Serving as an Online analytical processing (OLAP) database allows flexible SQL queries and integrates with BI reporting tools.
Separate from operations db, consider performance!
Streaming systems
Streaming can allow immediate serving of data (live view)
Streaming systems can source from OLAP databases, files, APIs and queues
Query Federations can combine multiple data sources
Streaming jobs can be more complex to write and orchestrate
Cloud systems like Kubernetes can scale dynamically for varying end-user demand
Reverse ETL
Reverse ETL
Serve data back from OLAP database back into source systems
(e.g. customer sees "89% find your restaurant reviews helpful")
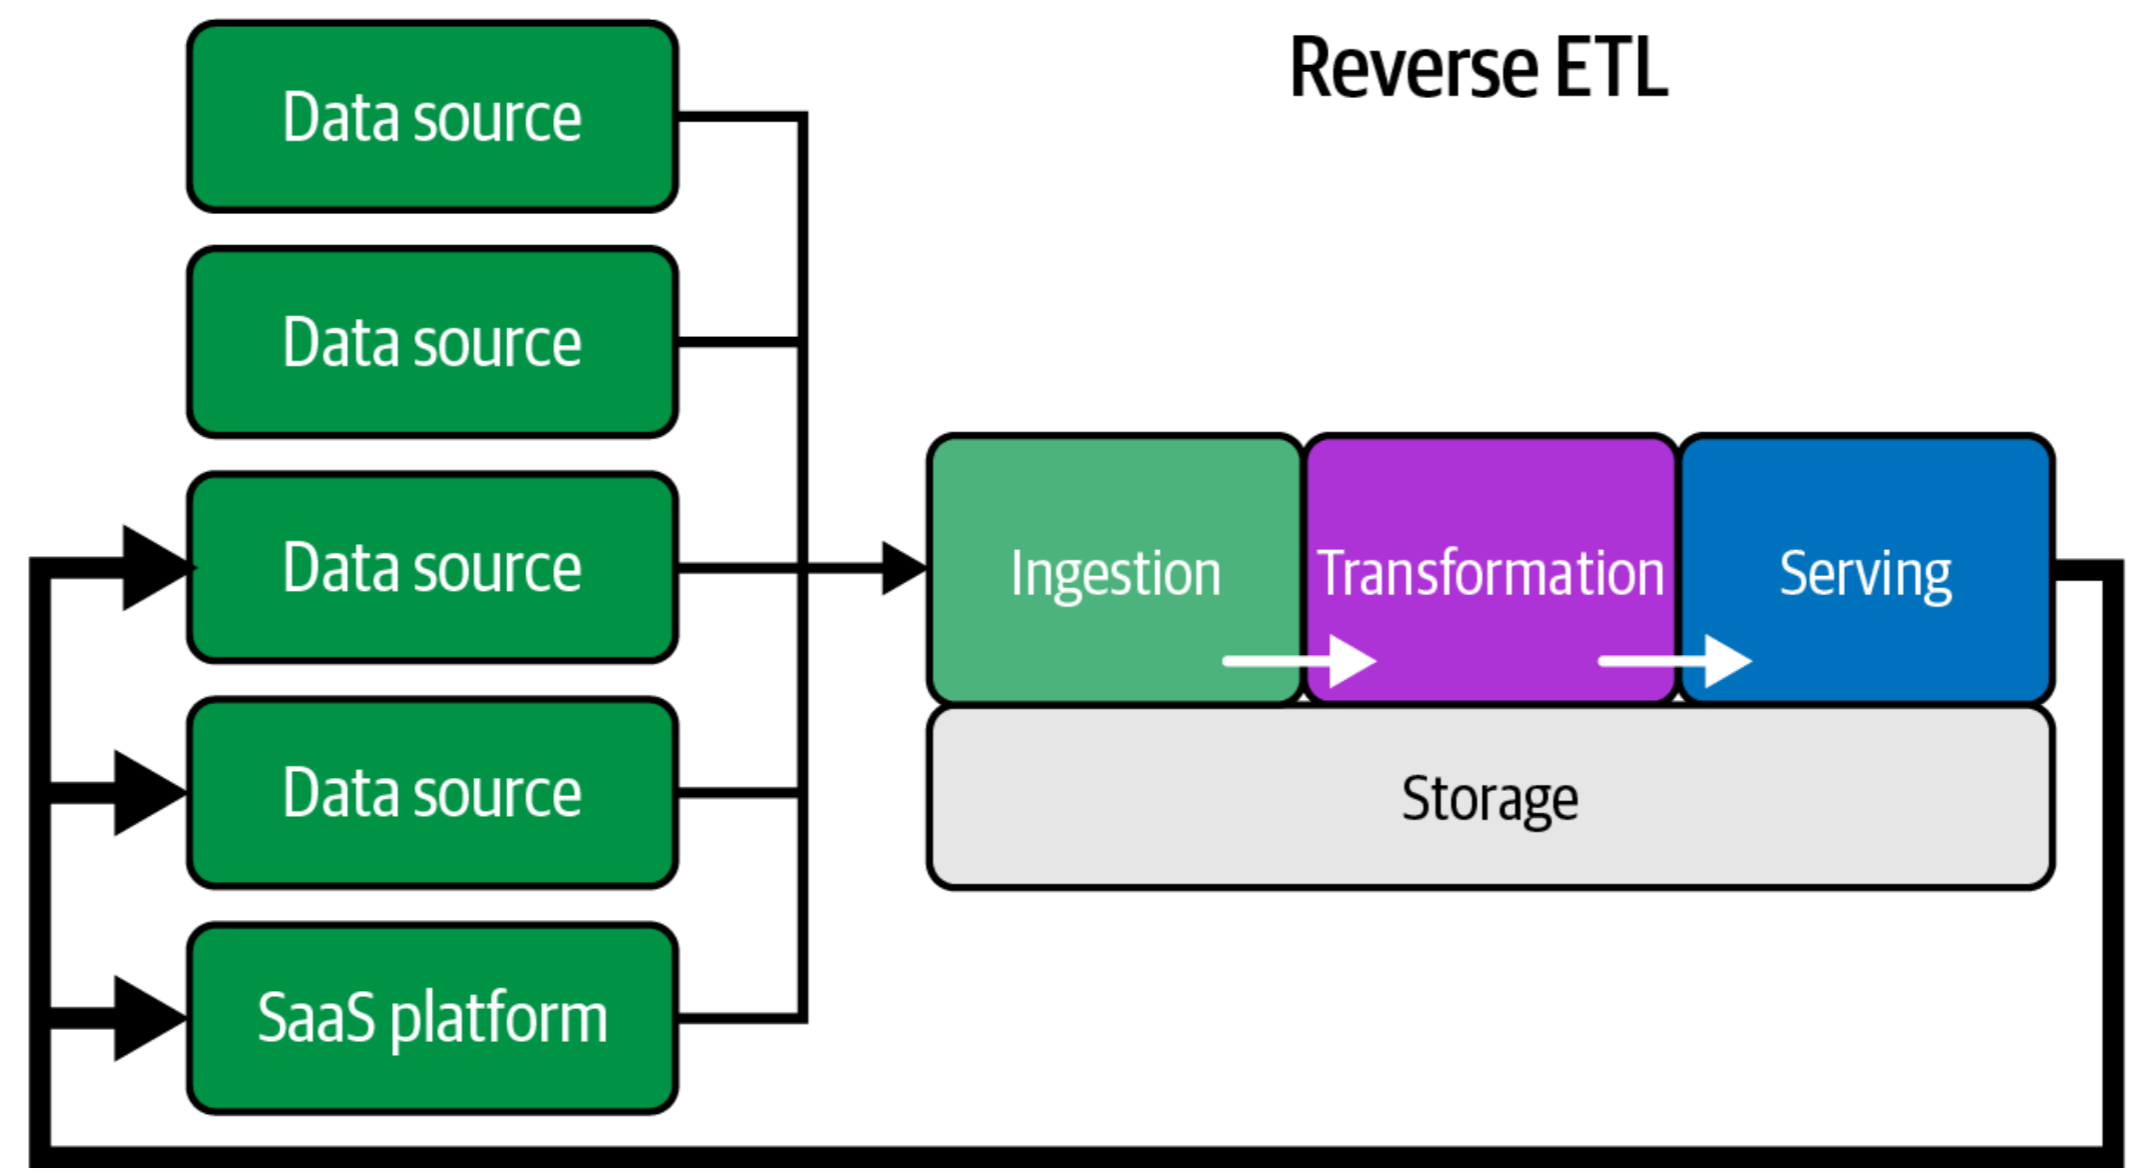
Figure 9.5, Reis & Housley (2022): Fundamentals of Data Engineering
Serving completes the data engineering lifecycle