22–23
B-DC 221
Data Spaces
Computation in Design 3

1
2
3
22–23
Data Spaces
In the current age, data has become a driving force in our daily lives. Our information channels, interactions and digital footprints are seamlessly and ubiquitously captured, collected by algorithms and analysed in data centres to steer the world we live in.
Data Spaces
B-DC 221
Computation in Design 3

The use and treatment of data, often seen as a more scientific and technical matter, is now an increasingly important aspect of a designer's toolkit, processes, and knowledge.
Data Spaces
22–23
Data Spaces
B-DC 221
Computation in Design 3
Data exists in various forms, spaces and formats, often as values stored in databases, sensor data processed in real time, AI systems trained on large datasets, or simply as numbers written on paper.
1
22–23
Data Spaces
B-DC 221
Computation in Design 3

A Cloud, a basement, a Data Center? The Deep Lab book, image taken from a chapter by Ingrid Burrington, Datacentertips. link and link to book (online version)
22–23
Data Spaces
B-DC 221
Computation in Design 3
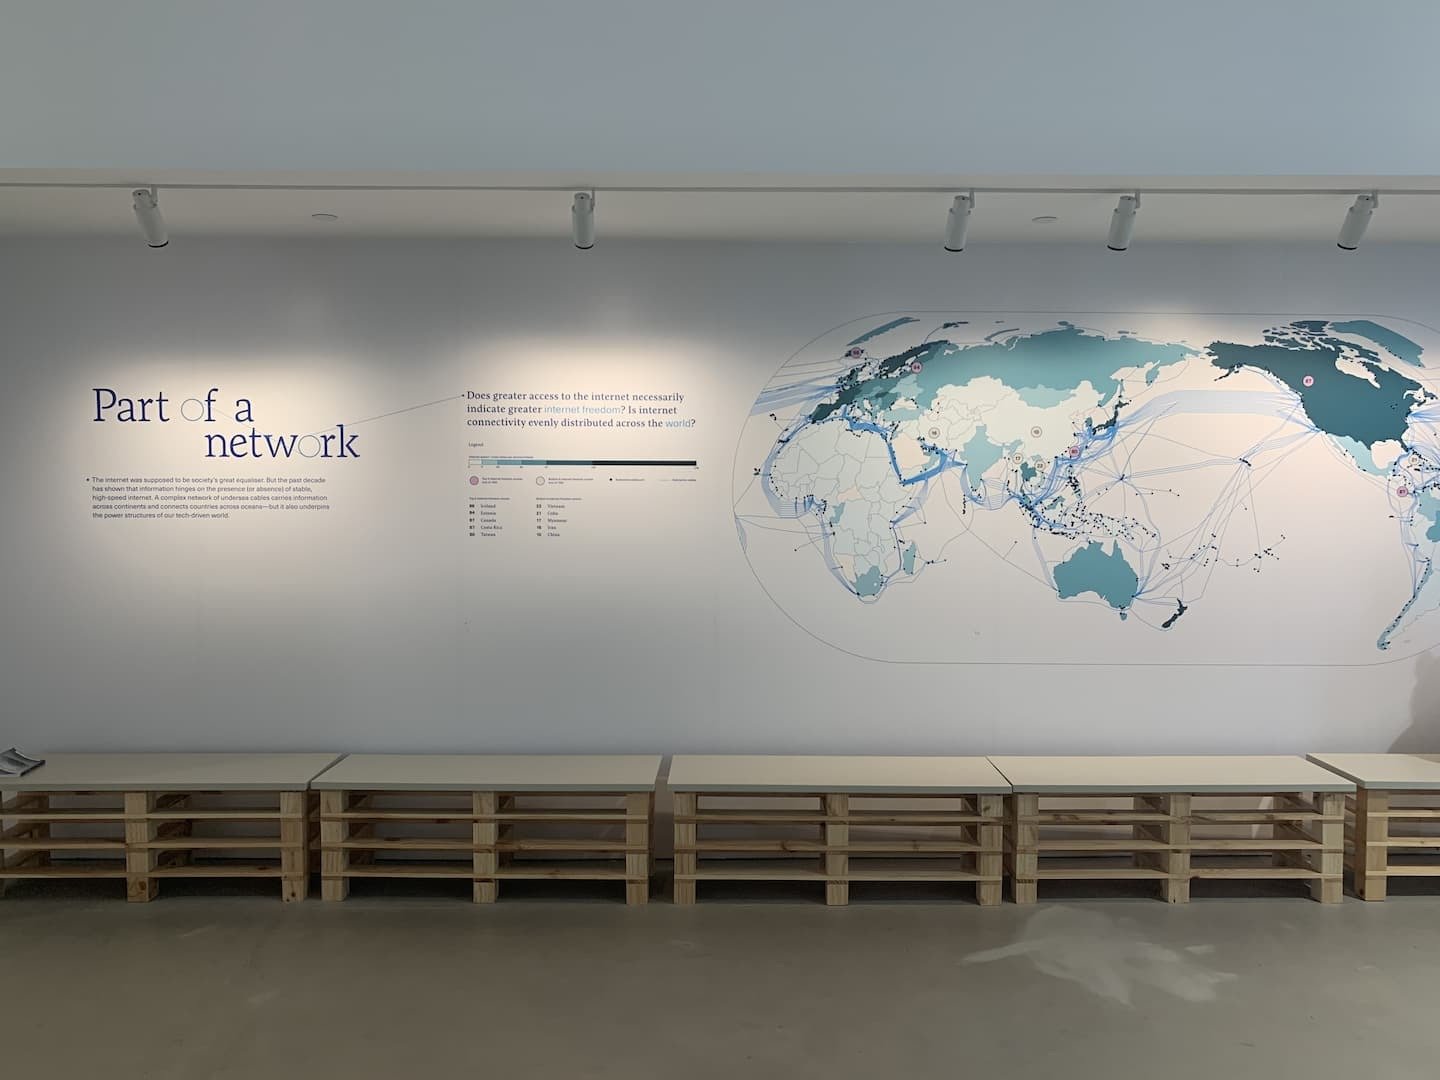
Part of a network
by Kontinentalist, displayed at SAM Tanjong Pagar Distripark.
The internet was supposed to be society's greater equaliser. But the past decade has shown that information hinges on the presence (or absence) of stable, high-speed internet. A complex network of undersea cables carries information across continents and connects countries across oceans–but it also underpins the power structures of our tech-driven world.
At Kontinentalist they tell data-driven stories about Asia.
22–23
Data Spaces
B-DC 221
Computation in Design 3

Part of a network
by Kontinentalist, displayed at SAM Tanjong Pagar Distripark.
The internet was supposed to be society's greater equaliser. But the past decade has shown that information hinges on the presence (or absence) of stable, high-speed internet. A complex network of undersea cables carries information across continents and connects countries across oceans–but it also underpins the power structures of our tech-driven world.
0
Internet speed
superfast
22–23
Data Spaces
B-DC 221
Computation in Design 3
22–23
Data Spaces
B-DC 221
Computation in Design 3
Datareportal, 2022, Daily time spent using the Internet. link

22–23
Data Spaces
B-DC 221
Computation in Design 3
Datareportal, 2022, Daily time spent using the Internet. link

22–23
Data Spaces
B-DC 221
Computation in Design 3
Finding Correlations –– data via Datareportal, 2022, Daily time spent using the Internet. link


Mobile Speed
Daily Internet Use
22–23
Data Spaces
B-DC 221
Computation in Design 3


Data from the James Webb Space Telescope. Does space really look like this, do we trust that gigantic sensing device out there? It looks beautiful though.
22–23
Data Spaces
B-DC 221
Computation in Design 3
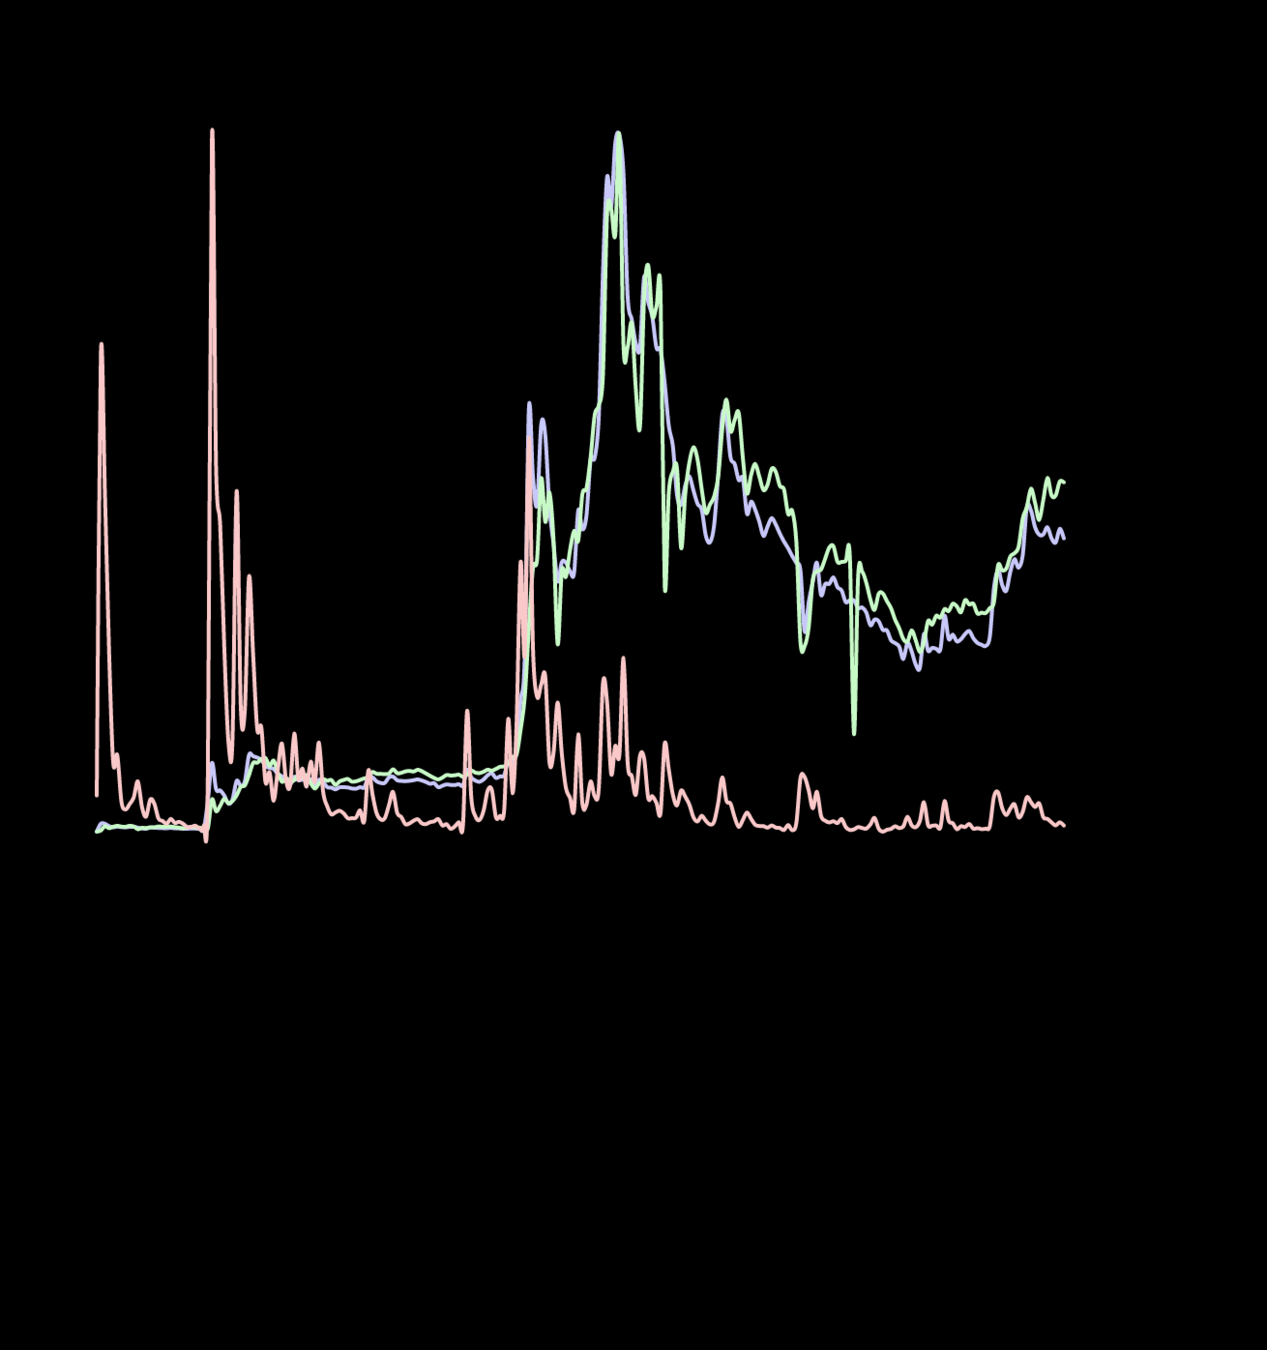
Time reconstructions (blue) and instrumental data (red) for Northern Hemisphere mean temperature (NH). link

The Hockey Stick
Michael Mann is most famously known for the "hockey stick," a plot of the past millennium's temperature that shows the drastic influence of humans in the 20th century. Specifically, temperature remains essentially flat until about 1900, then shoots up, like the upturned blade of a hockey stick.
That stick has become a focal point in the controversy surrounding climate change and what to do about it. Proponents see it as a clear indicator that humans are warming the globe; skeptics argue that the climate is undergoing a natural fluctuation not unlike those in eras past. But Mann has not been deterred by the attacks. "If we allowed that sort of thing to stop us from progressing in science, that would be a very frightening world"
Behind the Hockey Stick in Scientific American, 2005. link
22–23
Data Spaces
B-DC 221
Computation in Design 3
Time reconstructions (blue) and instrumental data (red) for Northern Hemisphere mean temperature (NH). link

The Hockey Stick
Michael Mann is most famously known for the "hockey stick," a plot of the past millennium's temperature that shows the drastic influence of humans in the 20th century. Specifically, temperature remains essentially flat until about 1900, then shoots up, like the upturned blade of a hockey stick.
That stick has become a focal point in the controversy surrounding climate change and what to do about it. Proponents see it as a clear indicator that humans are warming the globe; skeptics argue that the climate is undergoing a natural fluctuation not unlike those in eras past. But Mann has not been deterred by the attacks. "If we allowed that sort of thing to stop us from progressing in science, that would be a very frightening world"
Behind the Hockey Stick in Scientific American, 2005. link
22–23
Data Spaces
B-DC 221
Computation in Design 3
99% of Sea Turtles are now born female.
Global warming is creating a crisis in sea turtles' gender ratios, where 99% of them are being born female. Sea turtle populations have been facing a significant population decline further exasperated by climate change.
Climate change is affecting the gender balance of sea turtles.
Rising temperatures over the past four years in Florida have led to a disproportionate number of female sea turtles to be hatched, perhaps as many as 99% of the total eggs laid. Unlike many animals, the sex of a sea turtle isn’t determined when the egg is fertilized. Instead, whether you get a male or female all depends on the temperature of the ground the eggs incubate in.
If it stays below 81.86 degrees Fahrenheit, they’ll be male, says the National Oceanic and Atmospheric Administration (NOAA). Anything above 88.8 degrees and they’re female. (If the sand temps hover between those two ranges, it’s a mix of genders for the eggs.)
Fortune.com, August 2022. link
22–23
Data Spaces
B-DC 221
Computation in Design 3
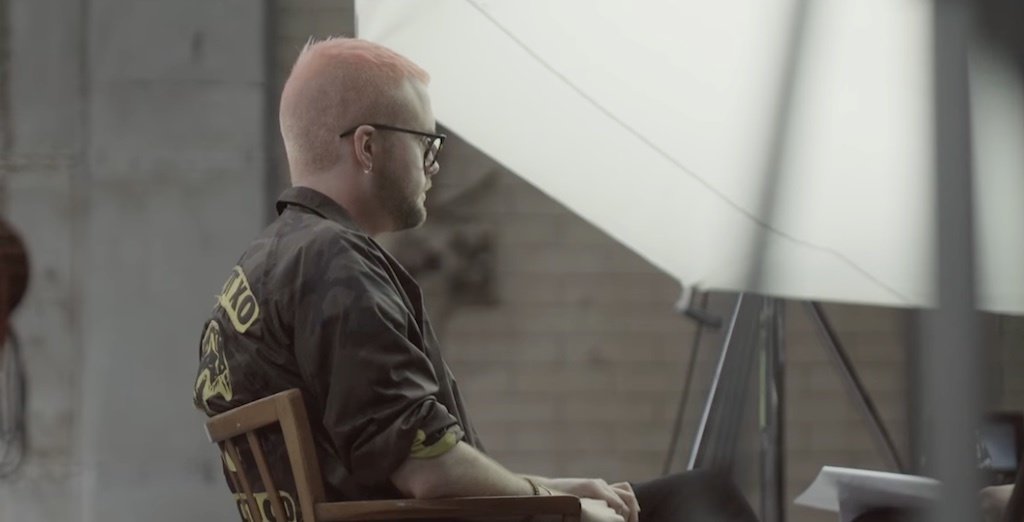
Cambridge Analytica Scandal
Revealed: 50 million Facebook profiles harvested for Cambridge Analytica in major data breach. Whistleblower describes how firm linked to former Trump adviser Steve Bannon compiled user data to target American voters
via The Guardian, The Cambridge Analytica Files, March 2018 link
A whistleblower has revealed to the Observer how Cambridge Analytica used personal information taken without authorisation in early 2014 to build a system that could profile individual US voters, in order to target them with personalised political advertisements.
Christopher Wylie, who worked with a Cambridge University academic to obtain the data, told the Observer: “We exploited Facebook to harvest millions of people’s profiles. And built models to exploit what we knew about them and target their inner demons. That was the basis the entire company was built on.”

22–23
Data Spaces
B-DC 221
Computation in Design 3
Your Data Mirror
This portal is a starting point to learn about the mechanisms of data collection and the impact it can have on society. Find out how you can protect yourself and others from manipulation - and strengthen democracy in the process!
Digitalisation and social media have fundamentally changed our lives.
Never before has knowledge been so widely available. Through our smartphones the wider world lies in our palms. We communicate with, and impact each other with a swipe or a click - globally across great distances.
And yet, these same technologies that connect us are also driving us apart, fuelling division and mistrust. People are being presented with so much information and at such incredible speed, and have, quite worryingly, started questioning even basic facts that are presented by reliable news sources. Many people, perhaps more than ever, believe that what they feel is “the truth”, rather than fact-checking information from various angles and coming to informed decisions.

22–23
Data Spaces
B-DC 221
Computation in Design 3
Social Media
Lobo spiegel article

Serendipity
The expectation to find something somehow interesting without looking for it.
In the 21st century, serendipity is the digital form of curiosity in the literal sense of the word: the craving for something new–with a twist that has become crucial due to the content overload of the Internet. New is not enough, it has to be new and interesting for the respective person, because actually nothing is more individual than the satisfaction of curiosity. The TikTok algorithm is currently by far the best at satisfying digital curiosity.
"if I only want to look at it for two minutes and then sit in front of it for an hour. That's really absurd."
22–23
Data Spaces
B-DC 221
Computation in Design 3
Singapore: Southeast Asia's testbed for smart city solutions. Singapore is en route to becoming the world’s first Smart Nation. What does this mean for companies and how can they leverage this opportunity? link to edb.gov.sg article
Smart Cities (Singapore)

22–23
Data Spaces
B-DC 221
Computation in Design 3
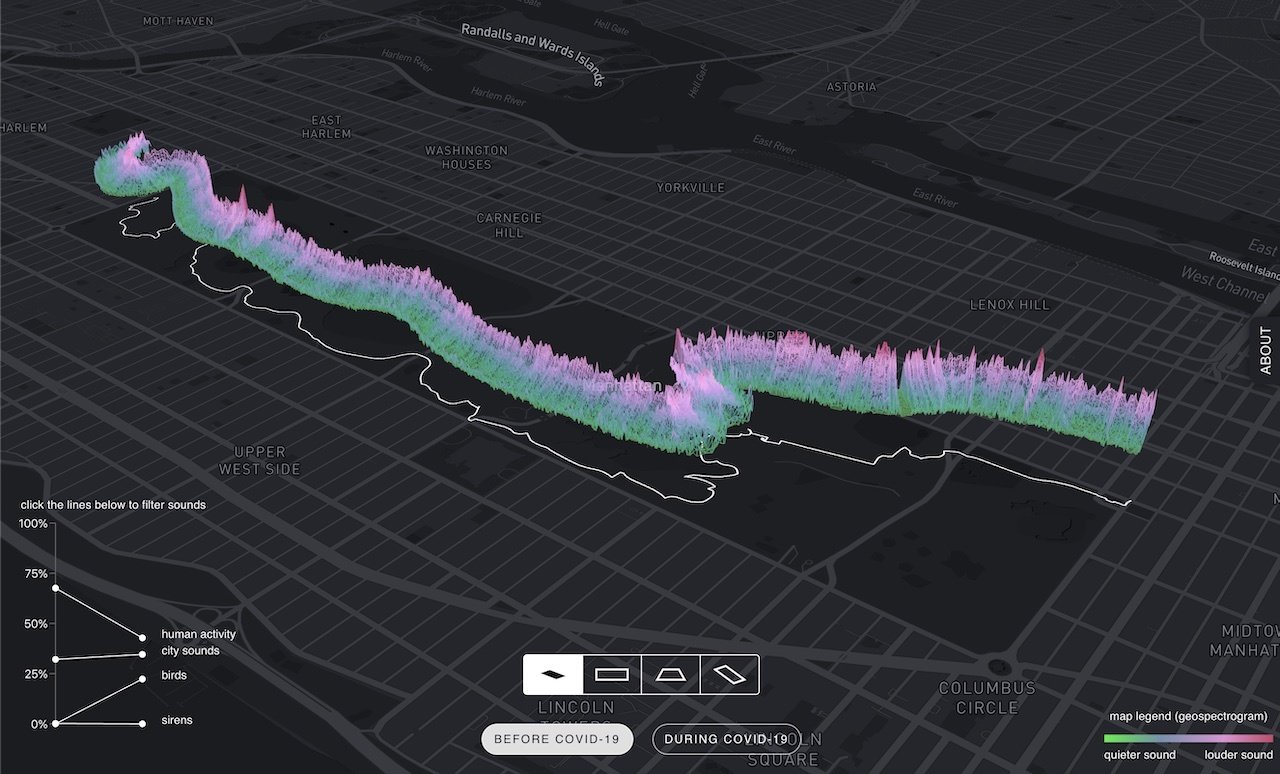
The Senseable City Laboratory is a research initiative at the Massachusetts Institute of Technology (MIT) that looks at the transformation of cities through design, science and data. website link
Senseable Lab
22–23
Data Spaces
B-DC 221
Computation in Design 3
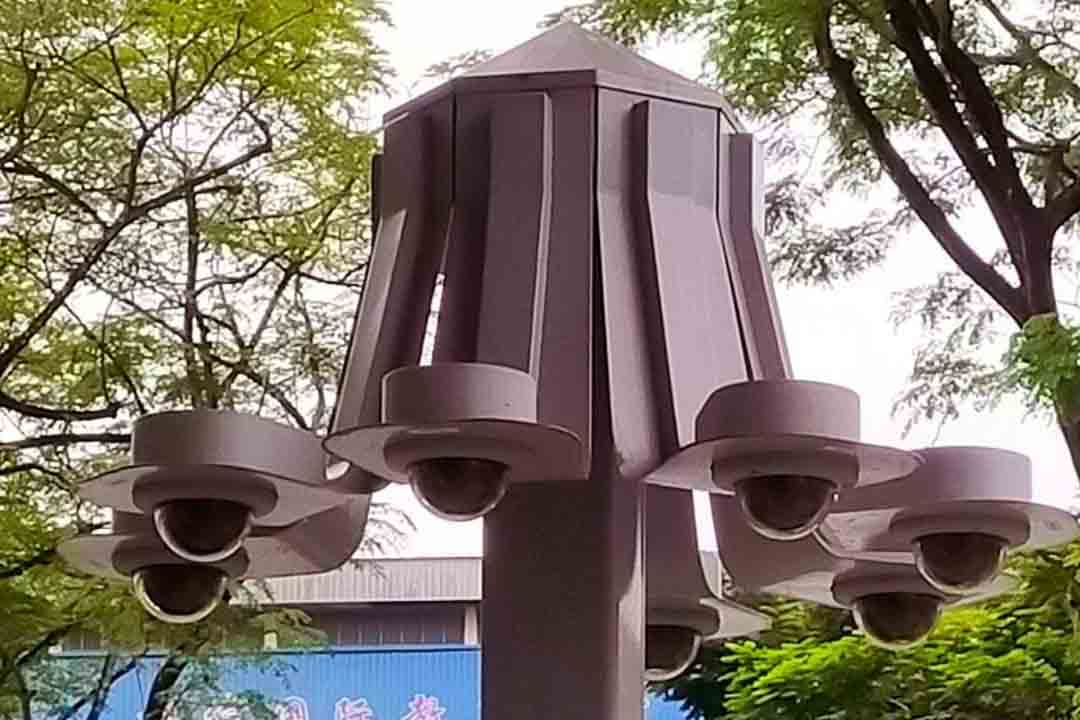
How to automate Surveillance easily with Deep Learning, link

CCTV Object Recognition with AI
22–23
Data Spaces
B-DC 221
Computation in Design 3
Multi-label image dataset (Tencent ML Images), contains nearly 18 million images, multi-labeled with up to 11,166 categories.

Labeled image datasets
In machine learning, the algorithm is fed large data sets, many of which are images. These images have been labeled and classified so that the algorithm can find patterns and similarities in the input images that it is not aware of at first. This is basically how many machine learning algorithms work. They are trained on large data sets, these data entries are then broken down into smaller fragments and patterns so that the algorithm can recognize input images that it has not seen or known before. Similar approaches are applied to audio and other sensor-data.
22–23
Data Spaces
B-DC 221
Computation in Design 3
AI anatomy map
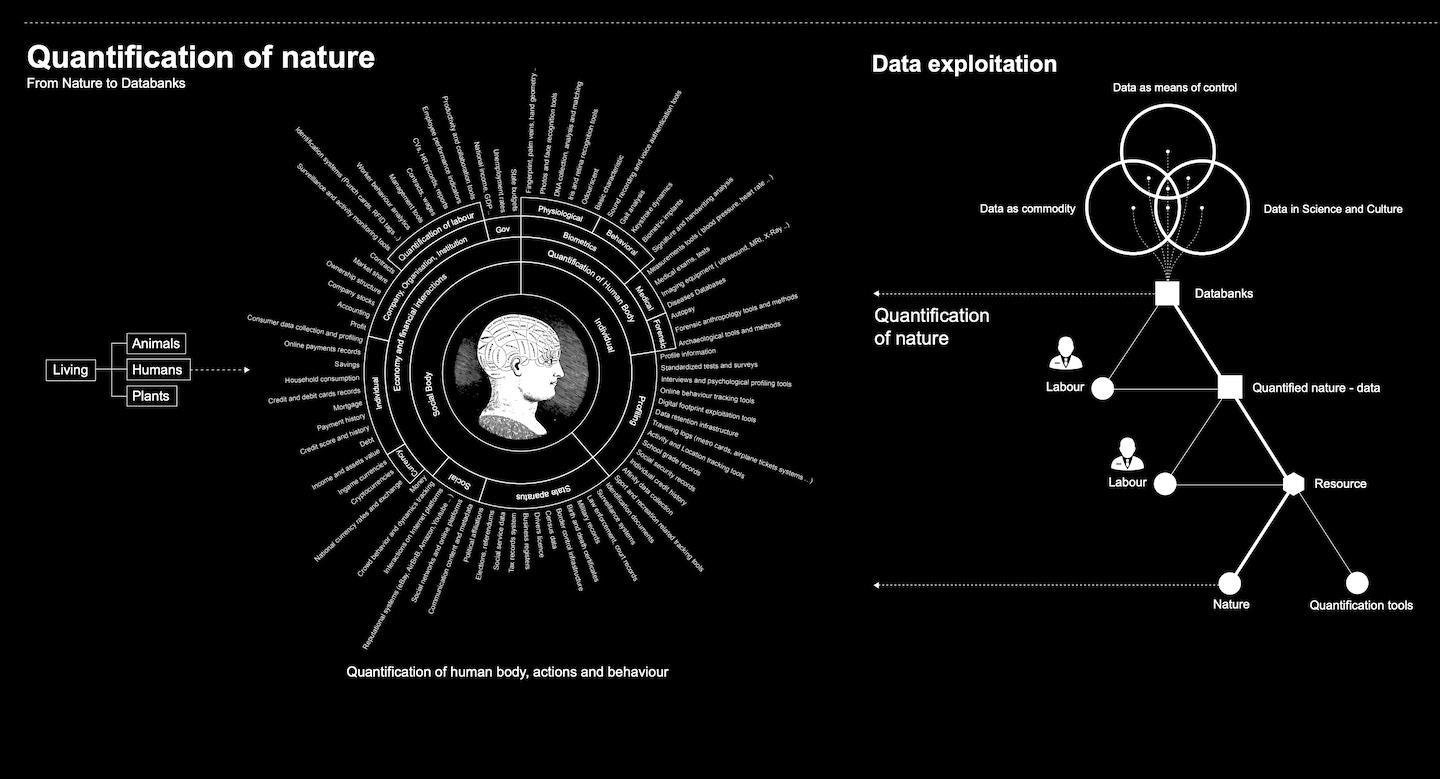
Anatomy of an AI system
Kate Crawford and Vladan Joler, 2018
An anatomical case study of the Amazon echo as an artificial intelligence system made of human labor. Zoom into this map via the pdf version.

Amazon Echo smart speaker
AI system powering Amazon Echo smart speaker
22–23
Data Spaces
B-DC 221
Computation in Design 3
AI anatomy map
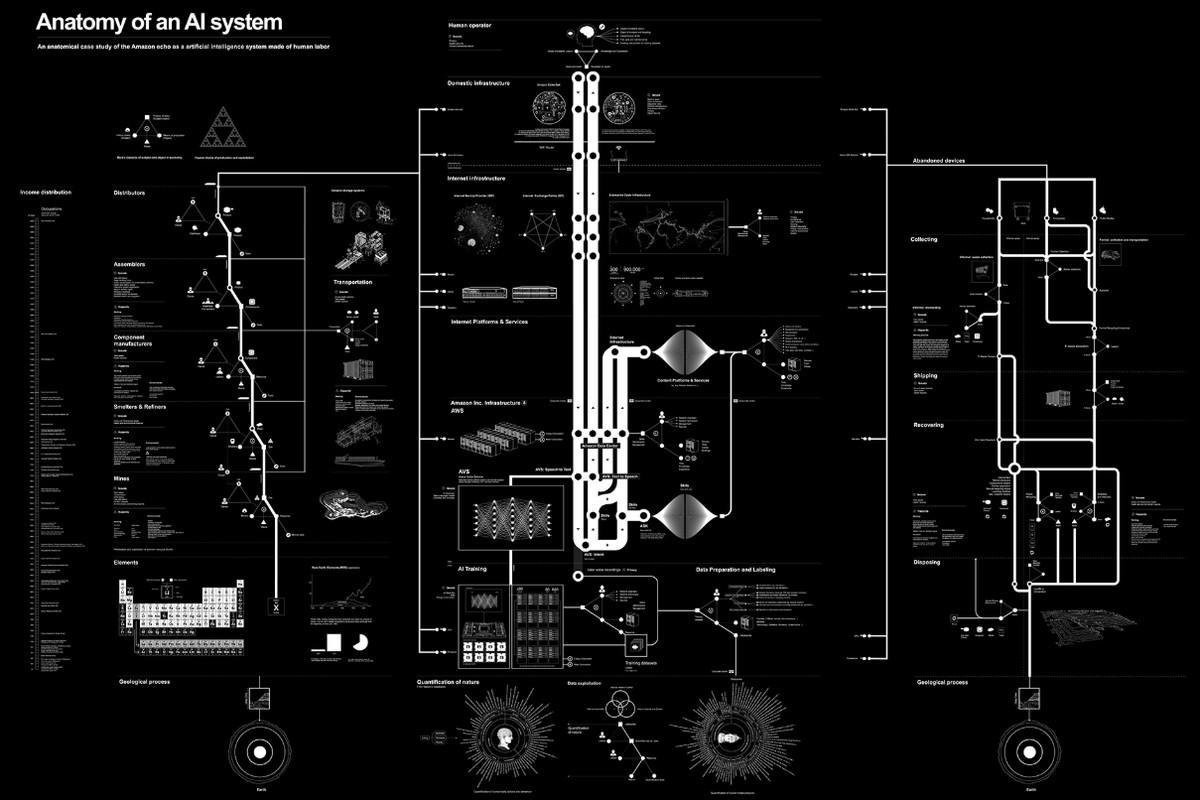
Anatomy of an AI system
Kate Crawford and Vladan Joler, 2018
An anatomical case study of the Amazon echo as a artficial intelligence system made of human labor. Zoom into this map via the pdf version.

22–23
Data Spaces
B-DC 221
Computation in Design 3
The Age of Data is an anthology of genre-redefining data-based art, featuring 40 artists, designers and studios.

Refik Anadol in The Age of Data
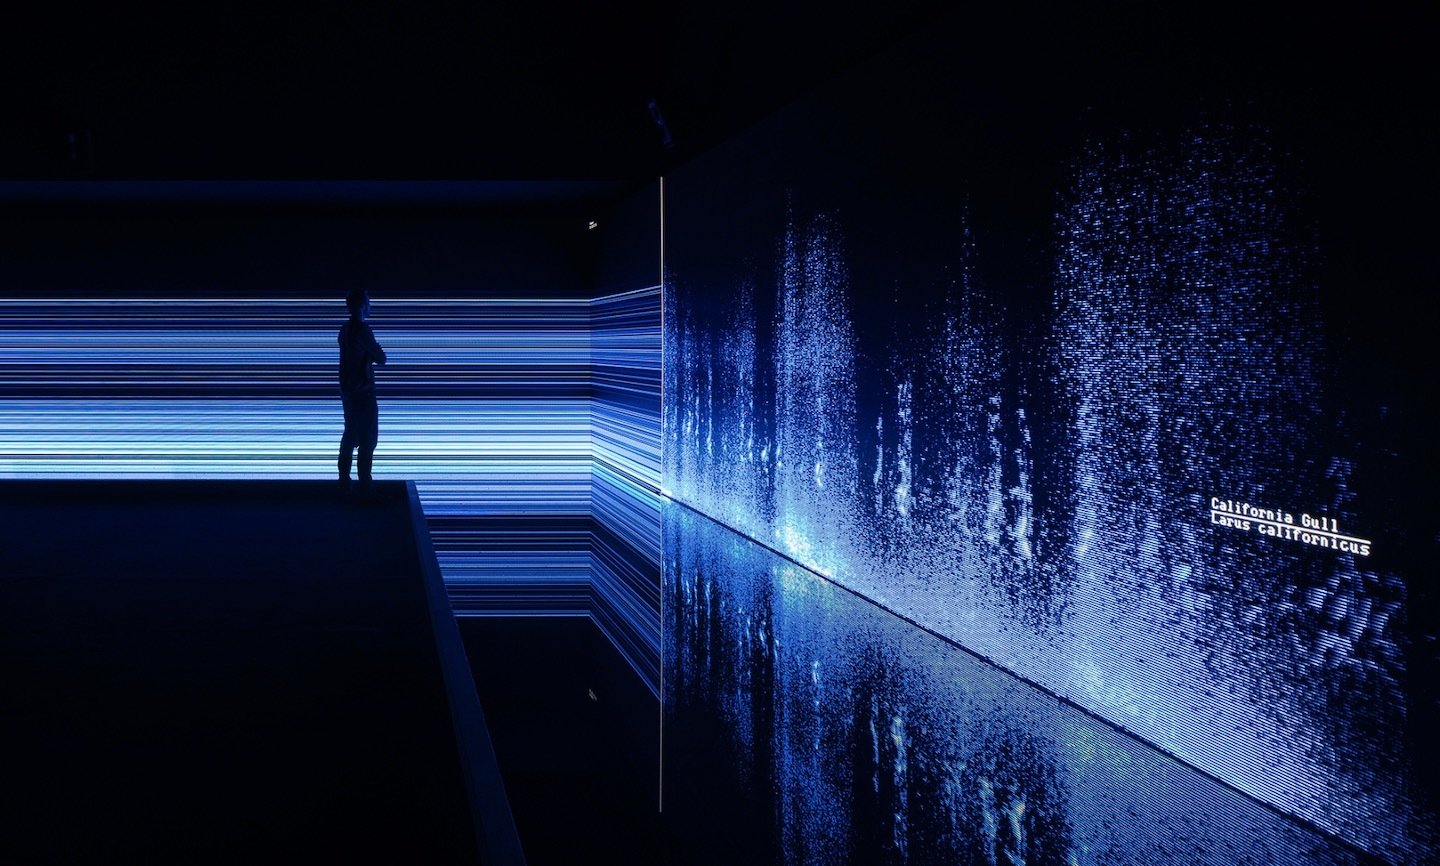
Anadol works is site-specific public art, creating live audio/visual performances and immersive AI cinema installations with a parametric data sculpture approach. His work explores the space between digital and physical entities by generating a hybrid relationship between architecture and media arts with machine intelligence.
The systems, the hardware, the software around us is constantly changing, and the data becomes a new language between machines. But as humans, I think we have to learn this language as well.
in The Age of Data: Embracing Algorithms in Art & Design, 2022. link
22–23
Data Spaces
B-DC 221
Computation in Design 3

Pladis : Data Universe, by Refik Anadol, is an immersive environment project by Refik Anadol. Project is an integral part of artist’s ongoing ‘Temporary Immersive Environment Experiments’ which is a research on audio/visual installations by using the state called immersion which is the state of consciousness where an immersant’s awareness of physical self is transformed by being surrounded in an engrossing environment; often artificial, creating a perception of presence in a non-physical world.
Pladis : Data Universe, by Refik Anadol
22–23
Data Spaces
B-DC 221
Computation in Design 3
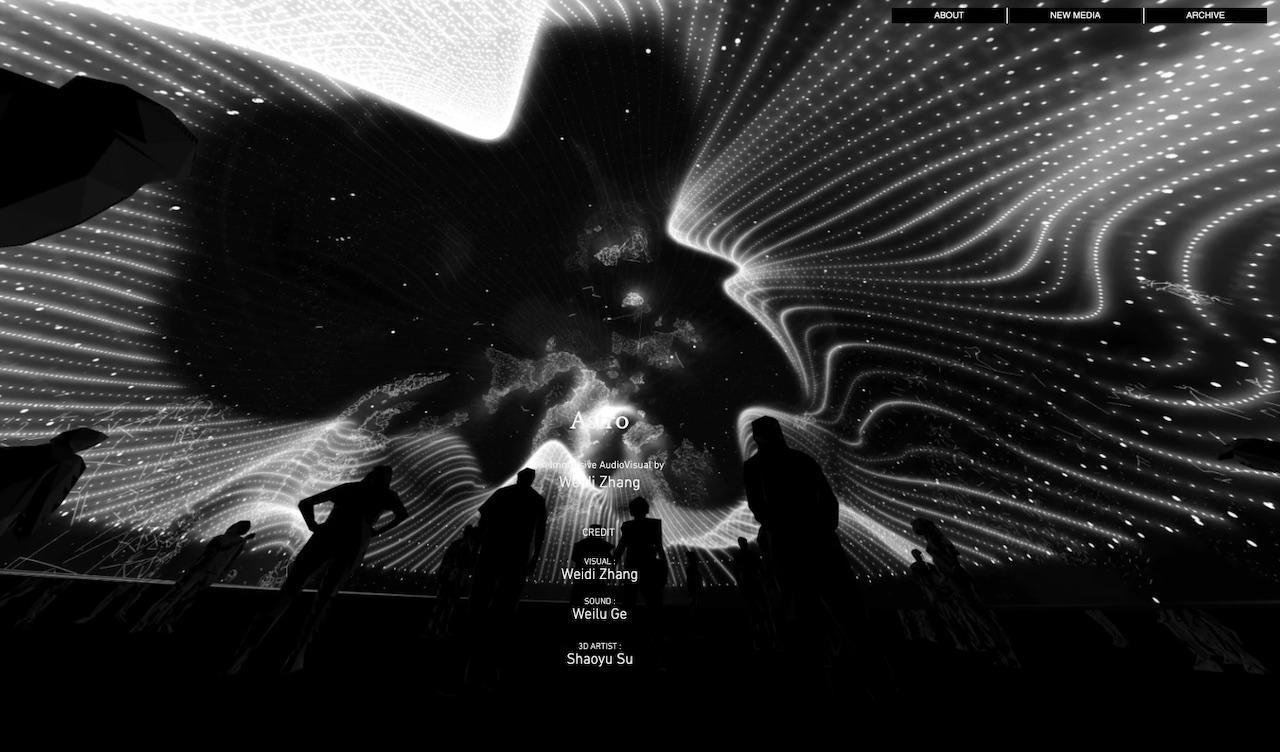
Weidi Zhang, astro. An immersive full-dome performance, and a projection on a facade as an extension of space. link
22–23
Data Spaces
B-DC 221
Computation in Design 3
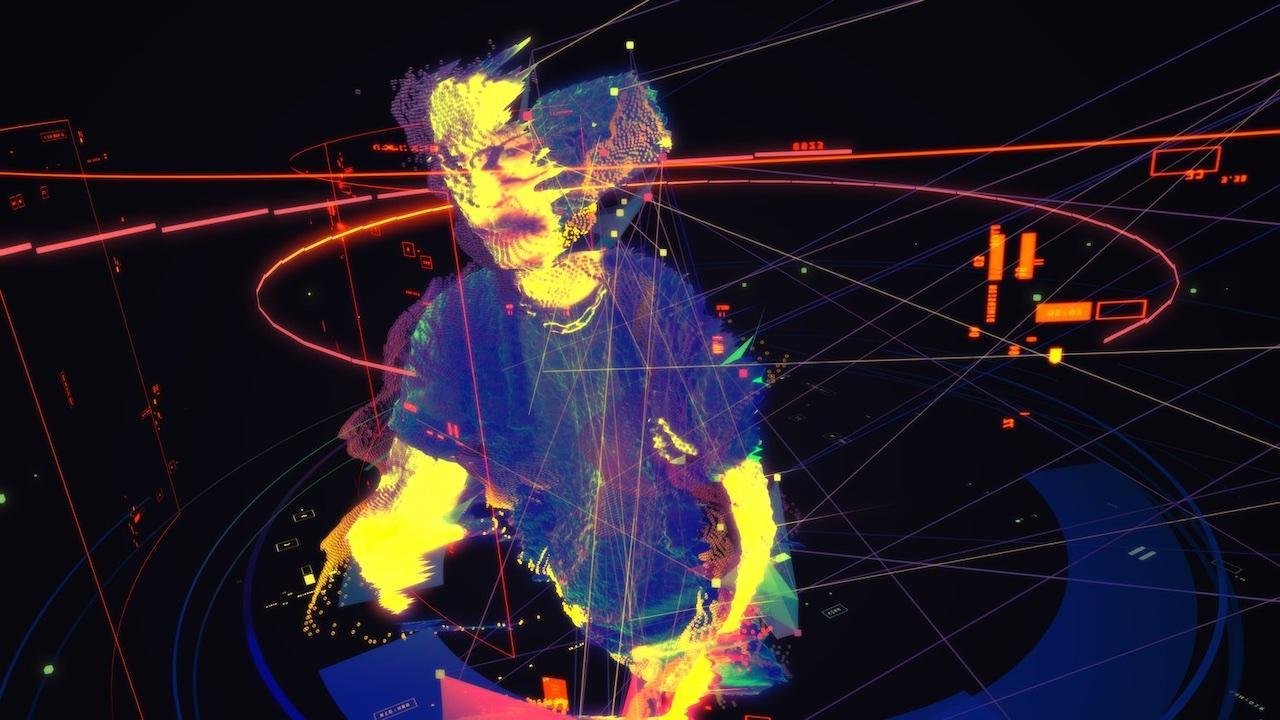
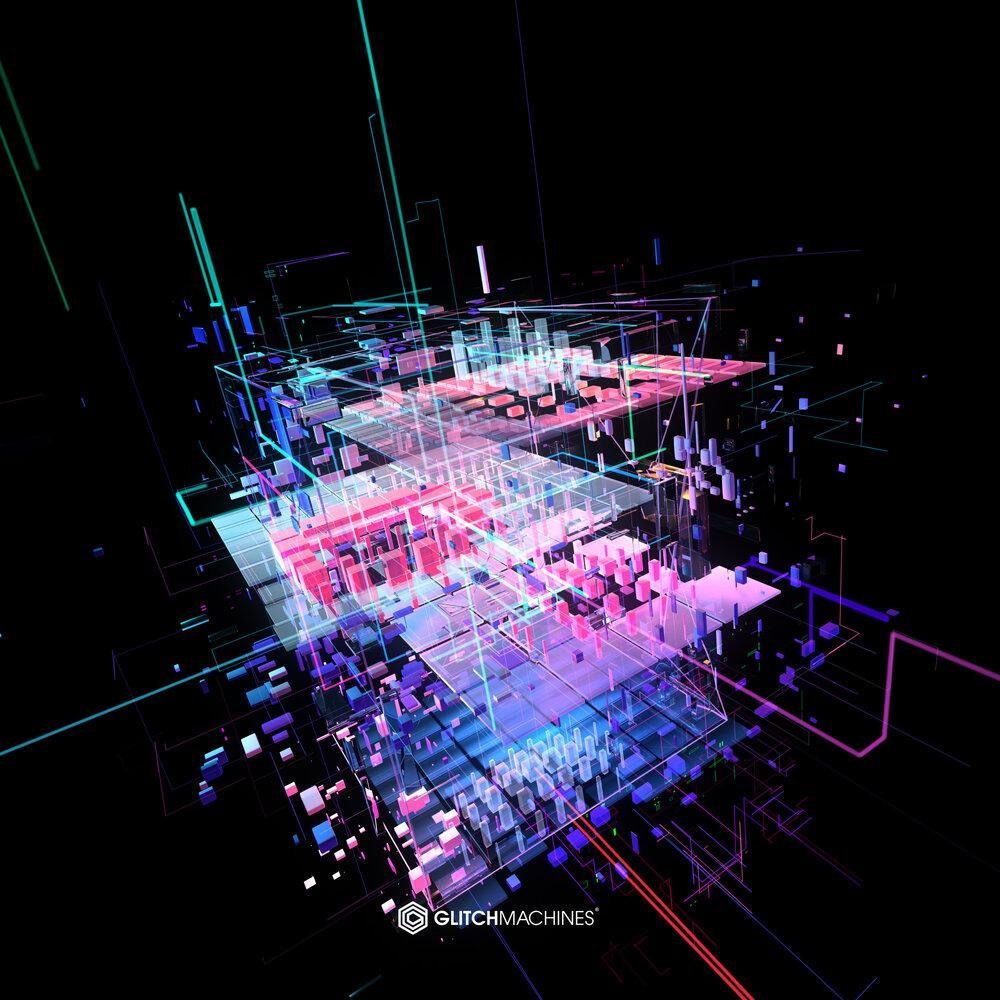
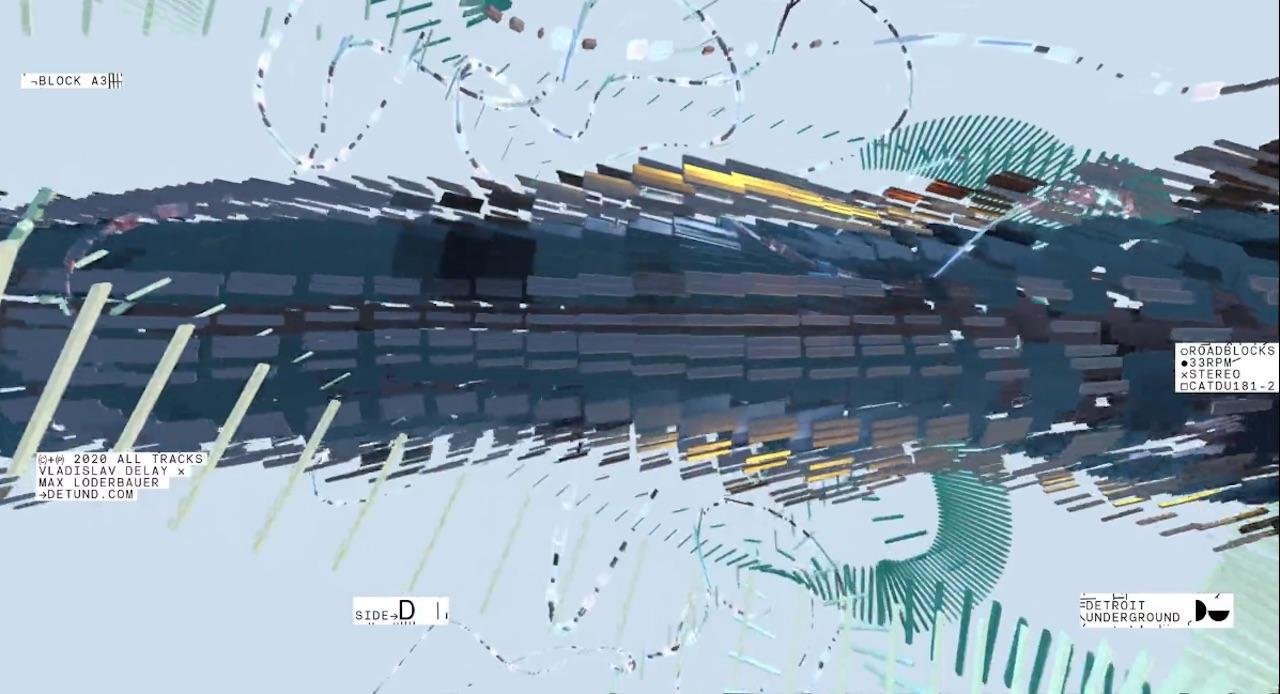
Defasten, motion visual works where visual aesthetic exists as audio reactive, hyper3d real-time graphics, from deconstructed cyberspaces, to retinal virtual experiences. link

22–23
Data Spaces
B-DC 221
Computation in Design 3

22–23
Data Spaces
B-DC 221
Computation in Design 3
Translating numbers into visual formats, data visualisations.
Federica Fragapane
22–23
Data Spaces
B-DC 221
Computation in Design 3
Translating numbers into visual formats, data drawings.
Stefanie Posavec and Giorgia Lupi

Dear Data
Dear Data is a year-long, analogue data drawing project between Stefanie Posavec and Giorgia Lupi, an information designer based in New York.
22–23
Data Spaces
B-DC 221
Computation in Design 3
Dear Data
Dear Data is a year-long, analogue data drawing project between Stefanie Posavec and Giorgia Lupi, an information designer based in New York.

22–23
Data Spaces
B-DC 221
Computation in Design 3
Dear Data
Dear Data is a year-long, analogue data drawing project between Stefanie Posavec and Giorgia Lupi, an information designer based in New York.
A week of clocks
Hi Giorgia! Still getting used to drawing again, hope I get better! Lots of the car radio clocks at 4am are because I had to leave too early to fly back from holiday! Other insights I've learned: I'm addicted to my phone I always check the time in bed even before the alarm goes off hence the 5am clock-watching! I obviously am an early riser :)


22–23
Data Spaces
B-DC 221
Computation in Design 3
Air Transformed. Translating numbers into visual formats, physical objects, data physicalisations.

Data Physicalisation
Data physicalisations or physical visualisations are data-driven physical artefacts. They are the physical counterparts of data visualisations. Such artefacts may involve the use of computers, either to fabricate them or to actuate them. A closely related term is physical data sculpture.
Stefanie Posavec, Air Transformed, Necklace link
22–23
Data Spaces
B-DC 221
Computation in Design 3
The Future is Red, Yoon Chung Han, 2021.
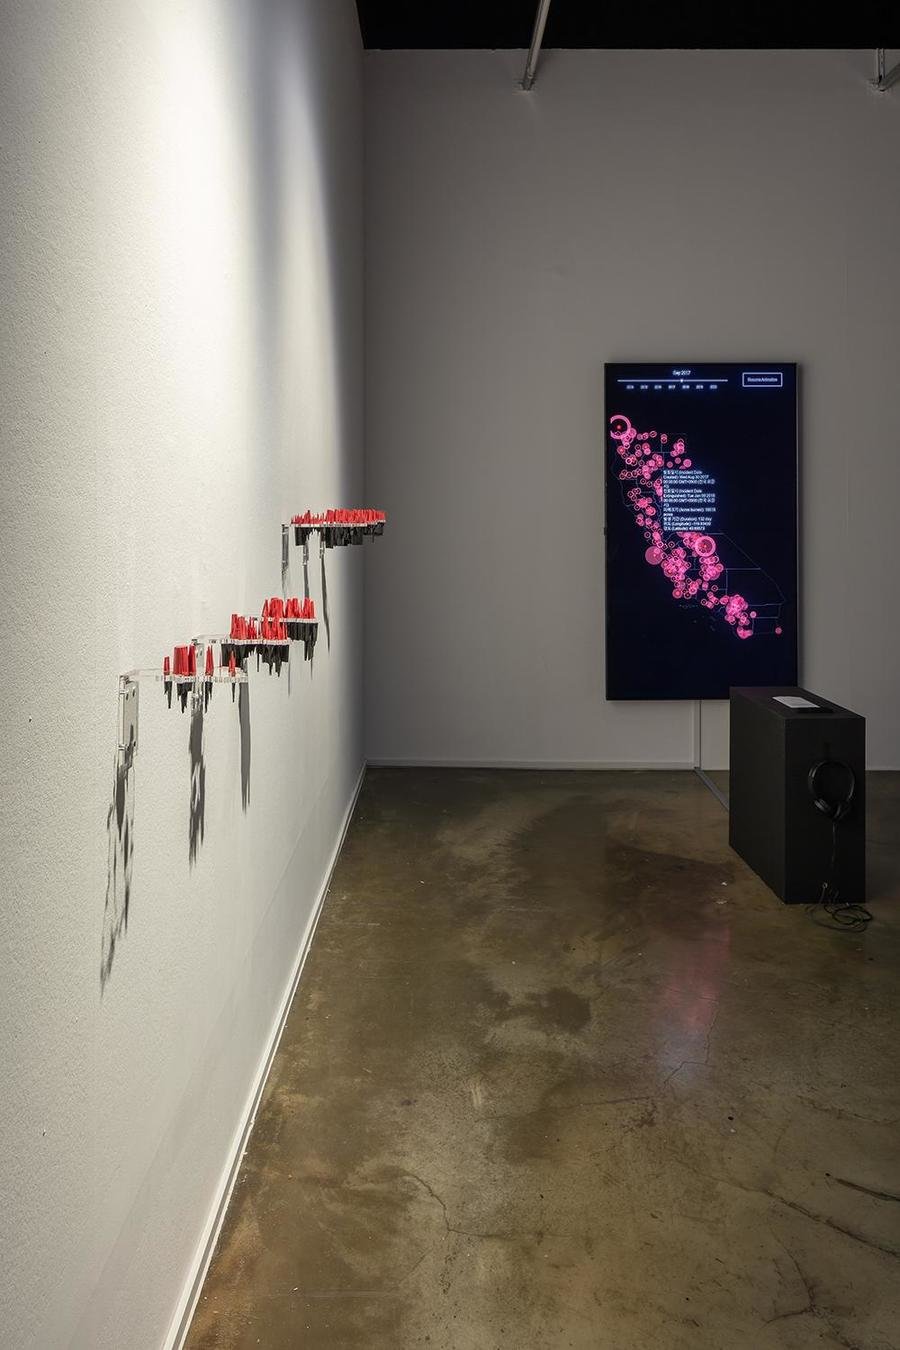
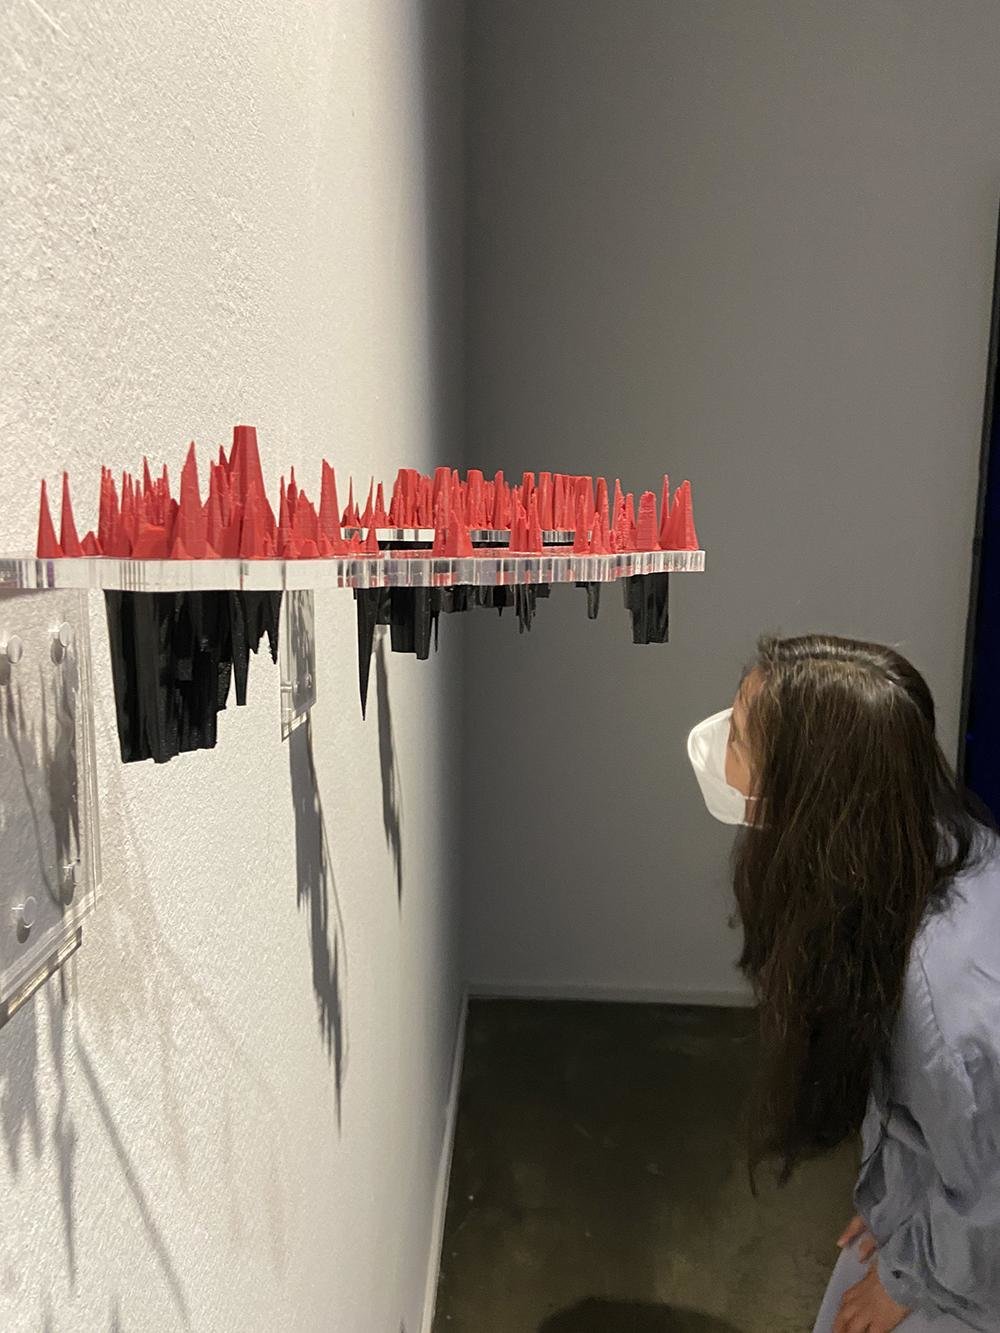
The Future is Red
Yoon Chung Han, 2021. Interactive art, Data-driven design. Tools: D3.js, 3D printing
The Future is Red is a data art installation that provides an interactive audiovisual experience to reveal the reality of climate change to audiences. Audiences can participate in this interactive art that presents two regions' wildfire data in visual and audio forms.
The audience members can learn about the wildfire and related damages in detail by observing 3D printed sculptures made of recycled filaments. Red-colored prints represent the wildfires and black-colored prints attached at the bottom represent the air quality of two regions. Viewers can observe a correlation between two data and the causes and effects of wildfire.
22–23
Data Spaces
B-DC 221
Computation in Design 3
Joy Division, Album cover, Unknown Pleasures, 1979.


Binaural by Daniel Widrig & Shajay Bhooshan, 2007.
Reflection is a sound data sculpture by Andreas Fischer, 2007, link
22–23
Data Spaces
B-DC 221
Computation in Design 3
Zimoun
Listening to Wood
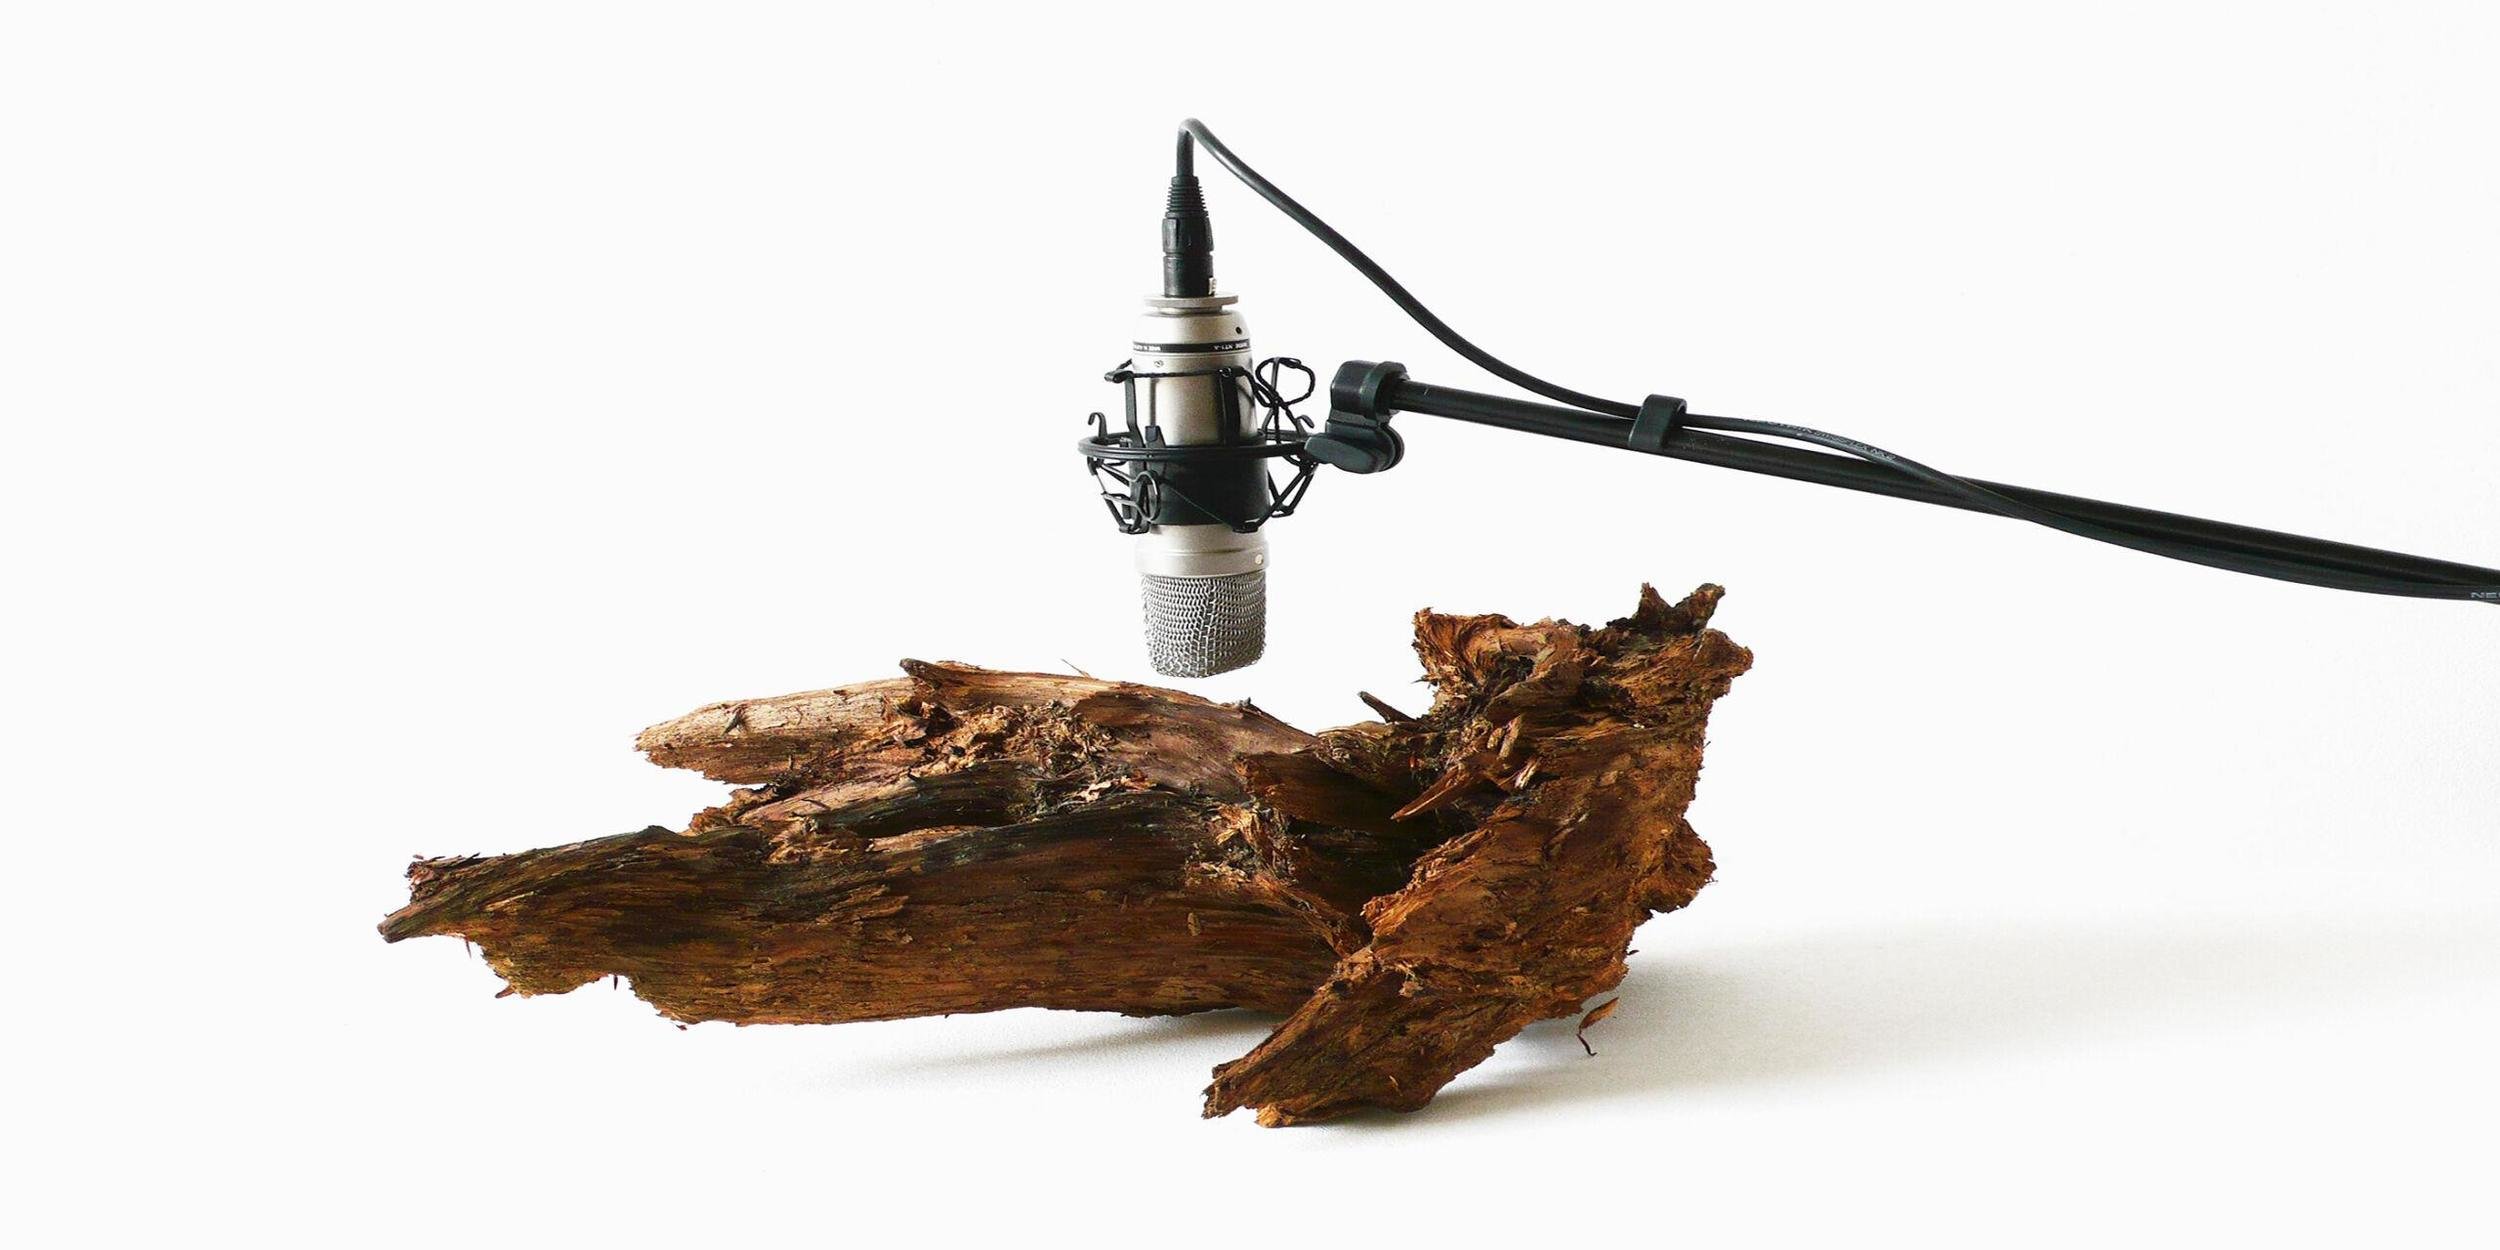
25 Woodworms
The kinetic-minimalist sound artist Zimoun’s video 25 Woodworms, Wood, Microphone, Sound System (2009) takes the sounds made by live woodworms at work as a starting point for the creation of an atonal, minimalist soundscape. A microphone mounted above a piece of bark amplifies the gnawing noises of the 25 woodworms enclosed in it, making these audible to the human ear.
The working woodworms become data by sensing and amplifying the sounds they emit. The data can be translated into the format of sounds itself or into visual representations like animations, or even physical objects.
22–23
Data Spaces
B-DC 221
Computation in Design 3


'Walk walk dance' is an interactive pathway of lines that trigger different musical patterns, transforming the act of walking (or waiting in line) into a collaborative performance. link
'Interface' by Jose Chavarría is an exploration on how to change the human perception of reality. 'Infrared Interface' senses other living creatures by sensing the infrared emission of bodies. Blurred vision allows the user to switch their attention to the new sense. Different infrared temperatures are felt by the user through pressure pads located on the cheeks. link
22–23
Data Spaces
B-DC 221
Computation in Design 3

Acoustic Territories
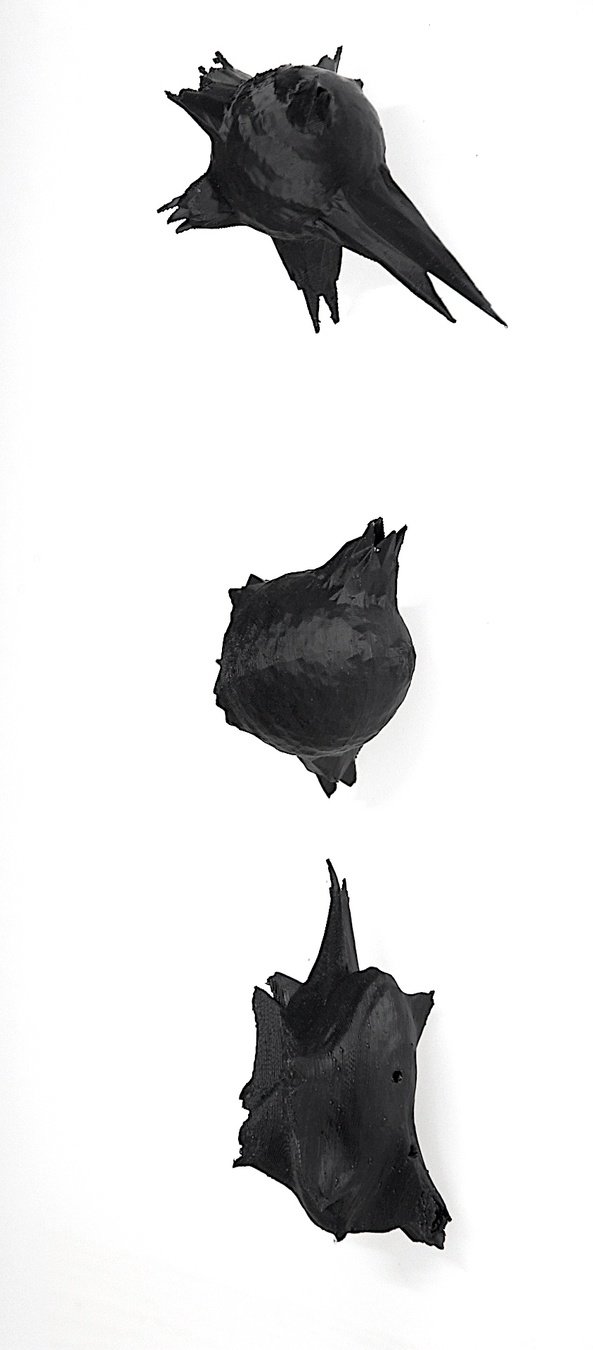
by Ong Kian Peng, for the Urban Explorations project Paris, 2015
'I took several metro rides during my fieldwork that sparked my interest in sonic representations of spaces. Deviating from how spaces can be conduits of emotional landscapes, I am allured by how sound is propagated in space'
Kian Peng used recorded sounds captured with the use of his custom-built device to create a dataset of sounds that he later analysed and used to algorithmically shape 3D-printed objects as representations of visited and recorded spaces.

Acoustic Territories, a custom-built sound recording device to capture sound intensity at various urban locations.
Data Spaces
22–23
Data Spaces
B-DC 221
Computation in Design 3
Data Spaces is a project that invites students to look at data from different angles and explore how data can be creatively gathered, quantified, experienced, and presented in physical and digital spaces.
2
22–23
Data Spaces
B-DC 221
Computation in Design 3


Gathering and Quantifying Data
Collecting
Sampling
Counting
Recording
Probing
Measuring
Analysing
Input
22–23
Data Spaces
B-DC 221
Computation in Design 3
Experiencing and presenting Data
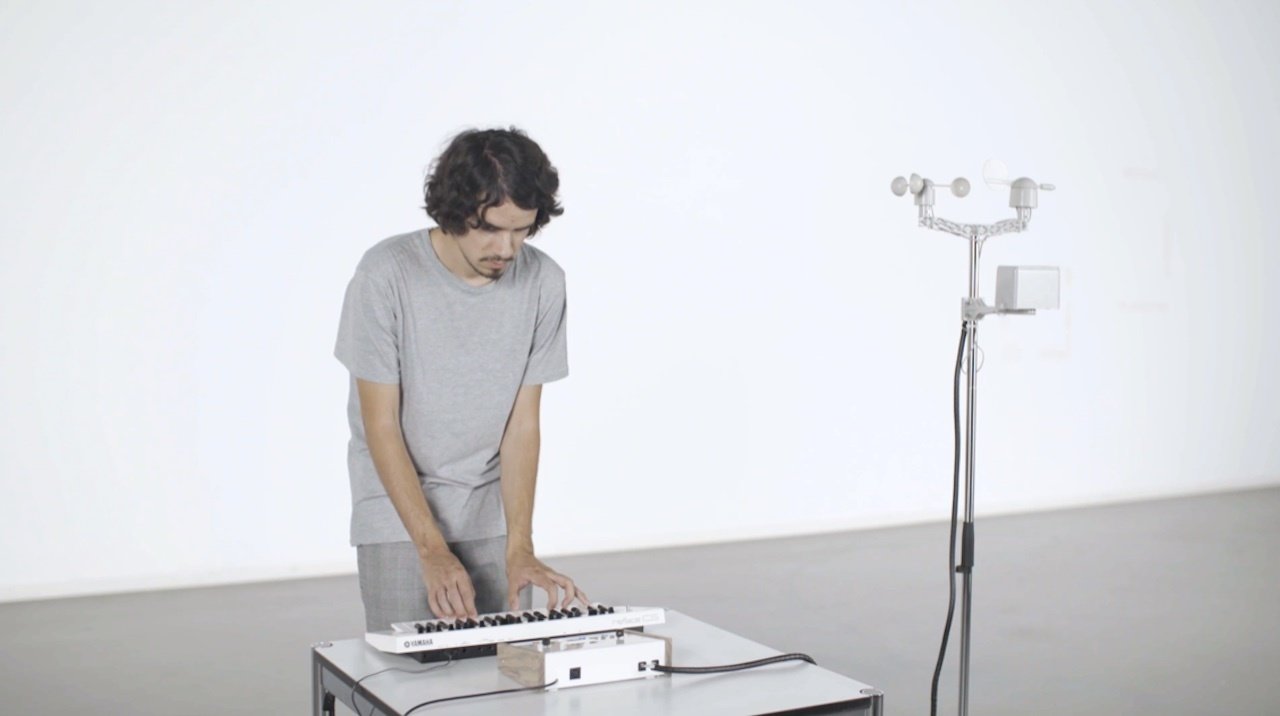
We can experience data by creating artefacts that represent or embody data. This can be achieved through printed materials, physical objects, interactivity or immersion.
Output
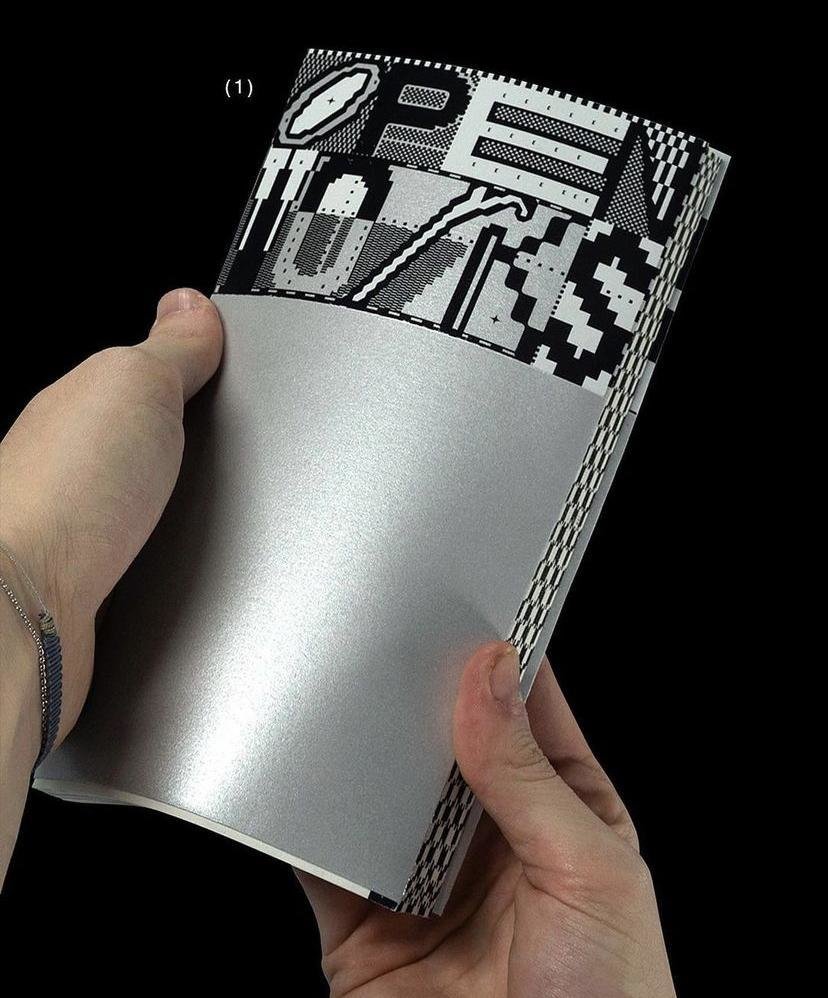



Data Spaces
22–23
Data Spaces
B-DC 221
Computation in Design 3
In this class and over the course of this semester we will look at different forms of data and ways to give form to data. We want to apply different methods when collecting, analysing and expressing data.
3
We can do so through digital means like software tools, digital devices or code, but also through analog means such as measuring, counting, sampling, drawing or using craft.
22–23
Data Spaces
B-DC 221
Computation in Design 3
Warm-up activities
In a series of warm-up activities, students playfully engage with numbers, datasets, and data spaces.
Week 1, 2, 6
Urban Fieldworks
Students work in small teams where they collect and translate data into an artefact.
Week 3–5
Project
Students choose from a list of Data Spaces topics to develop a self-directed project which they showcase at the end of the semester.
Week 7, 9–13
Data Spaces
22–23
Data Spaces
B-DC 221
Computation in Design 3
When you show all these pictures and projects and so on, do you want us to create the same things, with the same complexity and quality? Actually I don't like all this tech and data stuff and numbers so much, what do I do?
Questions?
4
Do I have to code for this class?
22–23
Data Spaces
B-DC 221
Computation in Design 3
Oh, that would be wonderful. It depends to what extent. However, it's a great opportunity to practice and build on your coding skills. Can you use existing code that you can build on? Do you want to write your own code? The code can be very simple, playful, experimental, or a tool to help you understand, express, and represent data visually.
1
No code
Low code
Some code
All code
You pick, but don't shy away from it.
Coding Spectrum
22–23
Data Spaces
B-DC 221
Computation in Design 3
No Code
Requires few to no code to quickly build an application. This doesn't mean there is no code involved, the code just all runs in the background. Often purely UI, pull-down and drag-and-drop based.
Similar to NoCode, however, some code is exposed in the application building environment you are using. Although often related to visual programming environments, a basic understanding of coding concepts is useful.
Cargo
Readymag
Webflow
Figma
Prompting
Limited to the tool
Some customisation possible
Some coding skills required
Build your own
Wordpress
Unreal Engine
TouchDesigner
html, css, JavaScript
Coding frameworks (p5js)
Python
Scripting
Unity
Text Editor
Any programming language
Command Line
Git
Knowing and understanding some code as a designer can help you collaborate better and communicate across disciplines when technical know-how is required. Basic knowledge and practice in web or app development.
This is when you are able to build your own software with ease. Needless to say this needs time and practice.
Low Code
Some Code
All Code
What are we learning?
22–23
Data Spaces
B-DC 221
Computation in Design 3
We will begin with visual exercises that will then incrementally grow in duration over time, and will culminate in a self-directed project. Here you will practice to work on briefs over shorter and then longer timespans.
2
All activities will revolve around the theme of data applied in different contexts and spaces. Here you will learn and need to generate, select, and synthesise ideas that can then translate into presentable visual outcomes.
Time management
Independent and self-directed learning and working
Collaboration
Apply technical skills
Develop and contextualise ideas
Communicate visually
How are we learning?
22–23
Data Spaces
B-DC 221
Computation in Design 3
3
In the briefs you will be given, you will be asked to learn more independently, make choices and to develop and implement your own ideas on a given topic. The implementation here leaves room for interpretation and challenges you to apply different computational techniques through digital or physical means.
Approach
22–23
Data Spaces
B-DC 221
Computation in Design 3
The approach we are taking in this class is to start with a more fragmented approach, like a puzzle, and then put the pieces we have learned together into a deliverable that brings together the various activities we have undergone and completed at the end of the semester.
1
Explore
Ideate
Make
Test
Share
22–23
Weekly Schedule
We will meet on a weekly basis every Thursdays at 2.30 in C501. For a breakdown of the weekly schedule, navigate downwards.
Data Spaces
B-DC 221
Computation in Design 3
22–23
Data and numbers
1
Datasets, collecting data
2
Urban Fieldworks 1
3
Urban Fieldworks 2
4
Introduction to the class and the data spaces topic, followed by warm-up activities centred around the visual representation of numbers.
In a series of activities, numbers are collected and organised into a data set, then visualised in multiple charts.
Urban Fieldworks is an exercise that explores the ordinary happenings and encounters in an urban landscape through the gathering and presentation of data.
In this session, we will review the data collected on your field trips to discuss with your peers and lecturers to prepare the design of an artefact.
Data Spaces
B-DC 221
Computation in Design 3
Weekly Schedule
Exercise 1
Exercise 2
Exercise 3
Exercise 3 continues
22–23
Urban Fieldworks 3
5
Data Spaces
6
Project: briefing Data Spaces
7
Project week
8
Students present their findings together with their artefact to conclude the Urban Fieldworks exercise. Outcomes to be documented in a digital format.
Introduction to the data spaces topic. From a list of data space options, students select and define a starting point and initial interest for their Data Spaces project.
The development of ideas and formulating a concept begins with group discussions, sketches, planning, and feedback to prepare a project proposal based on chosen Data Spaces topic.
no class, but you may want to continue with your project development, go on a field trip, browse the web for data, or train an AI.
Data Spaces
B-DC 221
Computation in Design 3
Weekly Schedule
Exercise 3 concludes
Exercise 4
Project starts
Project: sharing of ideas and experiments
9
Project: consultation
10
Project: development
11
Project: work check
12
Based on your proposal, in a short presentation you will share your ideas and project concept. From the feedback you receive you should be confident to move forward.
We will offer consultation session to review your project development and provide feedback. This is a good opportunity to clarify any questions you may have as you move from the idea phase to the experimentation phase. Ad-hoc workshops possible.
This week will be mostly self-directed and independent study. Your lecturers will be on campus in case you want to receive feedback. You are expected to further develop your experiments. Ad-hoc workshops possible.
To better understand how your work is progressing, we will conduct a work check, do bring all necessary materials to your consultation so we can help you to progress to the next stage of your project, presentation and documentation.
22–23
Data Spaces
B-DC 221
Computation in Design 3
Weekly Schedule
Project: show and tell
13
Independent Study
14
Independent Study
15
22–23
Data Spaces
B-DC 221
Computation in Design 3
Weekly Schedule
This is our last shared session prior to your independent study and submission. We ask that all projects be physically set up and presented so that we can view and discuss them with you.
Work independently on your project, focusing on your documentation and submission preparation. In urgent cases or if you need help, there will be a non-compulsory clinic session during this week.
This week it is best to prepare for submission.
Submission Assessment
16
Introduction to the class and the data spaces topic, followed by warm-up activity centred around the visual representation of numbers.
Data and Numbers
1

22–23
Data Spaces
B-DC 221
Computation in Design 3
22–23
Data Spaces
B-DC 221
Computation in Design 3

What constitutes a number visually?
Activity 1
five
Primitive Shapes, composed by hand.
Generative type, link to code.


22–23
Data Spaces
B-DC 221
Computation in Design 3
Nobert Filep, drawing, pencil on paper.
What constitutes a number visually?
Activity 1

22–23
Data Spaces
B-DC 221
Computation in Design 3
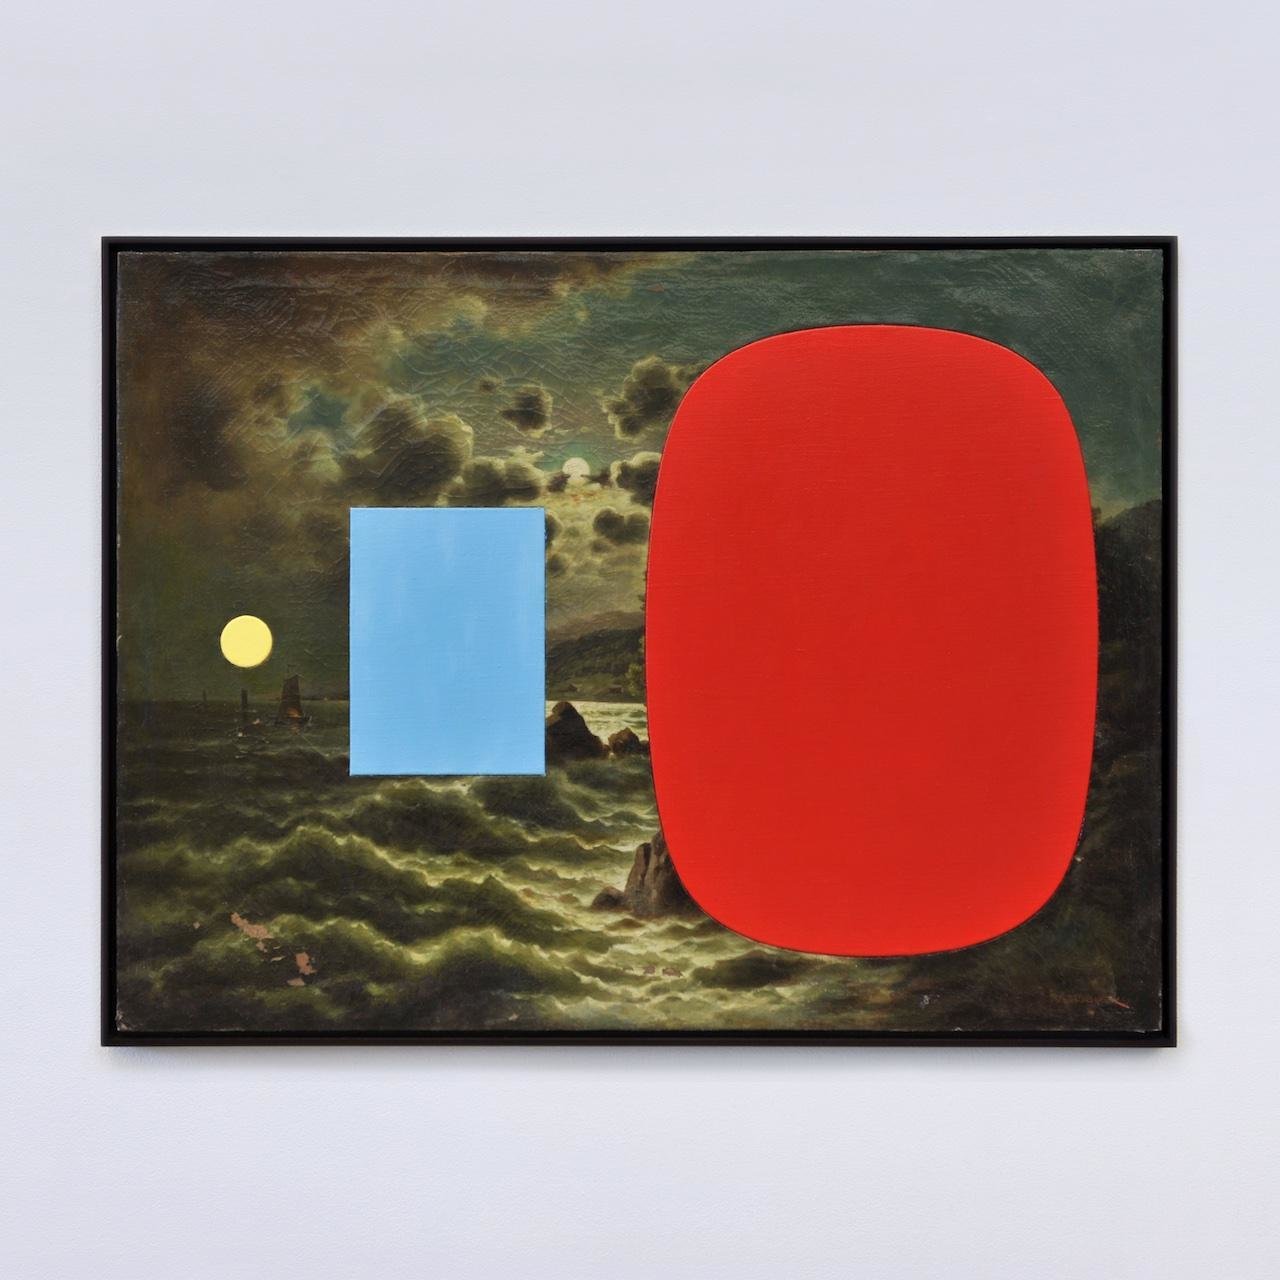
Hiromasa Fukaji, nature/code/drawing AR book.
What constitutes a number visually?
Activity 1
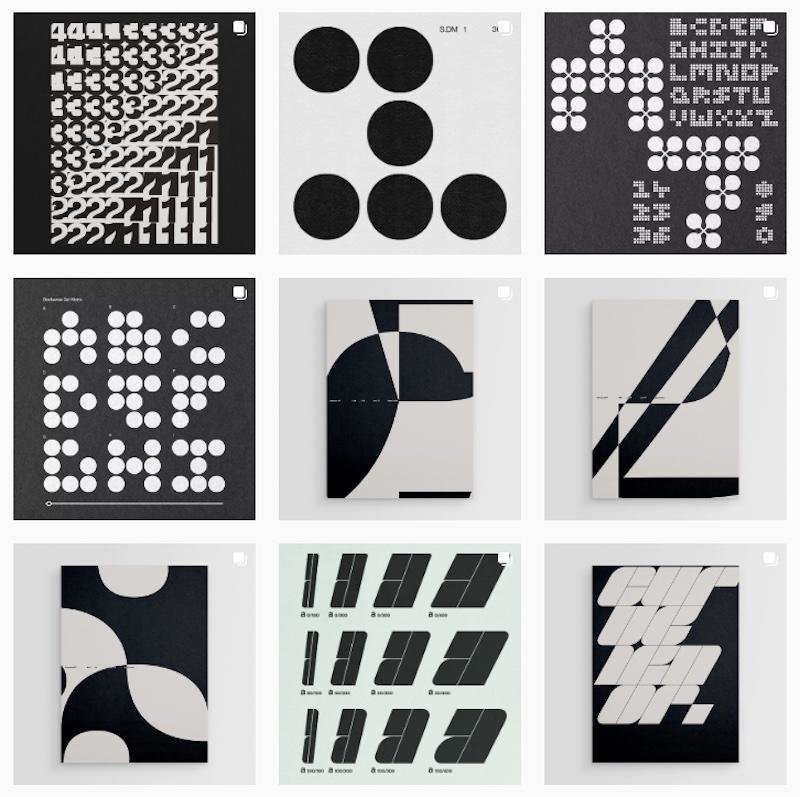
Nigel Cottier Experiments in type, process and pattern.

22–23
Data Spaces
B-DC 221
Computation in Design 3
What constitutes a number visually?
Activity 1
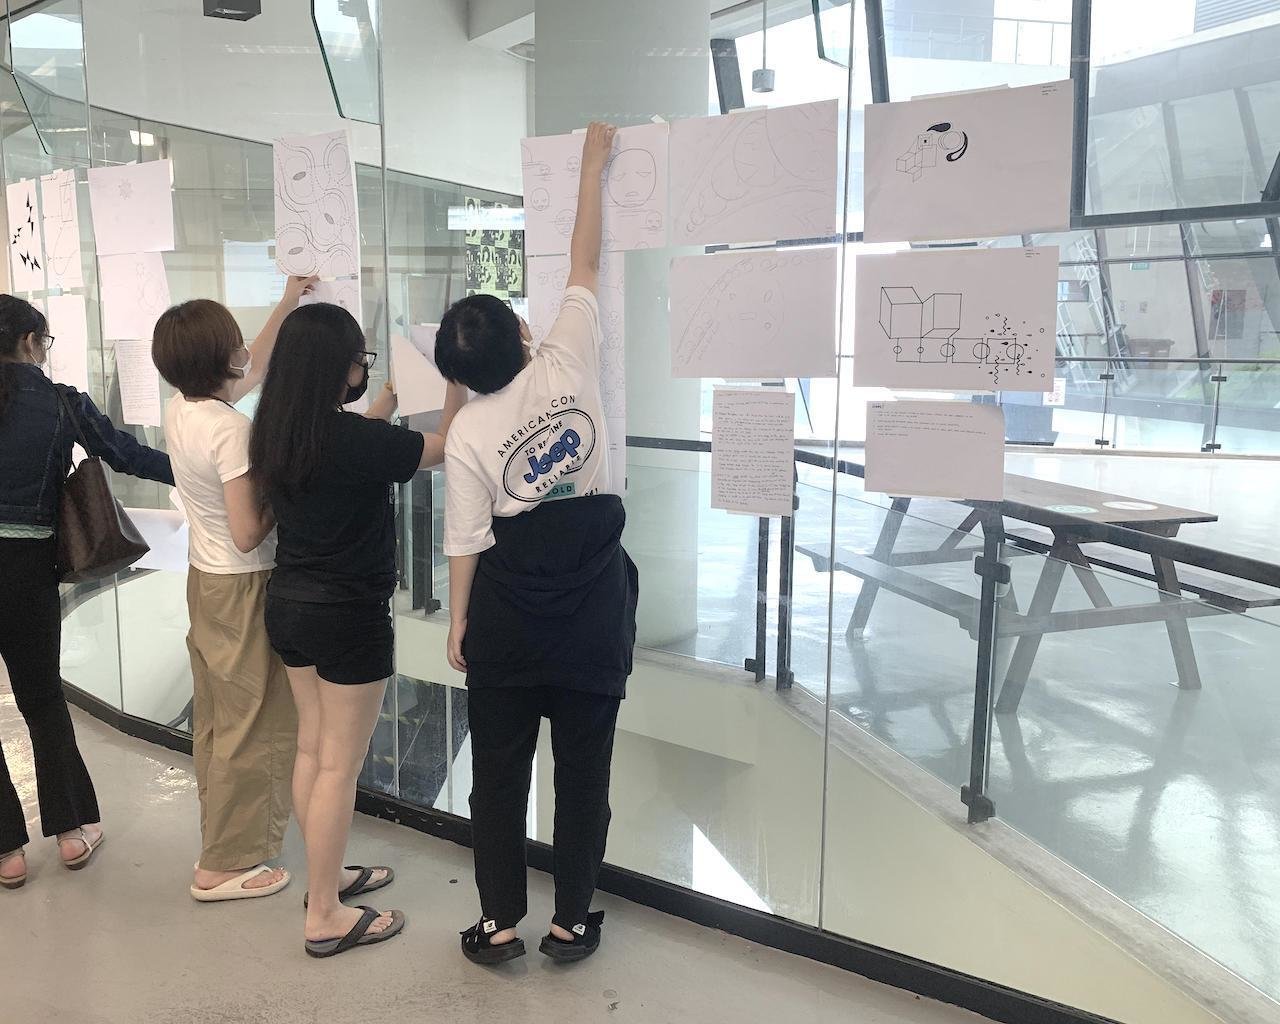
Work in small groups of 4-7 and take your time (120 mins) to design and then print a single digit number each on an A4 paper (portrait format). Take more than one attempt if necessary.
How
Software
Code
Printer
Pencil
Scissors
Paper
Marker
Use
You can chat, share ideas with each other, ask your lecturers for advice. Use digital or analog tools to design your number. When done, print.
Some inspiration has been provided, but don't hesitate to look for your own, share with your peers, discuss with your lecturers.
22–23
Data Spaces
B-DC 221
Computation in Design 3
What constitutes a number visually?
Activity 1
colorful
black-white
busy
minimal
small
big
Criteria
position your design within the three criteria on the right.
You can reposition the black triangles according to your own preferences.
22–23
Data Spaces
B-DC 221
Computation in Design 3
What constitutes a number visually?
Activity 1
Now that you have designed a number, give it some context by mentally adding a unit like cm, seconds, kg, degree celsius, etc.
Now
5
kg
Example
When you look at your number and its unit together, has the meaning of your design changed? Do you need to adjust your design?
5 kg is about as heavy as a cat.
22–23
Data Spaces
B-DC 221
Computation in Design 3
What constitutes a number visually?
Activity 1
What
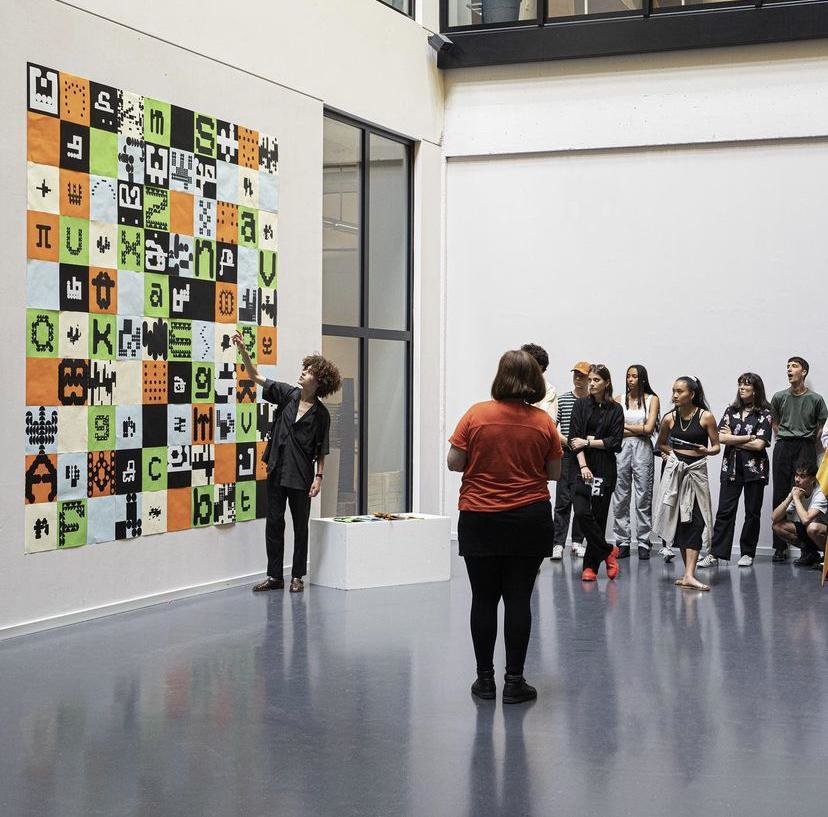
The expected result is a designed one-digit number printed on an A4 paper in portrait format. Paste your printout on the glass windows in the studio so we can look at it and discuss it as a group. Take a photo of your print, keep a digital copy of your design.
Deliverables are underlined, bring refined and one printed copy next week.
Image via @ecal_ch
In a series of activities, numbers are collected and organised into a dataset, then visualised in multiple charts.
Datasets, collecting data
2
22–23
Data Spaces
B-DC 221
Computation in Design 3
22–23
Data Spaces
B-DC 221
Computation in Design 3
What constitutes a number visually?
Activity 1
What
Paste your printout on the glass windows in the studio so we can look at it.
We will then need all printouts nicely organised on the glass windows for the next activity.
Deliverables for this Activity 1 are digital copies of your design work.
22–23
Data Spaces
B-DC 221
Computation in Design 3
First like, then count.
Activity 2
Now that all printouts are nicely pasted onto the glass windows, each student will get a set of stickers to like your peers outcomes based on the following criteria.
How
Spreadsheet
Stickers
Use
favorite
most colourful
least busy
very small in size
Criteria
22–23
Data Spaces
B-DC 221
Computation in Design 3
First like, then count.
Activity 2
Populate Spreadsheet based on stickers counted on each printout.
What
Deliverable for this Activity 2 is a digital copy of your printout after stickers have been pasted.
22–23
Data Spaces
B-DC 221
Computation in Design 3
First like, then count.
Activity 2
pair 2 counts red stickers, and keys amount into the spreadsheet under favourites then pass to pair 3
pair 3 counts yellow stickers, and keys amount into the spreadsheet under most colourful then pass to pair 4
pair 4 counts blue stickers, and keys amount into the spreadsheet under least busy then pass to pair 5
pair 5 counts green stickers, and keys amount into the spreadsheet under very small in size then pass to pair 6
pair 6 takes picture of printout (top view), uploads pictures to shared folder, then sorts printouts by number
Now we need to be patient, focused and organised. We need 4 groups each 12 students in size to split into 6 pairs
pair 1 takes down printouts one by one and adds a white sticker with a number on it (top left), then pass to pair 2
How
22–23
Data Spaces
B-DC 221
Computation in Design 3

Activity 2 done. Hello Activity 3.
22–23
Data Spaces
B-DC 221
Computation in Design 3
Numbers to charts, a report.
Activity 3
Now that we have organised our data in a spreadsheet, we can start visualising these datasets.
What
We will do so in a report like style using 3 types of charts: line, donut, bar.
How
Feltron 2007 Annual Report, an example. Nicholas Felton is a designer whose work focuses on translating data into meaningful objects and experiences. He is the author of numerous personal annual reports that condense the events of a year into a tapestry of maps, graphs and statistics.
For this activity you need to plan fast, make decisions quickly and work efficiently. Keep it simple but well designed.
Challenge
22–23
Data Spaces
B-DC 221
Computation in Design 3
Numbers to charts, a report.
Activity 3
For this activity we will look at three types of charts: line, bar and donut.
A line chart displays the evolution of one or several numeric variables. Data points are connected by straight line segments. A line chart is often used for time-based data.
A bar chart shows the relationship between a numeric and a categoric variable. Each entity of the categoric variable is represented as a bar. The size of the bar represents its numeric value. Bar graph is sometimes described as a boring way to visualise information. However it is probably the most efficient way to show this kind of data. Ordering bars and providing good annotation are often necessary.
A donut chart is a circle divided into sectors that each represent a proportion of the whole. It is often used to show proportion, where the sum of the sectors equal 100%. Alternatively use a pie chart.


22–23
Data Spaces
B-DC 221
Computation in Design 3
Numbers to charts, a report.
Activity 3
Your bar charts should allow you to find correlations between the different datasets collected. Here revisit the example from last week (internet coverage / internet speed).
how do you need to prepare your bar chart?
Does it need to be sorted or can remain unsorted? Which direction is best horizontal, or vertical?
Which number was represented the most, and which the least? Visualise this with a donut or pie chart.


For your line chart, be explorative and look for subjects of your own interest that may align with your activity work, use Google trends. What trends can be observed?
22–23
Data Spaces
B-DC 221
Computation in Design 3
Data Visualisation
From the data we have collected, find the most appropriate chart type for favourites, most colourful, least busy, very small in size. In the spreadsheet the data can be found under the 'sticker-likes' tab.
From the 'number-distribution' tab, use a pie or donut chart to visualise the collected data. Keep in mind that this type of chart is good for small amount of data which totals to 100%.
Since we don't have data that is suitable for a line chart, explore trends.google.com and use one or multiple search terms that you see fit for your report.
How
Report
The Numbers Report is intended to provide students, lecturers, and other interested parties with information about the activities and design performance of the class. Aim to make it meaningful.
Start from an A3 portrait format to design your report. You can use Illustrator as your tool. The report should include the following:
Numbers to charts, a report.
Activity 3
→ Title
→ Description of what the report is about, any findings?
→ Data charts as outlined on the left
→ Sample image(s) of number(s) designed (your own?)
→ Label images and charts
1
22–23
Data Spaces
B-DC 221
Computation in Design 3
How
Numbers to charts, a report.
Activity 3
2
22–23
Data Spaces
B-DC 221
Computation in Design 3
Numbers to charts, a report.
Activity 3
Approach
You can work in teams of 2 or on your own. Manage your time so that you have a printed version by 5pm. If in doubt, speak to your lecturers.


You can work in teams of 2 or on your own. Manage your time so that you have a printed version by 5pm.
Your Title here
Manage your time so that you have a printed version by 5pm.
Manage your time


Deliverable for this Activity 3 is a digital copy of your report and a series of photographs of the physical printout.
Due Week 3
Homework
Complete Activity 3
Activity 3
Numbers to charts, a report.
22–23
Data Spaces
B-DC 221
Computation in Design 3
22–23
Deliverables
Data Spaces
B-DC 221
Computation in Design 3
Deliverables and submission formats are detailed in the following, please navigate downwards.
Deliverables
22–23
Data Spaces
B-DC 221
Computation in Design 3
The approach we are taking in this class is to start with a more fragmented approach, like a puzzle, and then put the pieces we have learned together into a deliverable that brings together the various activities we have undergone and completed at the end of the semester.
1
Deliverables
22–23
Data Spaces
B-DC 221
Computation in Design 3
To help you organise your work, consider the digital portfolio we used in Year 1 as a way to store and keep track of your projects.
3
Activity 1
Activity 2
Activity 3
Activity 4
Activity 5
Project
What constitutes a number visually?
First like, then count.
Numbers to charts, a report.
Urban Fieldworks
Finding a Data Space
Project Data Space
week 1
week 2
week 2,3
week 3–5
week 6
week 7–13
CPJ
CPJ
CPJ
CPJ
CPJ
CPJ
Publication
Process
Final
Deliverables
22–23
Data Spaces
B-DC 221
Computation in Design 3
At the end of the semester, students will produce a publication (per project-group ) documenting and summarising their process, findings and artefacts that they have worked on for the Data Spaces project.
This publication will be a website or a print publication. The format(s) chosen must well document and summarise the process, your findings and the final outcome produced.
All activities to be documented in your Creative Process Journal (CPJ).
2
Website publication (with video)
OR Print publication (pdf and printed)
1. Data Spaces Project Publication Deliverable
2. Activities Deliverables
All activities to be documented in your Creative Process Journal (CPJ)
Urban Fieldworks is an exercise that explores the ordinary happenings and encounters in an urban landscape through the gathering and presentation of data.
Urban fieldworks 1
3

22–23
Data Spaces
B-DC 221
Computation in Design 3
22–23
Data Spaces
B-DC 221
Computation in Design 3
Activity 3
What
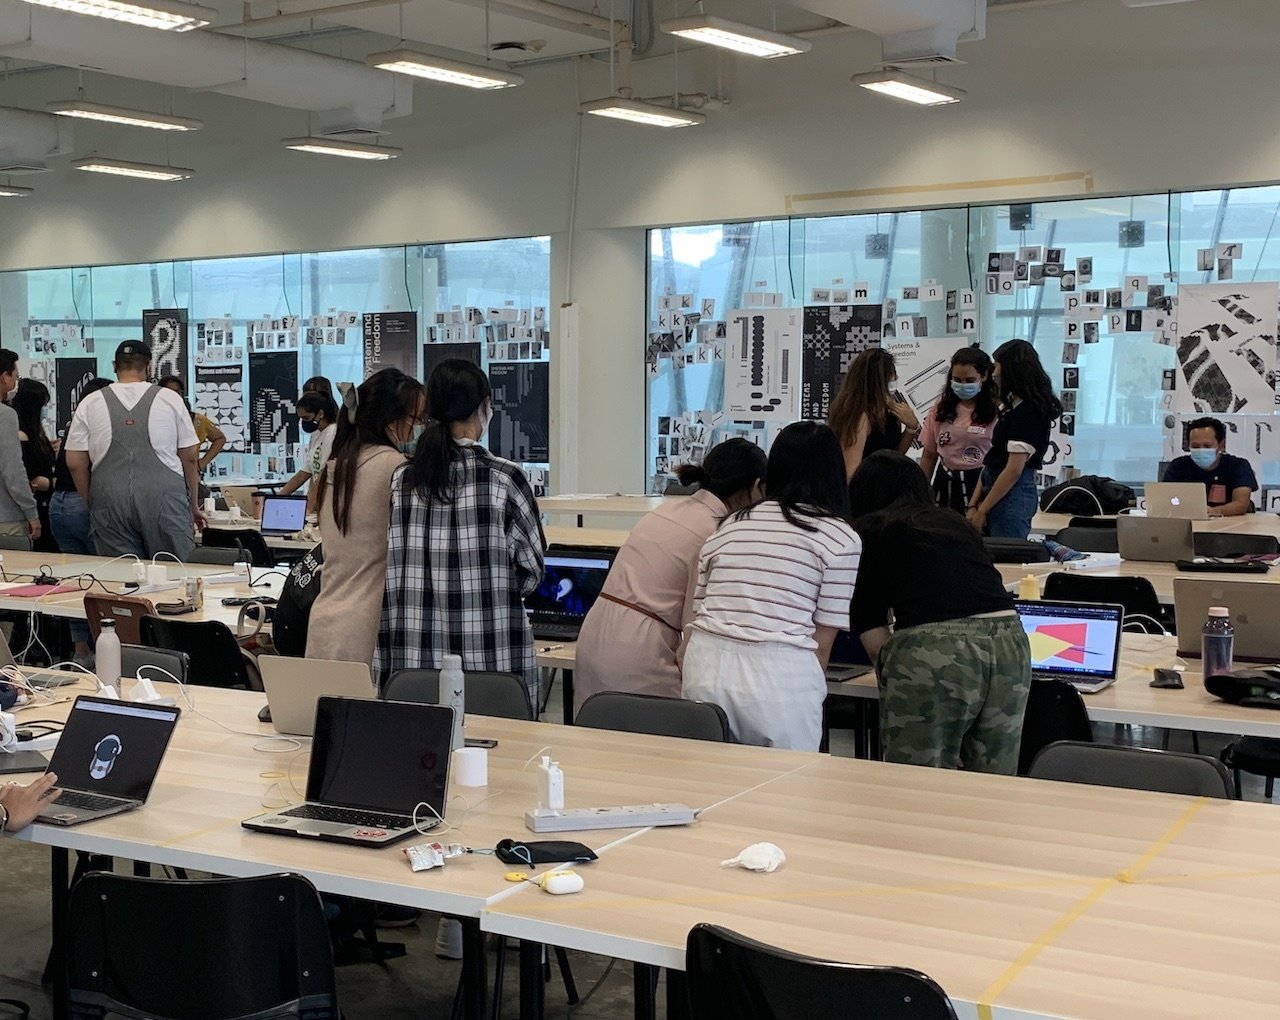
In class we will look at your printed A3 report. Use the tables in the studio to present your report.
The challenge for this activity was to plan fast, make decisions quickly and work efficiently while keeping the report simple but well designed.
Numbers to charts, a report.
Deliverable for this Activity 3 is a digital copy of your report and a series of photographs of the physical printout.
22–23
Data Spaces
B-DC 221
Computation in Design 3

Activity 3 done. Hello Activity 4.
Activity 3
Numbers to charts, a report.
22–23
Data Spaces
B-DC 221
Computation in Design 3

General
Some Observations
Read slides and files carefully they contain detailed instructions and information
Ask for advice when in doubt
Try to solve problems independently first, we are keen to see your creative approach and solutions
Self-learning and inquiry-led
22–23
Data Spaces
B-DC 221
Computation in Design 3
Urban Fieldworks
Activity 4

22–23
Data Spaces
B-DC 221
Computation in Design 3
Urban Fieldworks
Activity 4
Urban Fieldworks is an activity that investigates the ordinary happenings and encounters found within an urban landscape. It invites participants to explore, observe and sense their environment through digital and analog means to then visualise data and create an artefact from their findings.
The following will require you to take a number of steps to complete this activity over 3 sessions. These steps are explained in detail in the following. Together with your group members have a focused read and give it a good thought before you may ask for clarification or help.
1. Work in a group
2. Understand brief, discuss, ideate, plan
3. Conduct field trip
4. Collect data
5. Create an artefact
6. Present
22–23
Data Spaces
B-DC 221
Computation in Design 3
Urban Fieldworks
Activity 4
We shall not cease from exploration, and the end of all our exploring will be to arrive where we started and know the place for the first time.
T.S. Eliot
Exploration
T.S. Eliot, the 1948 winner of the Nobel Prize in Literature, is one of the giants of modern literature, highly distinguished as a poet, literary critic, dramatist, and editor and publisher.

Field trip
Data
Artefact
Urban Explorations Project Singapore, 2012
22–23
Data Spaces
B-DC 221
Computation in Design 3
Urban Fieldworks
Activity 4
22–23
Data Spaces
B-DC 221
Computation in Design 3
Urban Fieldworks
Activity 4


Judith Lee
Panting Trees
Singapore
2012
Temperature
Custom-built tool
SD card
Degrees
Patrick Kochlik
Scentscapes
Singapore
2012
Scent
Nose Henning's Odour System
Paper
Scale 1-10
Ong Kian Peng
Acoustic Territories
Paris
2015
Noise
Microphone
SD card
Sound level
Designer
Project title
Location
Year
Topic
Sensor
Recording
Number
22–23
Data Spaces
B-DC 221
Computation in Design 3
Urban Fieldworks
Activity 4

Judith's objective was to investigate how the surrounding greenery of an area affects a site's temperature, her own bodily temperature as well as her own perceived notion of temperature. She used a custom build temperature measuring tool to collect data.
22–23
Data Spaces
B-DC 221
Computation in Design 3
Urban Fieldworks
Activity 4

Patrick focused his study of the heartlands in Singapore on the measurement, classification, and visualisation of site-specific odours. He used his nose as a recording tool and noted his findings on paper using a prepared data recording template.
22–23
Data Spaces
B-DC 221
Computation in Design 3
Urban Fieldworks
Activity 4

Kian Peng was interested in the sense of hearing. His measuring instrument mimicked the camera by capturing sonic moments in Paris. On several metro rides, he stopped at places that sparked his interest to capture that place and its sonic representation.
22–23
Data Spaces
B-DC 221
Computation in Design 3
Urban Fieldworks
Activity 4
Dhiya traveled around the island of Singapore, looking for soil samples out of curiosity to see what those samples would yield in terms of consistency, colour and granularity. In the lab, the images were magnified and revealed beautiful micro-landscapes. Using custom-built software, individual height maps were created and then 3D printed.

22–23
Data Spaces
B-DC 221
Computation in Design 3
Urban Fieldworks
Activity 4
Sample outcomes from previous years.

22–23
Data Spaces
B-DC 221
Computation in Design 3
Urban Fieldworks
Activity 4


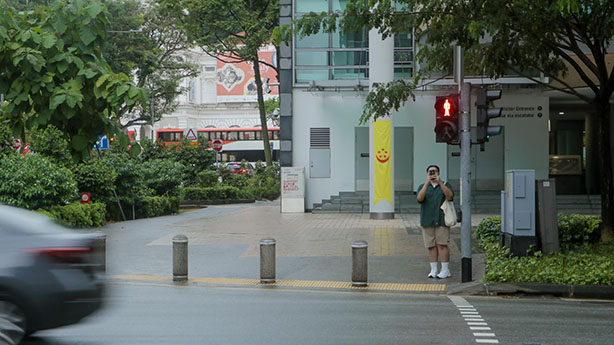
People walking out the MRT
Taken in Downtown line
Observing and analysing the total percentage of people wearing black short-sleeved t-shirts

People on their phones in a mall
Usual suspects. Expected spaces and topics for observing and collecting data.
22–23
Data Spaces
B-DC 221
Computation in Design 3
Urban Fieldworks
Activity 4

Less expected spaces and topics for observing and collecting data.


22–23
Data Spaces
B-DC 221
Computation in Design 3
Urban Fieldworks
Activity 4
22–23
Data Spaces
B-DC 221
Computation in Design 3
Urban Fieldworks
Activity 4
Approach
In your group, take time to review the following slides and the documents linked within them. Read the slides carefully so that you have a good understanding of how to conduct this activity. Take notes and sketch out what is asked of you. If in doubt, check with your lecturer.
22–23
Data Spaces
B-DC 221
Computation in Design 3
Urban Fieldworks
Activity 4
Description
Steps to take
Collecting data
Group work
Idea sparks
Activity fields
Going through the pdf document
The pdf document describes in detail the steps for you required to take. In your group, do read through the pages carefully, then discuss together the approach you want to take to collect your data. If unclear, do consult with your lecturers.
22–23
Data Spaces
B-DC 221
Computation in Design 3
Urban Fieldworks
Activity 4
Description
Steps to take
Collecting data
Group work
Idea sparks
Activity fields
Going through the pdf document
Idea sparks
The purpose of the idea sparks is for you to define a scenario for your activity and then collect and record data. These sparks are suggestions for a field trip with a planned purpose in mind, as a starting point to explore and observe your surroundings with more detail.
What is an idea spark and how can I use it?
Idea sparks are divided into categories, each of which has a number of sub-categories. These are simply suggestions to get the ideation process started and help participants select sub-categories that most inspire them.
What is an idea spark used for?
The Idea Sparks are then used on the next page of the booklet, the activity fields, that define the scenario to collect data on your field trip.
22–23
Data Spaces
B-DC 221
Computation in Design 3
Urban Fieldworks
Activity 4
Description
Steps to take
Collecting data
Group work
Idea sparks
Activity fields
Going through the pdf document
Activity fields
The purpose of the activity fields is to define how you will conduct your data collection method during your field trip. This will help you narrow down the type of data you will collect, how you will collect it, and where you will collect it.
What am I supposed to do here?
Select one or more sub-categories from section idea sparks and write them inside the dedicated activity field.
Are there any examples?
See next slides
22–23
Data Spaces
B-DC 221
Computation in Design 3
Urban Fieldworks
Activity 4


Going through the pdf document
3. Our interest is in the audible and we are looking for beautiful sounds that we can find in traffic while walking through the city. We will use the mobile phone to record audio. Then we will rate the recorded sounds for each place on a scale from 1 to 10.
Example Activity fields
1. Enter the idea sparks that interest you the most
2. Draw connections between fields
22–23
Data Spaces
B-DC 221
Computation in Design 3
Urban Fieldworks
Activity 4

Going through the pdf document
Record Audio that is beautiful found in traffic while walking, use your mobile phone to record.
Example Activity fields
22–23
Data Spaces
B-DC 221
Computation in Design 3
Urban Fieldworks
Activity 4
Plan the places you want to visit and, as a group, conduct your field trip once or over multiple days.
Document your field trip(s) by taking photos, videos, audio recordings if applicable, these can later be used for documentation, the making of the artefact and a report (can be optional) of your field trip.
Collect at least 30 individual data entries per group, a data entry consists of a timestamp, geo location, numerical data (or audio, visual or physical samples)
Record your data. If your data is numerical, there is a spreadsheet template that you can use in the shared-folder.
If your data is samples like audio, visual or physical samples, digitally archive and organise you data. You can then evaluate your samples on a scale from 1 to 10 based on a criteria you set, then record that number in the spreadsheet for each data entry.
How to conduct the field trip
1
2
3
4
22–23
Data Spaces
B-DC 221
Computation in Design 3
Urban Fieldworks
Activity 4
The spreadsheet
First row is reserved for labels
Second and all consecutive rows are the data entries
Each data entry consists of
timestamp (YYYY-MM-DD-hh-mm)
latitude (decimal number)
longitude (decimal number)
data (integer or decimal number)
click spreadsheet to grab a copy from Google Drive.
If necessary you can add columns after column data to add more numeric data or filenames or labels.
22–23
Data Spaces
B-DC 221
Computation in Design 3
Urban Fieldworks
Activity 4
The spreadsheet
Data entries
What is a timestamp and how do I record it?
A timestamp marks the time that an event occured. To record a timestamp, read the time and date from your phone or watch. Later you will record the time taken in a given format so that it can easily be read by a program. See format to the right.
What is latitude and longitude and how do I record it?
Latitude and longitude are geographical coordinates which can be calculated by a GPS device like your phone. We will need both latitude and longitude in decimal degrees format (DD), usually they come formatted in Degrees Minutes Seconds (DMS) you can use a converter like this
What is numerical data and how do I record it?
numerical data can be an integer or a decimal number, you can record these numbers, together with a timestamp and the geo-location, using a spreadsheet, alternatively write them down on paper or in a mobile app likes Notes. Later when you are back at your desk, transfer your records to the spreadsheet template provided.
What do I photograph or video record or sound record? And why?
This is to document your field trip, you can also use the geo-location feature of your camera app to record these details with each image taken (if enabled and available for your mobile OS). One way to extract this information is to manually extract the coordinates from an image using Photos and Preview (go to Tools, then 'show inspector') on mac OS. In a later session you will need these images and videos for documentation and presentation purposes.
YYYY-MM-DD-hh-mm
2021-08-19-15-04
decimal
1.4365651667
integer or decimal
12 or 4.75
timestamp
latitude, longitude
data
22–23
Data Spaces
B-DC 221
Computation in Design 3
Urban Fieldworks
Activity 4
Artefact
We will cover the artefacts part in the next session. The focus this week should be on planning and conducting the field trip and data collection.
For the artefact, we will give you options on how to approach making it and we are very curious about your creative concept, interpretation and implementation. Options will include digital, coding, crafting or drawing.
22–23
Data Spaces
B-DC 221
Computation in Design 3
Urban Fieldworks
Activity 4
Deliverables, week 6.
Make it meaningful
Challenge
An Artefact which you will be briefed on next week, week 4.
A spreadsheet with data collected, see previous slides for how-to.
A 5–7 mins presentation including digital copy of slides (.pdf).
A field trip may seem like a tedious task, but with a common interest and a plan in mind, you and your group should be able to see the value in a field trip. The more convinced and interested you are in your idea, the more successful the process and outcome. Think about your audience: what story do you want to tell?
Going through the steps and understanding what is required of you may be challenging at first, but with a systematic and organised approach, you should be able to do all steps successfully and on time.
22–23
Data Spaces
B-DC 221
Computation in Design 3
Urban Fieldworks
Activity 4
One of the basic situationist practices is the derive, a technique of rapid passage through varied ambiences. Derives involve playful constructive behaviour and awareness of psychogeographical effects, and are thus quite different from the classic notion of journey or stroll.
Theory of the Derive (Debord), 1958.
Off to a good start
Due Week 4
Homework
Complete Field Trip
Record data
22–23
Data Spaces
B-DC 221
Computation in Design 3
Urban Fieldworks
Activity 4
In this session, we will review the data collected on your field trips to discuss with your peers and lecturers to prepare the design of an artefact.
Urban fieldworks 2
4
22–23
Data Spaces
B-DC 221
Computation in Design 3


22–23
Data Spaces
B-DC 221
Computation in Design 3
Urban Fieldworks
Activity 4
In this session we will review your field trips in your respective classes with your respective lecturers first.
Select up to 3 images (or videos, sounds, notes) that you took on your field trip and casually share your experience with your lecturer and peers. Are there any insights and findings you find worthwhile to share?
On your field trip, what went well, what did not go as planned? Briefly explain what your plan and goal was in gathering your numerical data. What can or will you do with this data?
Step 1/3
22–23
Data Spaces
B-DC 221
Computation in Design 3
Urban Fieldworks
Activity 4
In preparation for next week, you will be introduced to a series of examples to create an artefact that expresses your topic and data visually. Here your ideas and creative interpretation is required.
Step 2/3

22–23
Data Spaces
B-DC 221
Computation in Design 3
Urban Fieldworks
Activity 4


Kian Peng was interested in the sense of hearing. His measuring instrument mimicked the camera by capturing sonic moments in Paris. On several metro rides, he stopped at places that sparked his interest to capture that place and its sonic representation.
Acoustic Territories
22–23
Data Spaces
B-DC 221
Computation in Design 3
Urban Fieldworks
Activity 4
In preparation for next week, you will be introduced to a four options to create an artefact that expresses your topic and data visually. Here your ideas and creative interpretation is required while working collaboratively in a team.
Step 2/3
Option 1 Drawing
Option 2 Data Physicalisation
Option 3 Generative DataVis
Option 4 Sound
22–23
Data Spaces
B-DC 221
Computation in Design 3
Urban Fieldworks
Activity 4
Step 2/3 Artefact option 1
Drawing by hand comes naturally, you are expected to demonstrate promising and resolved translations of your field trip data into a series of data drawings. Study your references.
Draw inspiration from Giorgia Lupi and Stefanie Posavec's collaborative work Dear Data and their extensive body of individual works. Links to their websites are available below. After you have familiarized yourself with these references, start sketching and drawing your data.
22–23
Data Spaces
B-DC 221
Computation in Design 3
Urban Fieldworks
Activity 4
Step 2/3 Artefact option 2
Data physicalizations or physical visualizations are data-driven physical artefacts. They are the physical counterparts of data visualizations. Such artefacts may involve the use of computers, either to fabricate them or to actuate them. A closely related term is data sculpture.
22–23
Data Spaces
B-DC 221
Computation in Design 3
Urban Fieldworks
Activity 4
Step 2/3 Artefact option 3
22–23
Data Spaces
B-DC 221
Computation in Design 3
Urban Fieldworks
Activity 4
Step 2/3 Artefact option 4
Alternatively, you can use the audio samples you collected on your field trip to create a soundtrack, for example, using the Audacity software or mobile apps such as Bandlab, which allow you to create soundtracks from your own recorded samples. Try Adobe Audition's Waveform to visually represent your recordings from where you can see deeper into the frequencies recorded from which you can draw additional conclusion.
Or use p5js and an FFT transform applied to your audio samples to visualise them dynamically in code. Challenging, but certainly worthwhile.

22–23
Data Spaces
B-DC 221
Computation in Design 3
Urban Fieldworks
Activity 4
Presentation, how-to?
Before we start making, Vikas will brief you on the presentation format and details required for next week.
22–23
Data Spaces
B-DC 221
Computation in Design 3
Urban Fieldworks
Activity 4
Step 3/3 Artefact
Let's start working on your artefact. In your group select one of the four options introduced earlier, ideate first, then define your output, do some sketches and experiments first if you find that useful. Ask your lecturers for advice. We will then see and hear about your artefact and presentation in our next session in week 5.
Before you start, upload your spreadsheet as .csv file to the shared folder. How to do that? See following slides.
Time management
Independent and self-directed learning and working
Collaboration
Apply technical skills
Develop and contextualise ideas
Communicate visually
22–23
Data Spaces
B-DC 221
Computation in Design 3
Urban Fieldworks
Activity 4
Spreadsheet to .csv
Header
Rows
Columns

22–23
Data Spaces
B-DC 221
Computation in Design 3
Urban Fieldworks
Activity 4
Optional, .csv to p5js (3D) request demo by Andreas

Comma Separated Values, a .csv file imported into p5js sketch
Click image to open p5js code
22–23
Data Spaces
B-DC 221
Computation in Design 3
Urban Fieldworks
Activity 4
Optional, .csv to p5js (2D) request demo by Andreas

Comma Separated Values, a .csv file imported into p5js sketch
Click image to open p5js code
Due Week 5
Homework
Prepare Urban Fieldwoks Artefact and Presentation
22–23
Data Spaces
B-DC 221
Computation in Design 3
Urban Fieldworks
Activity 4
Students present their findings together with their artefact to conclude the Urban Fieldworks exercise. Outcomes to be documented in a digital format.
Urban fieldworks 3
5
22–23
Data Spaces
B-DC 221
Computation in Design 3

22–23
Data Spaces
B-DC 221
Computation in Design 3
Urban Fieldworks
Activity 4
Field trip results.
22–23
Data Spaces
B-DC 221
Computation in Design 3
Urban Fieldworks
Activity 4
Prepare your artefacts well for documentation.
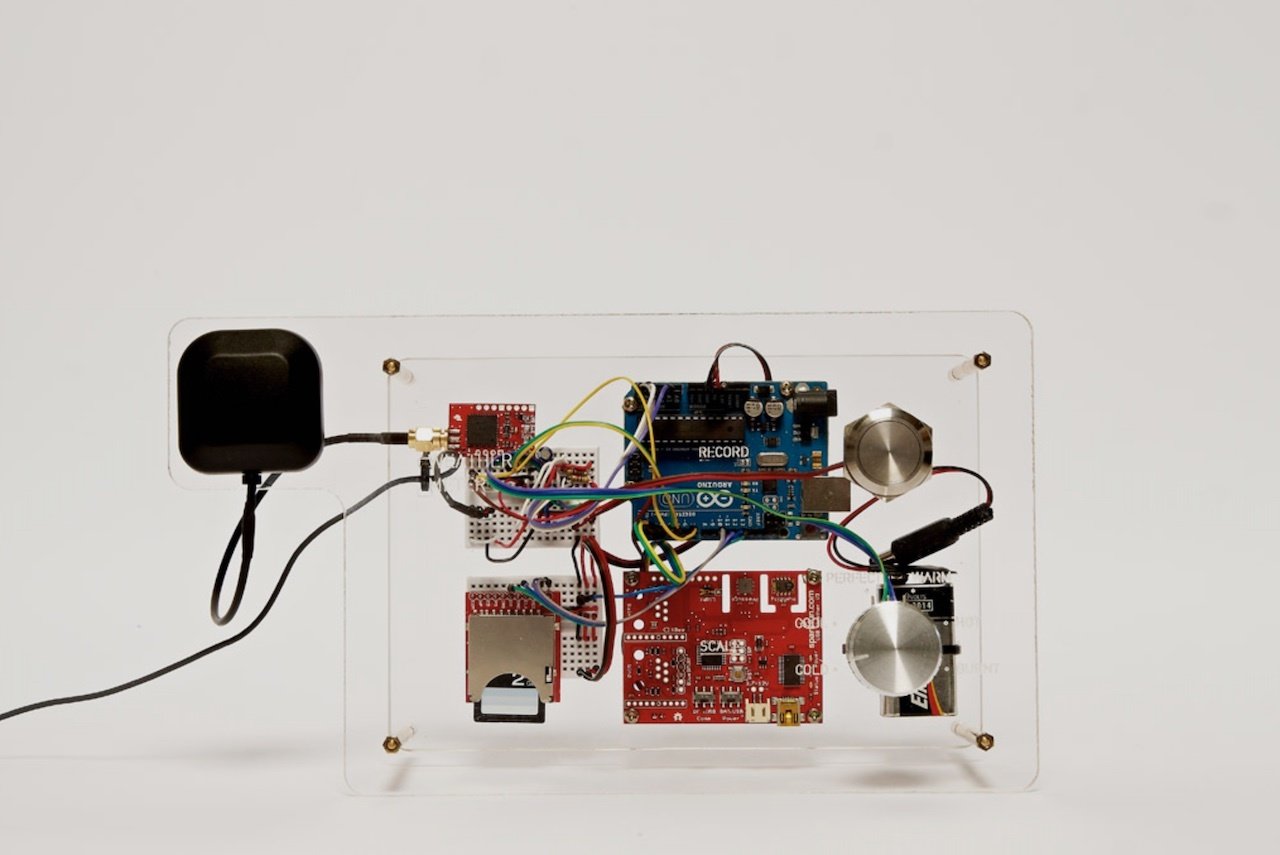

Judith Lee
Panting Trees
Singapore
2012
Temperature
Custom-built tool
SD card
Degrees
22–23
Data Spaces
B-DC 221
Computation in Design 3
Urban Fieldworks
Activity 4
Prepare your artefacts well for documentation.
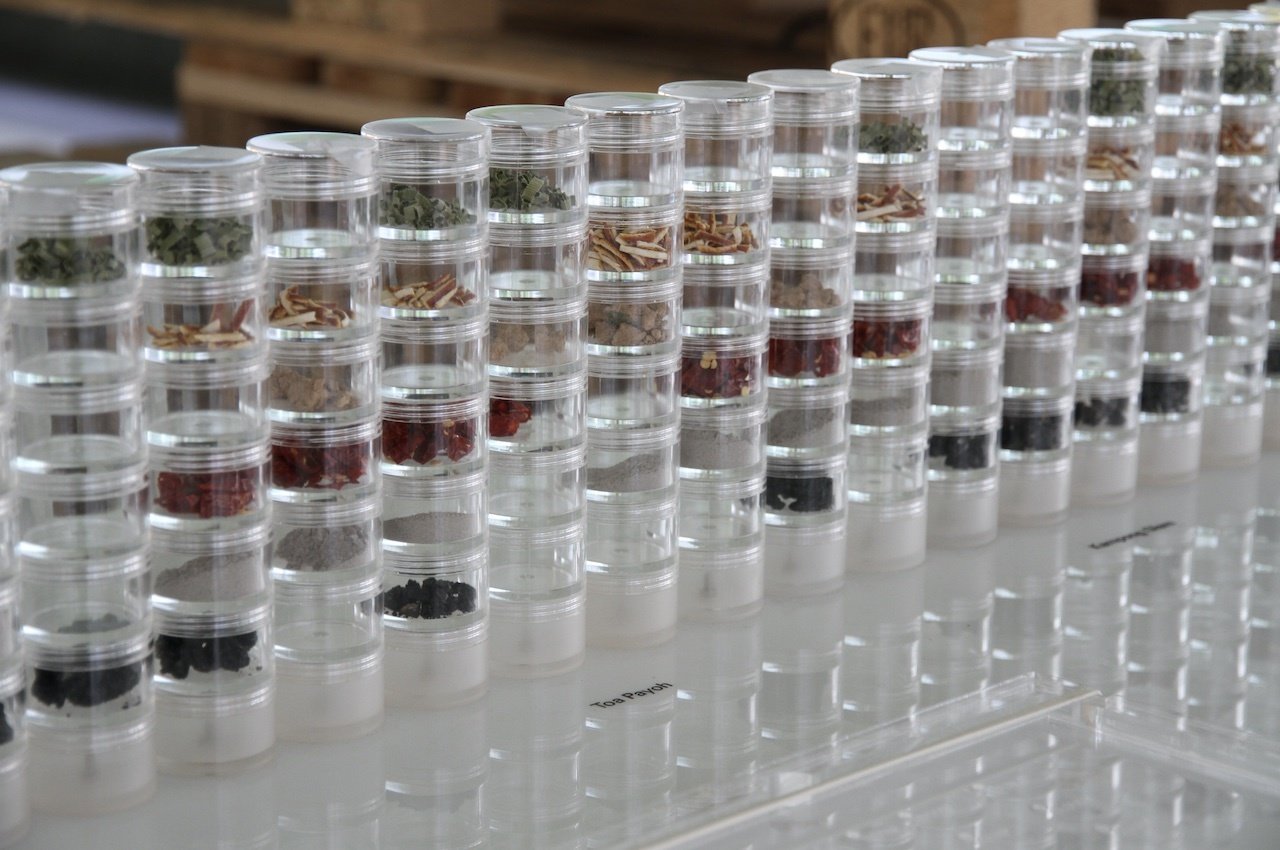

Patrick Kochlik
Scentscapes
Singapore
2012
Scent
Nose Henning's Odour System
Paper
Scale 1-10
22–23
Data Spaces
B-DC 221
Computation in Design 3
Urban Fieldworks
Activity 4
Prepare your artefacts well for documentation.
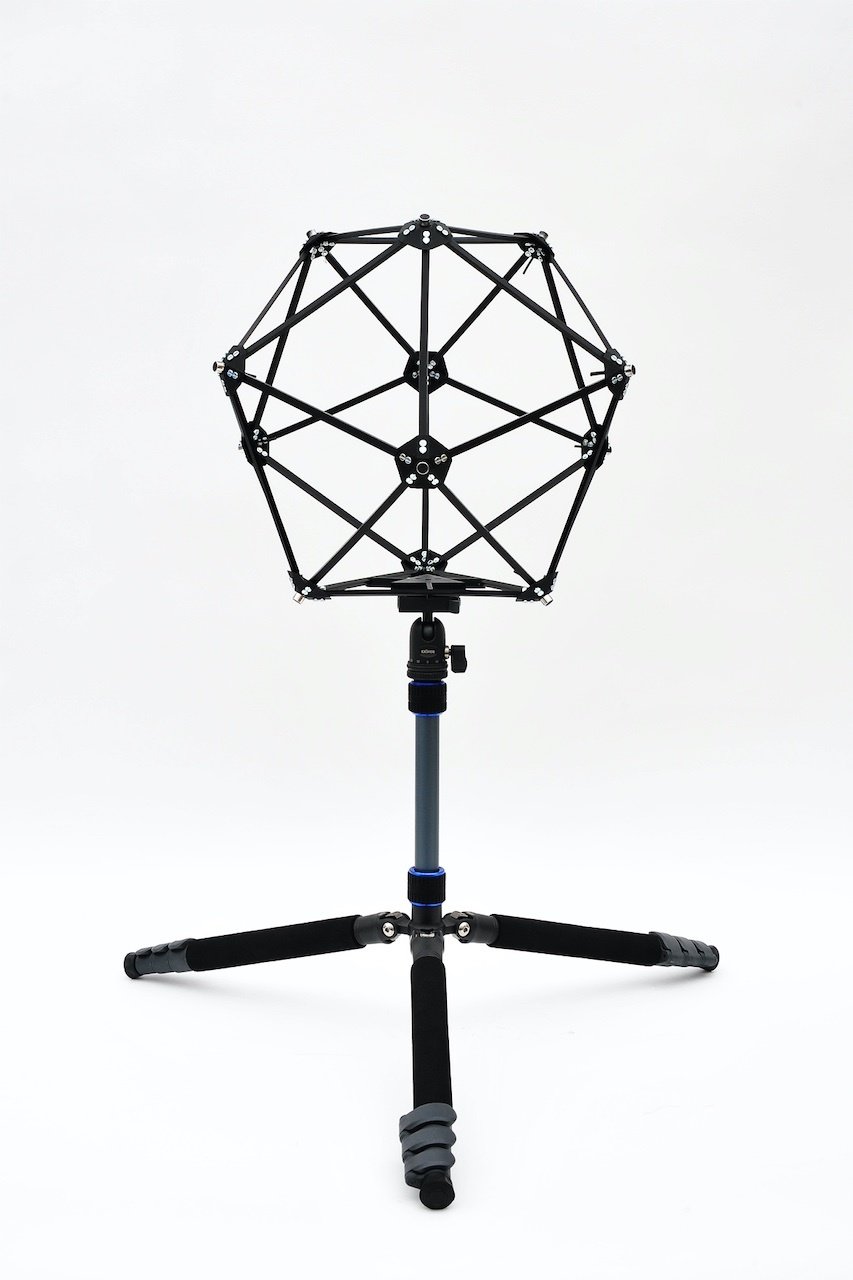
Ong Kian Peng
Acoustic Territories
Paris
2015
Noise
Microphone
SD card
Sound level


22–23
Data Spaces
B-DC 221
Computation in Design 3
First part of today's session
Review and refine artefacts as well as your presentations
Second part
Group presentations
5 mins each
prepare one laptop to present
Urban Fieldworks
Activity 4
Due Week 6
Homework
see previous slide
22–23
Data Spaces
B-DC 221
Computation in Design 3
Urban Fieldworks
Activity 4
Introduction to the data spaces topic. From a list of data space options, students select and define a starting point and initial interest for their Data Spaces project.
Data Spaces
6
22–23
Data Spaces
B-DC 221
Computation in Design 3

22–23
Data Spaces
B-DC 221
Computation in Design 3
Recap
→ experimenting visually
→ data to visual representation
→ collecting and organising data
→ interpreting and expressing data
→ from idea to artefact
→ communicating insights and findings
→ visual narrative and presentation
Urban Fieldworks
Activity 4
Activity 1
Activity 3
Activity 2,4
Activity 4
Activity 4
Activity 3,4
Activity 3,4
What we have practices and addressed so far.
22–23
Data Spaces
B-DC 221
Computation in Design 3
Finding a Data Space
Activity 5
Possible approaches: Experimentation, iteration, trial and error, interactive storytelling, data visualisation, designing experiences.
Through making, work on your artefact's aesthetics, visual quality, visual language and visual narrative. Conclude with a presentation and a pdf or web publication.
Preparing for the Data Spaces project.
3 Artefact
2 Process
1 Ideation
Gather background information on a topic through research and group discussion, analyse and synthesise to arrive at an idea and proposal that you and your group will pursue from week 7 onwards.
Week 6
Week 9
Week 9
Week 13
22–23
Data Spaces
B-DC 221
Computation in Design 3
Finding a Data Space
Activity 5
Data Spaces
1
2
3
4
5
6
7
8
Datavis
Quantified Self
Real-time data
Archives
Simulation
Text Prompt
Point Clouds
Generative Aesthetics
The objective for each group is to select, review and negotiate a Data Space from the options given on the right by next week.
22–23
Data Spaces
B-DC 221
Computation in Design 3
1 Datavis
22–23
Data Spaces
B-DC 221
Computation in Design 3
Finding a Data Space
Activity 5
Numbers, database, data mining
1
Data visualisation, data physicalisation
Climate Change, reports, public datasets, news and media, big data
Research, data cleaning, data analysis, visualisation, making visible the invisible
Method(s): Infographic, data analysis, data visualisation, polls, survey, quantitative research
Topic
For example
Example application
Approach
22–23
Data Spaces
B-DC 221
Computation in Design 3
Finding a Data Space
Activity 5
Find data that allows you to meaningfully visualise and interpret findings and insights from large quantities of numbers. Visualisation approaches can be code-based or manually realised in software. The results can be screen-based, printed or manifested in physical form. A well thought-out data physicalisation with special attention to materials, design, production and presentation can set a intriguing process and body of work in motion.
1
Challenge
Numbers, database, data mining
Topic


22–23
Data Spaces
B-DC 221
Computation in Design 3
Finding a Data Space
Activity 5
1
Starting Points
Numbers, database, data mining
Topic
22–23
Data Spaces
B-DC 221
Computation in Design 3
2 Quantified Self
22–23
Data Spaces
B-DC 221
Computation in Design 3
Finding a Data Space
Activity 5
Quantified self, location based, online presence
2
Data visualisation, data physicalisation, maps, mapping
self, tracking, recording, logging, leaving trails
Collect data systematically to monitor, analyse, improve one's life(style)
Method(s): Day in the life, mobile diary study, ethnography, self quantification, data collection, data analysis, cultural probes
Topic
Example application
Approach
For example
22–23
Data Spaces
B-DC 221
Computation in Design 3
Finding a Data Space
Activity 5
2

Quantified self, location based
Topic
The quantified self is not that far from a very personal data visualisation. When done consistently, it can provide surprising insights into one's daily life and routines. For example, track your own health and physical activities over a period of a week or two. Or use your phone's tracking features to see how long and where you stared at the screen each day. Observe your eating habits: How often do you chew per bite? Do you watch while you eat? What do you watch and why? Have you had a good night's sleep?
Challenge
Starting Points
22–23
Data Spaces
B-DC 221
Computation in Design 3
3 Real-time Data
22–23
Data Spaces
B-DC 221
Computation in Design 3
22–23
Data Spaces
B-DC 221
Computation in Design 3
Finding a Data Space
Activity 5
Real-time data
3
Real-time visuals, interfaces, interactive objects, audio visualiser, posenet, yolo
human computer interaction, real-time processing, computer vision
Use of real-time data for dynamically changing visuals, sounds or think of responsive interactions
Method(s): Prototyping, experimentation, observations, user testing, coding
Topic
For example
Example application
Approach
22–23
Data Spaces
B-DC 221
Computation in Design 3
Finding a Data Space
Activity 5
3
Real-time data
Topic
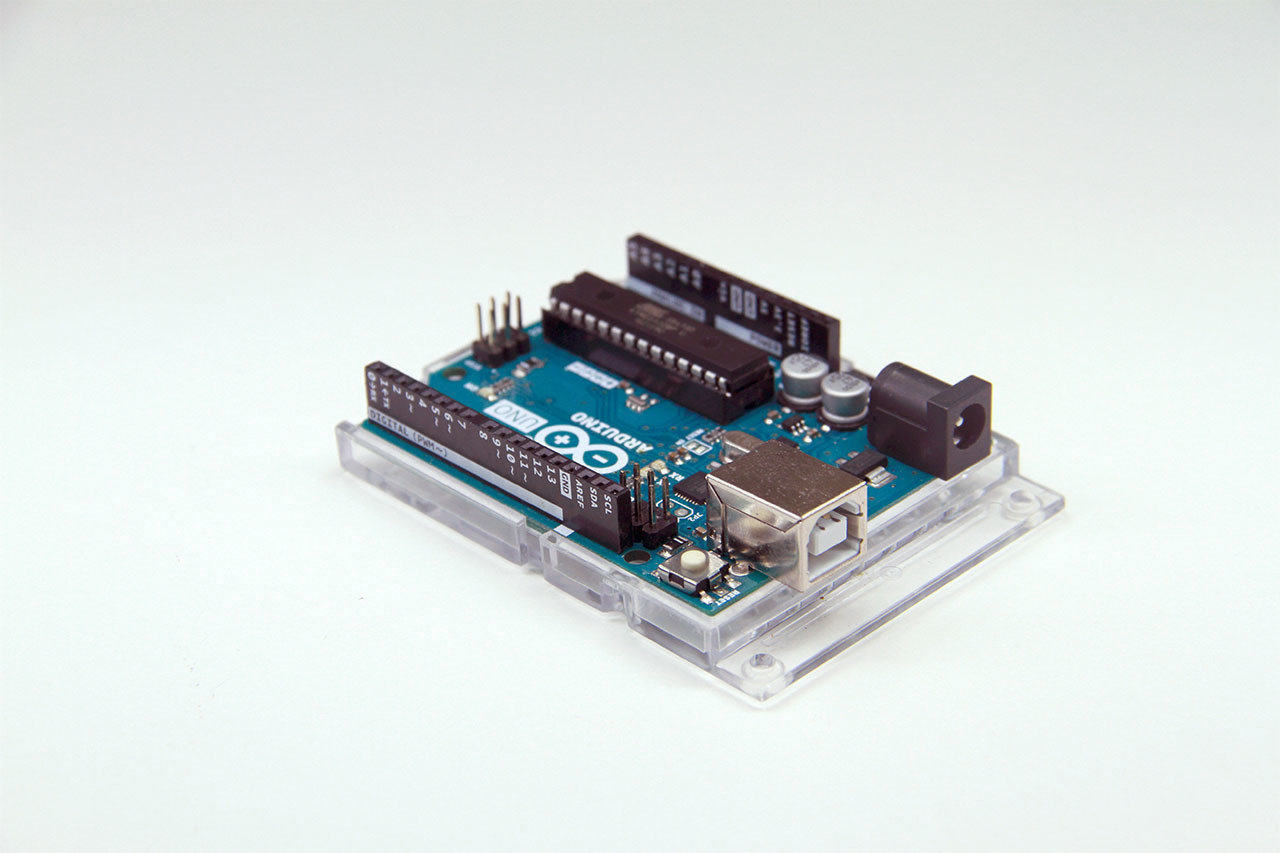
Working with real-time data is particularly useful when interactivity is involved, for example in interactive physical interfaces such as a simple button or slider, or in more complex applications where machine learning is used to recognise a person's pose via a video transmission. Technically, this seems like a big challenge at first, but after setting up the system and keeping the idea simple, the possibilities and results can be fascinating and exciting, even if it is just pressing a simple button - what is more important here is what that button will do.
Challenge



22–23
Data Spaces
B-DC 221
Computation in Design 3
Finding a Data Space
Activity 5
3
Real-time data
Topic
Starting Points
If your group considers to pursue this option, speak to Andreas about the technical requirements, challenges and possibilities.
22–23
Data Spaces
B-DC 221
Computation in Design 3
4 Archives
22–23
Data Spaces
B-DC 221
Computation in Design 3
Finding a Data Space
Activity 5
Archives
4
Archives of documented everyday things, places, people–found or put together by your group
Public or personal (online) image archives, historical archives
Use an image archive and classify, organise it with different analog, digital or coded strategies to gain insights into commonalities and deviations, tell the archive's story.
Topic
For example
Example application
Approach
Method(s): (Archival) ethnography, observation
22–23
Data Spaces
B-DC 221
Computation in Design 3
Finding a Data Space
Activity 5


A photographer cataloged all 12,795 items in her house.


4
Archives
Topic
The topic Archives here revolve around large collections of images collected in a particular situation or location. Making sense of a vast amount of visual data can lead to unexpected insights and findings characteristic for a public or private space, community, or individual.
Challenge
22–23
Data Spaces
B-DC 221
Computation in Design 3
5 Simulation
22–23
Data Spaces
B-DC 221
Computation in Design 3
Finding a Data Space
Activity 5
Simulation
5
Create a coded system that has a life of its own. Design a virtual space that can be navigated by walking around.
particle-systems, virtual spaces, physics simulation, nature of code
Start with taking a look at the Nature of Code website which introduces code and various simple and more complex simulation strategies
Method(s): Experimentation, observation, coding
Topic
For example
Example application
Approach
22–23
Data Spaces
B-DC 221
Computation in Design 3
Finding a Data Space
Activity 5
5
Simulation
Topic
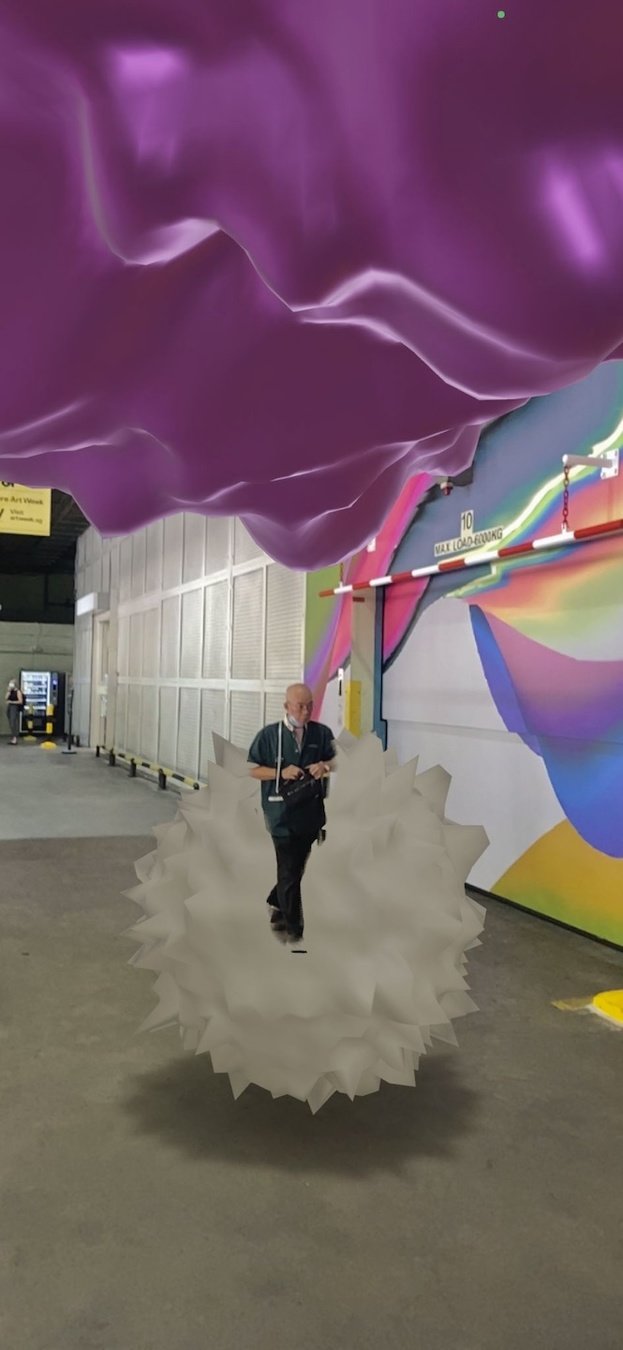
With simulations of physical phenomena such as particle systems, 3D space, emergence or physics, we can bring the inside of our screens closer to reality or even beyond. What possibilities can you see in augmenting, simulating, navigating imagined realities through software and code?
Challenge


22–23
Data Spaces
B-DC 221
Computation in Design 3
Finding a Data Space
Activity 5
5
Simulation
Topic
Starting Points
22–23
Data Spaces
B-DC 221
Computation in Design 3
6 Text Prompt
22–23
Data Spaces
B-DC 221
Computation in Design 3
Finding a Data Space
Activity 5
Text Prompt
6
midjourney, dall-e, sudowrite, hugging face
Co-create text, images with an AI system through text input
Using text to describe images and co-create with AI systems meaningfully.
Method(s): Exploration, aesthetics
Topic
For example
Example application
Approach
22–23
Data Spaces
B-DC 221
Computation in Design 3
Finding a Data Space
Activity 5
6
Text Prompt
Topic
Text prompting refers to a recent trend in generating images through text prompts using platforms such as MidJourney, Dall-e, or Stable Diffusion. Once up and running it is quite easy and satisfying to get the machine generate images for you, but how to make this a meaningful exercise and not just a series of woahs and oohs? Is there more to it? Are there stories that can be told that entertain us but also critically inform us about this new trend?
Challenge
Raw Mantique felt it was the right opportunity to review the chapter she had just finished reading in the Blue Shore mountains. She sat quiet as a mouse, her hands and brows raised, her one eye blinking once every four seconds. “The mountain is also the mountain,” she said, finally.
“The mountain is also the mountain,” said the other girls, in unison. “The mountain is also the mountain,” she repeated. The girls repeated it again.
She repeated it again, and so did the girls. It was the last time Mantique repeated the words. “It’s time to leave the mountains,” she said. “Now it is time to rise.”
Sudowrite in collaboration with Andreas
22–23
Data Spaces
B-DC 221
Computation in Design 3
Finding a Data Space
Activity 5
6
Text Prompt
Topic
Starting Points
22–23
Data Spaces
B-DC 221
Computation in Design 3
7 Point Clouds
22–23
Data Spaces
B-DC 221
Computation in Design 3
Finding a Data Space
Activity 5
Point Clouds
7
Photogrammetry, 3D scanning, 3D printing, virtual space
scan, represent, navigate a physical space virtually
Topic
For example
Approach
22–23
Data Spaces
B-DC 221
Computation in Design 3
Finding a Data Space
Activity 5
7
Point Clouds
Topic
Can we bring the physical into the virtual?
Challenge


22–23
Data Spaces
B-DC 221
Computation in Design 3
8 Generative Aesthetics
22–23
Data Spaces
B-DC 221
Computation in Design 3
Finding a Data Space
Activity 5
Generative Aesthetics
8
An image generator that you can use for a design project. Be selfish and create an image generator for visual feel-good moments–project them and play some music.
Glitching, data moshing, ascii art, shaders, generative visuals, pixel sorting
Look for existing tools, tutorials or code samples to generate generative visuals, then start writing from scratch.
Method(s): Experimentation, coding, prototyping, visual research, aesthetics
Topic
For example
Example application
Approach
22–23
Data Spaces
B-DC 221
Computation in Design 3
Finding a Data Space
Activity 5
8
Generative Aesthetics
Topic
Generative Aesthetics here refers to images that are generated programmatically. Through code and numeric data produced by random number generators, Perlin Noise or other similar algorithms, certain visual styles and aesthetics can be achieved which are often labeled Generative Art. Applications here can be found in audio-visual art and design, live-coding, VJing, interactive installations or NFT projects.
Challenge


22–23
Data Spaces
B-DC 221
Computation in Design 3
Finding a Data Space
Activity 5
8
Generative Aesthetics
Topic
Dive back into the world of coding and find visual aesthetics through experimentation and iteration. Start small and simple. Outcomes can be a series of static images, animations or even tools to change parameters on the fly. Visuals here can be interactive and sound-reactive, too. This is primarily a playful exploration into the aesthetics of computer generated content.
Opportunities

If your group considers to pursue this option, speak to Andreas about the technical requirements, challenges and possibilities.
Rafael Rozendaal, click image.
Andreas Gysin, click image.
22–23
Data Spaces
B-DC 221
Computation in Design 3
Finding a Data Space
Activity 5
What kind of experience is it? Is it in a room, are you sitting down, are you standing up? So many ways of doing that, and each will have a different outcome and experience. The only way to do it is trying it out and not just talk about it. Accepting the not-knowing and being uncomfortable especially at the beginning of a project. If you have done it many times you know it’s ok–I deal with it, I know at some point something will happen.
At the start of a career in Design this is very hard because you don’t know and sometimes you want all the people to tell you how to do it or you go back to something that is more familiar and that you have done before. It’s uncomfortable but after a while you know there is a lot of interesting things coming out of it and working with other people who are also comfortable with that is really interesting. A lot of design and research is about engaging with that weirdness.
Transcribed from the Near Future Laboratory Podcast #49, with designer Paulina Yurman (PhD).
Due Week 7
Homework
In your group negotiate and decide on one topic you want to work on
22–23
Data Spaces
B-DC 221
Computation in Design 3
Finding a Data Space
Activity 5
22–23
Data Spaces
B-DC 221
Computation in Design 3
Finding a Data Space
Activity 5
Data Spaces
1
2
3
4
5
6
7
8
Datavis
Quantified Self
Real-time data
Archives
Simulation
Text Prompt
Point Clouds
Generative Aesthetics
The objective for each group is to select, review and negotiate a Data Space from the options given on the right by next week.
Vikas
Vikas, Gideon
Andreas
Gideon
Gideon, Andreas
Andreas
Joanne, Vikas, Andreas, Gideon
Joanne
22–23
Data Spaces
B-DC 221
Computation in Design 3
Students work in groups (same as Urban Fieldworks?)
From a list of Data Spaces they select one (or more if undecided) which they want to work with and develop initial ideas
- how to build an understanding of chosen Data Space
- what they intend to study
- as a designer what they find interesting in that particular Data Space
- through their research students become acquainted and knowledgable in on of the given topics
Mindmap (on paper)
Visual Mood board (digital, use a grid to organise images)
other ideas?
Finding a Data Space
Activity 5
The development of ideas and formulating a concept begins with group discussions, sketches, planning, and feedback to prepare a project proposal based on chosen Data Spaces topic.
Project: briefing Data Spaces
7
22–23
Data Spaces
B-DC 221
Computation in Design 3

22–23
Data Spaces
B-DC 221
Computation in Design 3
Data Spaces Project Proposal
Prepare a project proposal that outlines background, objectives, approach and timeline to arrive at a printed or web-based publication documenting your Data Spaces artefact(s), findings and insights to be presented in week 13.
Your proposal is due week 9
Data Spaces
Project
22–23
Data Spaces
B-DC 221
Computation in Design 3
Chosen Topic
Data Spaces
Project
Project Title
Continue working towards a proposal based on topic chosen last week or take the time and opportunity today to review and change.
Discuss and negotiate a title for your project early with the option for it still to change in the process.
22–23
Data Spaces
B-DC 221
Computation in Design 3
Background
Data Spaces
Project
Formulate a short writeup that introduces your project, provide some background details that you have researched on to establish the bigger picture.
22–23
Data Spaces
B-DC 221
Computation in Design 3
Objectives
Data Spaces
Project
Define boundaries for your exploration.
22–23
Data Spaces
B-DC 221
Computation in Design 3
Approach
Data Spaces
Project
Outline methods and tools that group members will apply. Individually work on different experiments to arrive at a common outcome, an artefact or a series of artefacts. Add visual impressions or sketches that you might already have developed.
22–23
Data Spaces
B-DC 221
Computation in Design 3
Approach / Artefact
Data Spaces
Project
An artefact simply means any product of human workmanship or any object modified by man. In a design context, artefacts refer to objects that are made to convey an idea, story, or inspiration. Such artefacts can go beyond common objects such as posters, books, collages, and storyboards and extend into digital, virtual, and physical spaces.
Here, artefacts can stand out beyond a static and physical representation or commercial product and are characterised on the basis of their narrative, aesthetic, playful, interactive, exploratory, reflective, experimental or discursive values.
22–23
Data Spaces
B-DC 221
Computation in Design 3
Weekly Schedule
Data Spaces
Project
Plan the following weeks according to milestones and in-class activities.
22–23
Data Spaces
B-DC 221
Computation in Design 3
Preferred Publication Format
Data Spaces
Project
At the end of the semester, students will produce a publication (per project-group) documenting and summarising their process, findings and artefacts that they have worked on for the Data Spaces project.
This publication will be a website or a print publication. The format chosen must well document and summarise the process, your findings and the final outcome , the artefact(s), produced.
22–23
Data Spaces
B-DC 221
Computation in Design 3
Data Spaces
Project
for example
print publication


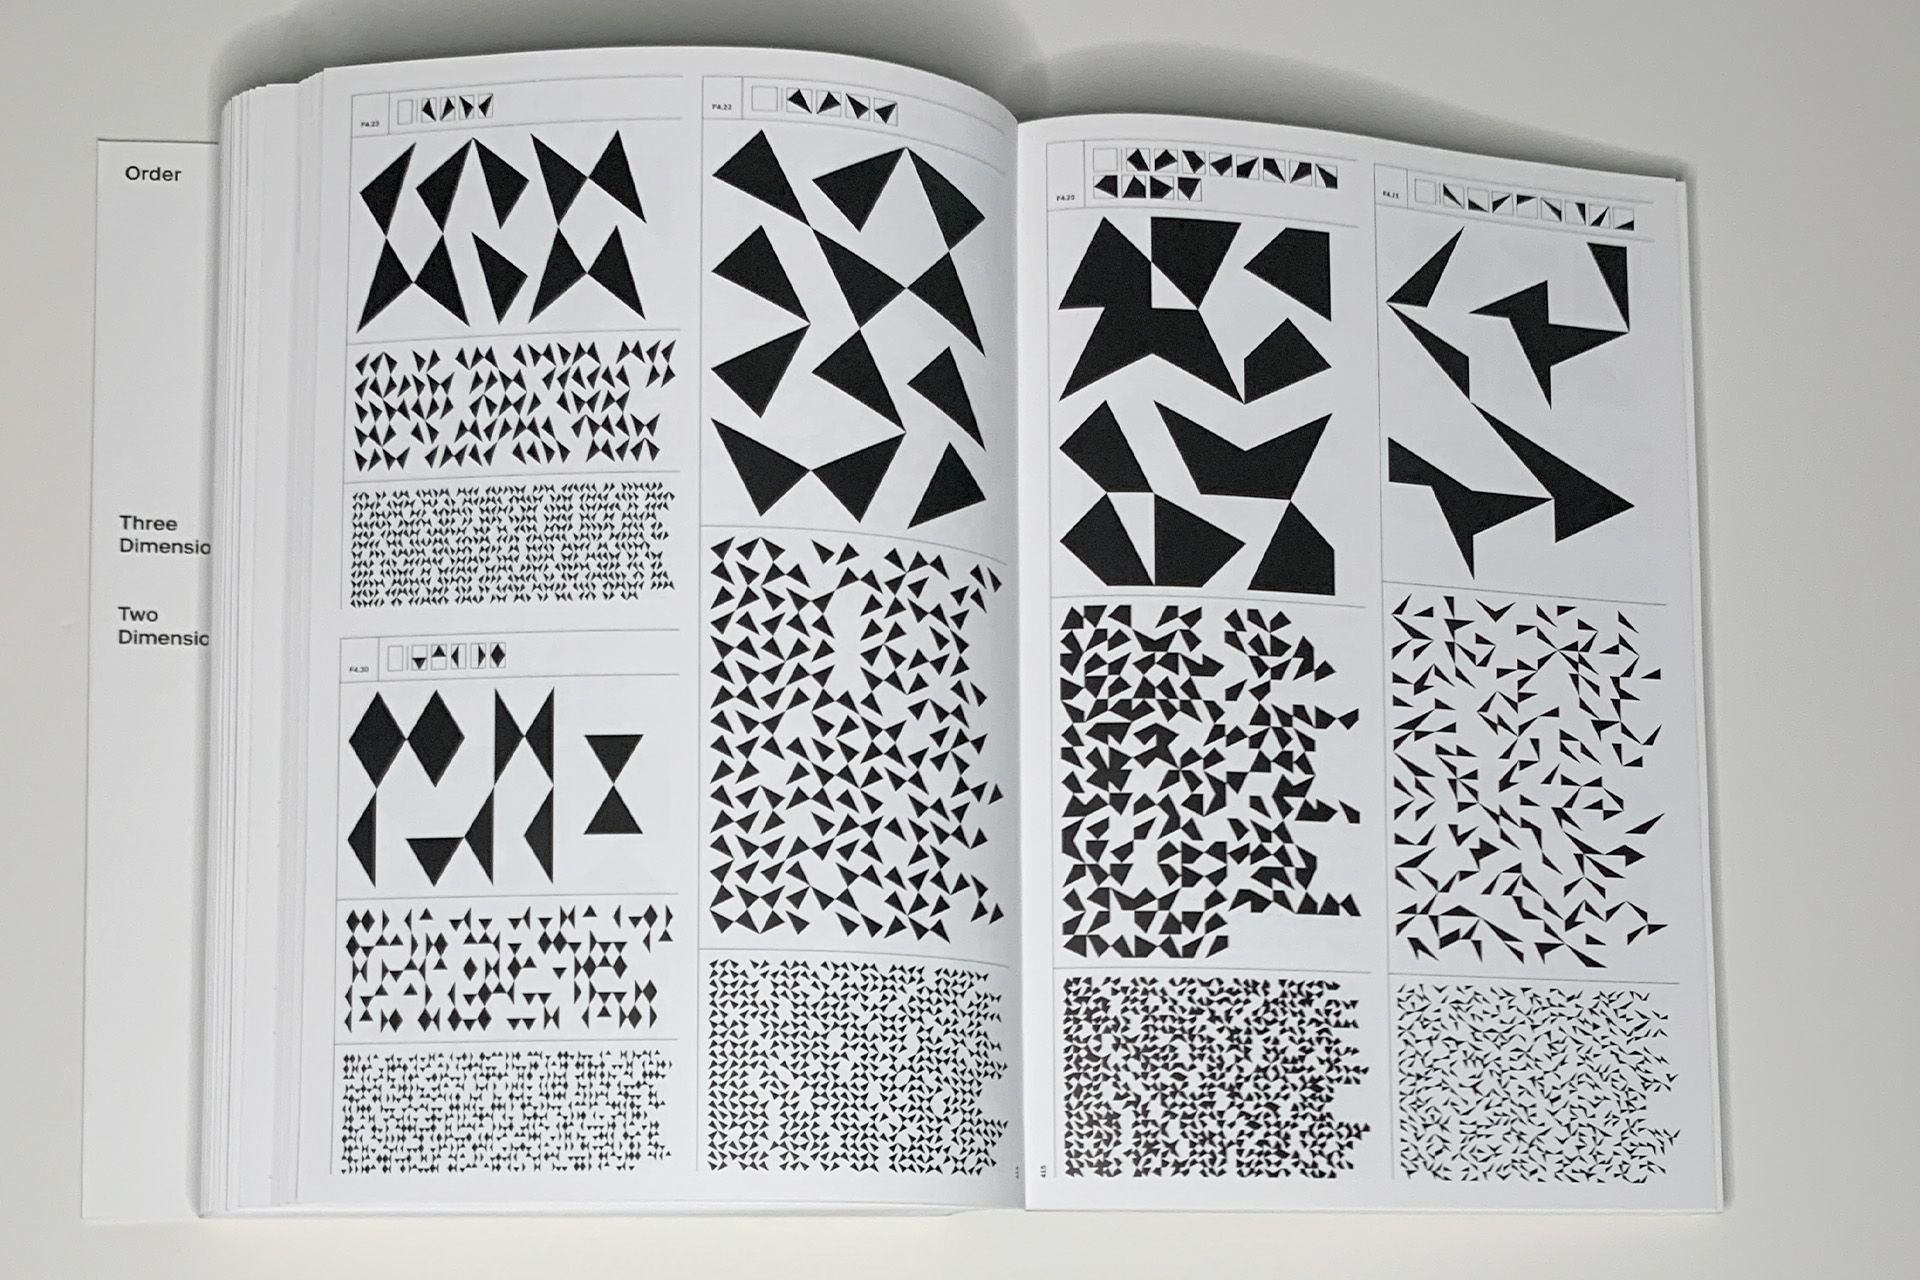

22–23
Data Spaces
B-DC 221
Computation in Design 3
Data Spaces
Project


Grid is a
must, always!
22–23
Data Spaces
B-DC 221
Computation in Design 3
Data Spaces
Project

Groundwork,
Bianca Hester
for example
print publication
22–23
Data Spaces
B-DC 221
Computation in Design 3
Data Spaces
Project
Groundwork,
Bianca Hester

for example
print publication
22–23
Data Spaces
B-DC 221
Computation in Design 3
Data Spaces
Project
Groundwork,
Bianca Hester

for example
print publication
22–23
Data Spaces
B-DC 221
Computation in Design 3
Data Spaces
Project
Blind Maps and Blue Dots,
Joost Grootens

for example
print publication
22–23
Data Spaces
B-DC 221
Computation in Design 3
Data Spaces
Project
Blind Maps and Blue Dots,
Joost Grootens

for example
print publication
22–23
Data Spaces
B-DC 221
Computation in Design 3
Data Spaces
Project
Blind Maps and Blue Dots,
Joost Grootens

for example
print publication
22–23
Data Spaces
B-DC 221
Computation in Design 3
Data Spaces
Project
R. Buckminster Fuller, Pattern Thinking,
Daniel Lopez-Perez

for example
print publication
22–23
Data Spaces
B-DC 221
Computation in Design 3
Data Spaces
Project

for example
print publication
R. Buckminster Fuller, Pattern Thinking,
Daniel Lopez-Perez
22–23
Data Spaces
B-DC 221
Computation in Design 3
Data Spaces
Project
Drawing a Hypothesis – Figures of Thought Nikolaus Gansterer
for example
print publication

22–23
Data Spaces
B-DC 221
Computation in Design 3
Data Spaces
Project
Book of Plants,
Anne Geene
for example
print publication

22–23
Data Spaces
B-DC 221
Computation in Design 3
Data Spaces
Project
Book of Plants,
Anne Geene
for example
print publication

22–23
Data Spaces
B-DC 221
Computation in Design 3
Data Spaces
Project
Book of Plants,
Anne Geene
for example
print publication

22–23
Data Spaces
B-DC 221
Computation in Design 3
Data Spaces
Project
Book of Plants,
Anne Geene
for example
print publication

22–23
Data Spaces
B-DC 221
Computation in Design 3
Data Spaces
Project
Dimension of Two,
Norm
for example
print publication

22–23
Data Spaces
B-DC 221
Computation in Design 3
Data Spaces
Project
Dimension of Two,
Norm
for example
print publication

22–23
Data Spaces
B-DC 221
Computation in Design 3
Data Spaces
Project
Dimension of Two,
Norm
for example
print publication

22–23
Data Spaces
B-DC 221
Computation in Design 3
Data Spaces
Project
Dimension of Two,
Norm
for example
print publication

22–23
Data Spaces
B-DC 221
Computation in Design 3
Data Spaces
Project
for example
web publication
22–23
Data Spaces
B-DC 221
Computation in Design 3
Data Spaces
Project
for example
web publication
22–23
Data Spaces
B-DC 221
Computation in Design 3
Data Spaces
Project
for example
web publication
22–23
Data Spaces
B-DC 221
Computation in Design 3
Data Spaces
Project
for example
web publication
22–23
Data Spaces
B-DC 221
Computation in Design 3
Data Spaces
Project
for example
web publication
22–23
Data Spaces
B-DC 221
Computation in Design 3
Data Spaces
Project
for example
web publication
Due Week 9
Homework
Project proposal based on template and instructions given, presentation slides to be presented week 9.
22–23
Data Spaces
B-DC 221
Computation in Design 3
Data Spaces
Project
22–23
Data Spaces
B-DC 221
Computation in Design 3
Project Briefing
Data Spaces
Project
Students choose from a list of Data Spaces topics to develop a self-directed project which they showcase at the end of the semester.
1
In this project assignment, you will be asked to learn to be more independent, make decisions, and develop and implement your own ideas around a given theme. The implementation leaves room for interpretation and challenges you to apply different computational techniques using digital or physical means.
22–23
Data Spaces
B-DC 221
Computation in Design 3
Data Spaces
Project
Deliverables
At the end of the semester, students will produce a publication (per project-group ) documenting and summarising their process, findings and outcomes that they have worked on for the Data Spaces project.
This publication will be a website or a print publication. The format(s) chosen must well document and summarise the process, your findings and the final outcome produced.
Website publication (with video)
OR Print publication (pdf and printed)
All progress to be documented in your Creative Process Journal (CPJ)
Publication options
Based on your proposal, in a short presentation you will share your ideas and project concept. From the feedback you receive you should be confident to move forward.
Project: sharing of ideas and experiments
9
22–23
Data Spaces
B-DC 221
Computation in Design 3

22–23
Data Spaces
B-DC 221
Computation in Design 3
Week 9, Project Presentations
D301
D501
Data Spaces
Project
We will offer consultation session to review your project development and provide feedback. This is a good opportunity to clarify any questions you may have as you move from the idea phase to the experimentation phase.
Project: consultation
11
22–23
Data Spaces
B-DC 221
Computation in Design 3

This week will be mostly self-directed and independent study. Your lecturers will be on campus in case you want to receive feedback. You are expected to further develop your experiments.
Project: development
12
22–23
Data Spaces
B-DC 221
Computation in Design 3

Deliverables for Data Spaces Project
22–23
Data Spaces
B-DC 221
Computation in Design 3
At the end of the semester, students will produce a publication (per project-group ) documenting and summarising their process, findings and artefacts that they have worked on for the Data Spaces project.
This publication will be a website or a print publication. The format(s) chosen must well document and summarise the process, your findings and the final outcome produced.
All activities to be documented in your Creative Process Journal (CPJ).
Website publication (with video)
OR
Print publication (pdf and printed)
Outcome to be delivered, choose between the following 2 options.
Data Spaces
Project
Deliverables for Data Spaces Project
22–23
Data Spaces
B-DC 221
Computation in Design 3
Option Website publication (with video)
Build a website with html, css and javascript to be hosted on netlify.com
Link and website source files to be submitted
Website builders like cargo, readymag, webflow, etc should not be used and can't be accepted as submitted deliverable.
Custom website, single or multi-page, with html, css (and javascript where necessary). A template can be provided, but you should use your html and ccs skills acquired in the DST course. Please see the design examples from week 7.
Data Spaces
Project
Deliverables for Data Spaces Project
22–23
Data Spaces
B-DC 221
Computation in Design 3
Option Print publication (pdf and printed)
submitted as pdf and printed
Please review the design examples from week 7 as a reference point.
Format between B5 and A4, portrait or landscape
Be considerate about paper choices and binding techniques
Data Spaces
Project
22–23
Data Spaces
B-DC 221
Computation in Design 3
Content structure for publication
Data Spaces
Project
1 Process documentation
What you did over the duration of the project. Document and summarise the process in stages from ideation to initial testing and final outcomes with annotated images (videos or sketches for web publication).
2 Findings and Insights
How you made sense of what you were making, mistakes included. For a detailed break down see following slides (applies to both publication options).
3 Outcomes
Selection of images, videos and, if applicable, p5js sketches that present your results in a high-quality and polished manner and format.
22–23
Data Spaces
B-DC 221
Computation in Design 3
2 Findings and Insights
Data Spaces
Project
2.1 Description
Briefly describe and contextualise the data topic and the data you have chosen to work with so that the reader has a better understanding of what they are reading and looking at. (~100 words supported by images, video, other media where applicable)
2.2 Findings and Insights
In a brief written reflection you contextualise and share your thoughts addressing why you have chosen a particular topic and data, what informed your ideation and design decisions, what did the data tell you and what did you intend to communicate to the reader with your project. (~120 words supported by images, video, other media where applicable)
2.3 Design Decisions
Design decisions can relate to, for example, aesthetics, visual elements, colours, layout, typography and fonts used, animations or interactivity that you have chosen to use. Tell the reader about it. (~100 words supported by images, video, other media where applicable)
2.4 Challenges
Talk a bit about the challenges you have encountered and how you resolved them. This can address technical, group-related and other challenges. (~100 words supported by images, video, other media where applicable)
Content structure for publication
22–23
Data Spaces
B-DC 221
Computation in Design 3
2 Findings and Insights
Data Spaces
Project
2.5 Feedback
Talk about the feedback you go from others that you shared your work with. Here for example address overall impression of project outcomes, publication, interpretation of topic, aesthetics, visuals, readability (~100 words supported by images, video, other media where applicable)
2.6 Achievements
Talk a bit about your achievements from a team's perspective and outcomes produced. (~80 words supported by images, video, other media where applicable)
To summarise, your publication will include the following 3 sections
1 Process
2 Findings and Insights
3 Outcomes
3 Outcomes
Selection of images, videos and, if applicable, p5js sketches that present your results in a high-quality and polished manner and format.
Content structure for publication
Deadlines
22–23
Data Spaces
B-DC 221
Computation in Design 3
Week 14
Show and tell; project presentation. Students can show their publication draft to receive feedback.
Submission of final publication
Option Web: link and source files
Option Print: pdf and printed
Data Spaces
Project
Week 16
To better understand how your work is progressing, we will conduct a work check, do bring all necessary materials to your consultation so we can help you to progress to the next stage of your project, presentation and documentation.
Project: work check
13
22–23
Data Spaces
B-DC 221
Computation in Design 3
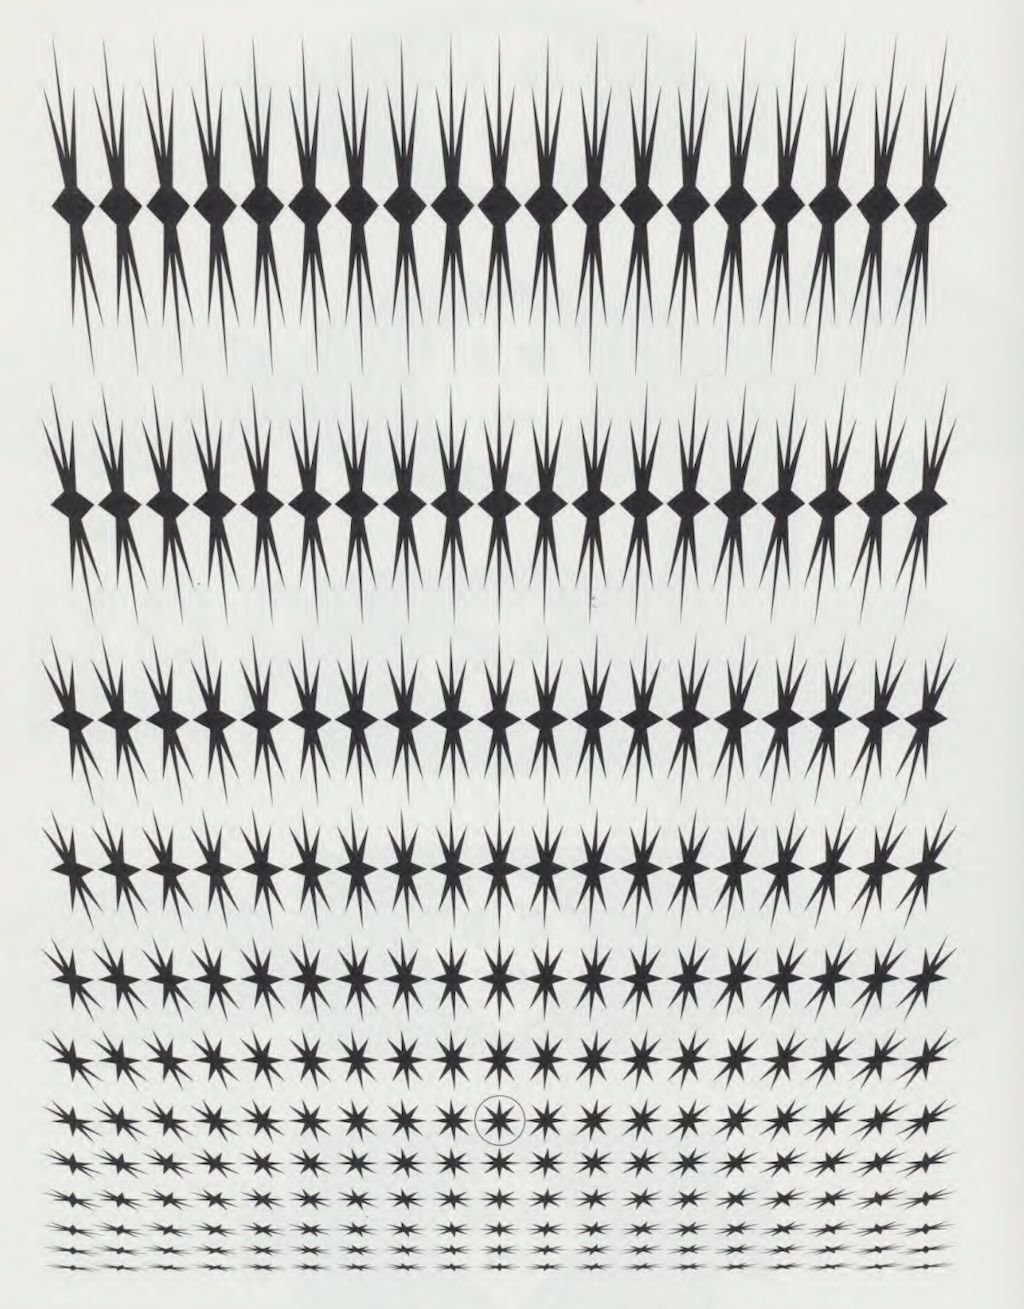
22–23
Data Spaces
B-DC 221
Computation in Design 3
Data Spaces
Project
This is our last shared session prior to your independent study and submission. We ask that all projects be physically set up and presented so that we can view and discuss them with you.
Project: show and tell
14
22–23
Data Spaces
B-DC 221
Computation in Design 3

Work independently on your project, focusing on your documentation and submission preparation. In urgent cases or if you need help, there will be a non-compulsory clinic session during this week.
Project: independent study
15
22–23
Data Spaces
B-DC 221
Computation in Design 3
This week it is best to prepare for submission.
Project: independent study
15
22–23
Data Spaces
B-DC 221
Computation in Design 3

