Earthsys 144: Fundamentals of GIScience
Remote Sensing
where is your data? gis.stanford.edu
Remotely-sensed data

aerial imagery


aerial imagery
Gaspar Felix Tournachon, more commonly known as “Nadar,” is credited with taking the first successful aerial photograph in 1858 from a hot air balloon tethered 262 feet over Petit-Bicêtre (now Petit-Clamart), just outside Paris; his original photos have been lost.

aerial imagery
“Boston, as the Eagle and the Wild Goose See It”
October 13, 1860
by
James Wallace Black is the earliest surviving aerial photograph.
Credit: James Wallace Black, The Metropolitan Museum of Art.

aerial imagery

Photograph of San Francisco in ruins from Lawrence Captive Airship, 2000 feet above San Francisco Bay overlooking water front. Sunset over Golden Gate circa 1906
George Lawrence—Prints & Photographs Divison/Library of Congress
aerial imagery


satellite imagery
First image of Earth from outer space, taken by the V-2 No. 13 suborbital spaceflight.
October 24, 1946


The first crude image taken by a satellite, Explorer 6, shows a sunlit area of the Central Pacific Ocean and its cloud cover. The photo was taken when the satellite was about 17,000 mi (27,000 km) above the surface of the earth on August 14, 1959. At the time, the satellite was crossing Mexico.

Corona Program


Corona Program

Mission 13
August 1960
In one mission, Corona imaged 1.5 million square miles of Soviet territory. It revealed 64 new Soviet airfields and 26 missile sites.
Corona satellites would go on to fly more than 130 missions, taking more than 800,000 photographs of the entire Soviet Union and much of the world.
Landsat

the value of remote sensing data
broad coverage

spectral range

geometric accuracy

permanent recording

Dallas - Fort Worth area of Texas on July 25, 1972
permanent recording

Imaging Systems
passive systems

image scanners

active systems

geophysical prospecting


imagery properties
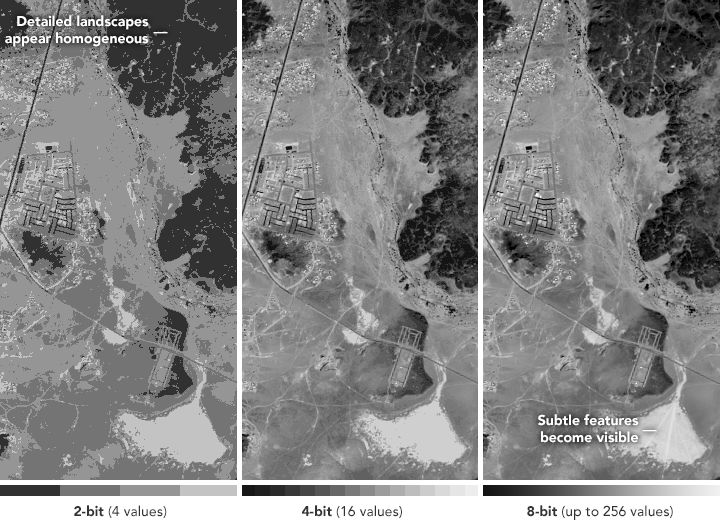
Radiometric Resolution

Spectral Resolution
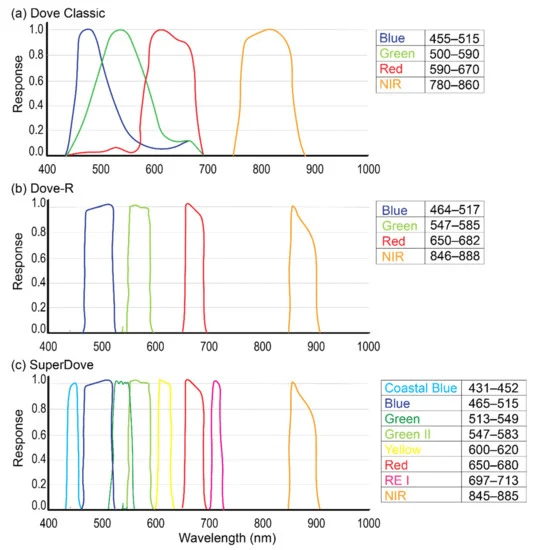
spectral curves


Cadence (Revisit Rates)
- Landsat - 16 days
- Sentinel 2 - 10 days at the equator, 2-3 at mid-latitudes
- Planetscope Doves - Daily
- MAXAR/SkySat/Pelican - varies, tasked

image enhancement


stretching & clipping
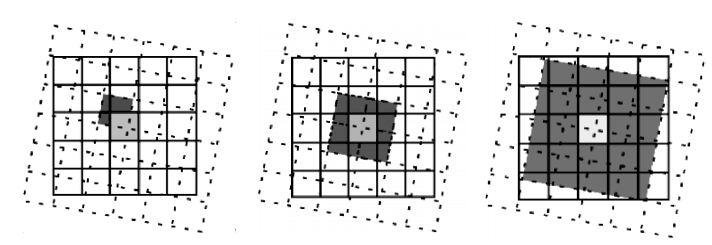
rendering methods


Nearest Neighbor
Bilinear Interpolation
Cubic Convolution
pan-sharpening


imagery interpretation
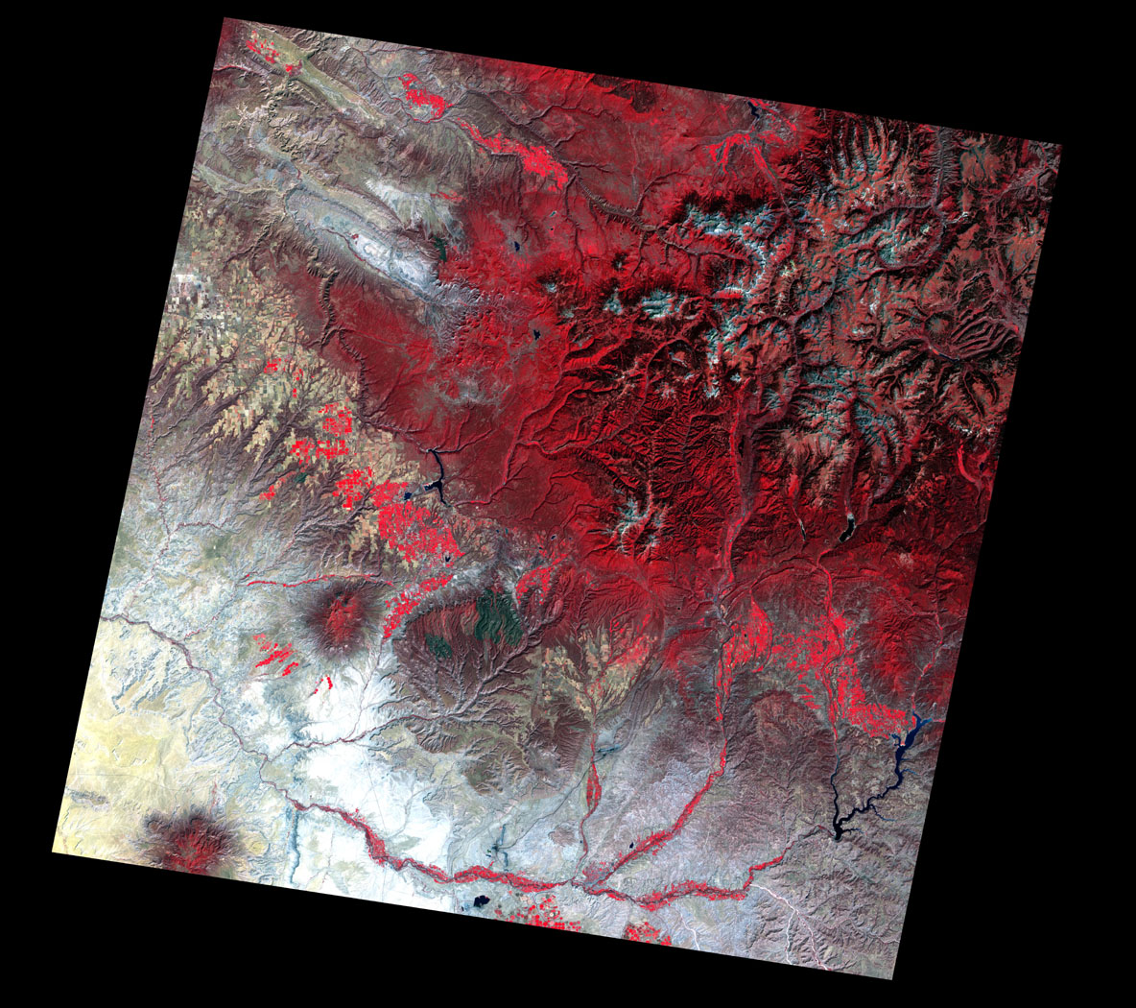
Band Combinations

visible
infrared

8-bit color

Band Combinations

Band Combinations

Bands 3,2,1

Bands 4,3,2
Bands 7,4,2


Band Math (Indices)

Normalized Difference Vegetation Index (NDVI) = (NIR - R) / (NIR + R)


Panel Index Purpose Interpretation
1. Natural Composite |
R-G-B (True Color) |
Human-eye view |
Good for general orientation, but limited in analytical value. |
2. NDVI(Normalized Difference Vegetation Index) |
(NIR − R) / (NIR + R) |
Plant vigor and density |
Bright areas = healthy vegetation; dark = sparse or urban. |
3. SAVI(Soil-Adjusted Vegetation Index) |
1.5 × (NIR − R)/(NIR + R + 0.5) |
NDVI + soil brightness correction |
Improves vegetation contrast in low-canopy or bare-soil zones. |
Panel Index Purpose Interpretation
| 4. EVI(Enhanced Vegetation Index) | 2.5 × (NIR − R) / (NIR + 6R − 7.5B + 1) | Reduces atmospheric & soil noise | More nuanced vegetation health; sensitive to canopy structure. |
| 5. NDRE(Normalized Difference Red Edge) | (NIR − RE) / (NIR + RE) | Chlorophyll concentration | Excellent for later-stage crop monitoring and stress detection. |
| 6. NGRDI(Normalized Green-Red Difference Index) | (G − R) / (G + R) | Quick vegetation index using only visible bands | Useful when NIR isn’t available—more sensitive to chlorosis. |
Panel Index Purpose Interpretation
| 7. MNDWI(Modified Normalized Difference Water Index) | (G − SWIR1) / (G + SWIR1) | Water delineation | High = open water, dark = land; vegetation & soil are suppressed. |
| 8. NDBI(Normalized Difference Built-up Index) | (SWIR − NIR) / (SWIR + NIR) | Urban and impervious surface detection | Red areas = built-up zones; vegetation appears dark. |
| 9. NDSI(Normalized Difference Soil Index) | (SWIR2 − B) / (SWIR2 + B) | Bare soil & sand mapping | High values = bare earth or dry land; useful in ag and arid zones. |

Landcover Classification

Landcover Classification

Commonly used algorithms for supervised classification in remote sensing, include:
random forest (RF)
artificial neural networks (ANN)
support vector machines (SVM)
change detection

2001
2006
2011

FINISH THE MIDTERM!!!
closes tonight at midnight!