Aprèn a editar infografies i mapes interactius


Eli Vivas
eli@storydata.cat
Twitter @eli_vivas | @storydatabcn
IG @storydata

sessió 1
Infografía vs Dataviz
Definición infografía
-
Infografía
De Infographie®, marca reg.
1. f. Técnica de elaboración de imágenes mediante computadora.
2. f. Imagen obtenida por infografía.
3. f. Representación gráfica que apoya una información de prensa.
Real Academia Española
Storytelling and Data Visualization
Infografía


Germanwings flight-Inconsolata
Storytelling and Data Visualization

Storytelling and Data Visualization
Visualización de datos
A graphical representation of data or concepts, which is either an internal construct of the mind or an external artifact supporting decision making
C. Ware 2000
Storytelling and Data Visualization
Visualización de datos


Translation of raw data to a visual context
Storytelling and Data Visualization

Charles Minard, 1869
Storytelling and Data Visualization
Visualización de datos


Storytelling and Data Visualization
Visualización de datos

Storytelling and Data Visualization
Visualización de datos
¿Para qué sirve?
- detectar patrones
- interacción
- explorar
- personalizar
- analizar en profundidad
Storytelling and Data Visualization
1.- Tipos de
Data Visualizations

Storytelling and Data Visualization
1.- Tipos de
Data Visualizations
Storytelling and Data Visualization

2. Color (existe otro código, y no es un lenguaje de programación)

Storytelling and Data Visualization
- No más de 7 colores en un chart
- El gris, tu mejor amigo
- Usa colores intuitivos (pero huye de los estereotipos Men-Women)
- Usa paletas de colores; funcioan


2. USO DEL COLOR
Storytelling and Data Visualization
Infographics and Data Visualization
2. USO DEL COLOR


3. Resalta lo importante
(quieres explicarlo todo, pero no satures al personal)


Storytelling and Data Visualization
Storytelling and Data Visualization
2 4 3 5 6 4 3 7 6 5 3
4 3 4 5 4 1 3 2 8 9 7
5 4 6 7 2 1 5 0 6 5 4
2 6 7 8 9 3 1 2 4 0 1
5 3 4 0 9 2 5 4 7 7 2
5 4 1 1 2 0 9 0 9 5 6
2 4 3 5 6 4 3 7 6 5 3
4 3 4 5 4 1 3 2 8 9 7
5 4 6 7 2 1 5 0 6 5 4
2 6 7 8 9 3 1 2 4 0 1
5 3 4 0 9 2 5 4 7 7 2
5 4 1 1 2 0 9 0 9 5 6
2 4 3 5 6 4 3 7 6 5 3
4 3 4 5 4 1 3 2 8 9 7
5 4 6 7 2 1 5 0 6 5 4
2 6 7 8 9 3 1 2 4 0 1
5 3 4 0 9 2 5 4 7 7 2
5 4 1 1 2 0 9 0 9 5 6
Título (descripcion del gráfico)
Subtítulo (años, medidas)
Fuente. Autor. ** Notas
3. No te olvides nada
Storytelling and Data Visualization

Awesome title
Subtitle that contextualizes
Axis text
Axis text
Axis text
Axis text
Axis text
Axis text
Axis text
Caption with the source and who created the chart. Notes if necessary
Legend text
Legend text
Legend title
Axis y title
Axis x title
Storytelling and Data Visualization

4. Añade contexto
Storytelling and Data Visualization
4. Añade contexto
Source: Google News Timeline
Miedos públicos en los medios
Swine Flu
Bird Flu
Killer Wasps
Apocalypse
2000
Storytelling and Data Visualization
5. Juega con la tipografía (pero hasta cierto punto)
- Define UNA tipografía (o habla con el jefe de diseño)
- Juega con los estilos para fijar LA ATENCIÓN
- Jerarquiza la información por el tamaño
Storytelling and Data Visualization
Storytelling and Data Visualization
"Think about subway maps, which are abstracted from the complex shape of the city and are focused on the rider’s goal: to get from one place to the next"
Visualizing Data by Ben Fry
5. Haz lo complejo, simple
Storytelling and Data Visualization

Medium Infogram
5. Haz lo complejo, simple
6. Alinea todo con todo
(y ordena, ordena, ordena)

Storytelling and Data Visualization
...si puedes
6. Alinea todo con todo
(y ordena, ordena, ordena)
Storytelling and Data Visualization

...si puedes


Medium Infogram
7. EMPIEZA EL AXIS EN 0
Storytelling and Data Visualization

via Víctor Pascual
8. ¡OJO CON LAS COMPARACIONES!
Storytelling and Data Visualization

via Víctor Pascual
Storytelling and Data Visualization

via Víctor Pascual
Storytelling and Data Visualization

via Víctor Pascual
Storytelling and Data Visualization

via Víctor Pascual
Storytelling and Data Visualization
Storytelling and Data Visualization

2021
54,8%
2013
16,2%
Tráfico para móbil:
9. MOBILE FIRST
SIn código & gratis & fáciles
NO CODING & FREE &
NOT THAT EASY


con código & gratis & difíciles


10.-Herramientas

Storytelling and Data Visualization
¿Y esto, cómo se hace?
1 ejercicio
Loguéate en Datawrapper
Storytelling and Data Visualization
Storytelling and Data Visualization
Si lo prefieres más fácil
La solución está aquí debajo
(no hagas click -si puedes- hasta que acabes)
Storytelling and Data Visualization
sessió 2
¿Quin districte o barri de Barcelona té més restaurants?
Representa-ho en un gràfic
MAPAS
TIPOS

PUNTOS

COROPLETAS
BURBUJAS

CALOR


FLUJOS

HEX BINING
Storytelling and Data Visualization
MAPAS
| Latitude | Longitude | name |
|---|---|---|
| 42.061201860 | -0.490321024 | point1 |
| 38.887787884 | -1.537996281 | point2 |
| 38.696322447 | -9.137571576 | point3 |
| geometry | name |
|---|---|
| polygon | region1 |
| multipolygon | region2 |
| polygon | region3 |
Storytelling and Data Visualization
Storytelling and Data Visualization
MAPAS
Los datos geoespaciales dibujan puntos o formas, y almacenan información para cada uno de estos puntos o regiones


Puntos
Storytelling and Data Visualization
Geolocalizar
- Latitud
- Longitud
Storytelling and Data Visualization
Complementos cuando no hay datos geolocalizados
- Geocode cells
- Zgeocode
- =CONCATENATE(
Storytelling and Data Visualization
Prueba con las direcciones de los animales domésticos de Gavà
Coropletas
Storytelling and Data Visualization
Geoportal
Geoportal

Estáticos
Ilustrator
Formatos
- .ai
- .svg
- .png
- .jpg
Estáticos

Transformar para móvil (svg)


Otros recursos
· Statistics Division of the UN:
http://data.un.org/
· Google Dataset Search:
https://datasetsearch.research.google.com/
· WHO Database:
https://www.who.int/data
· National Stastistics Institute:
https://www.ine.es/
· Kaggle:
https://www.kaggle.com/
Fuentes de datos

Storytelling and Data Visualization
· The World Bank
https://maps.worldbank.org/
Datos geospaciales
· Map SVG:
https://mapsvg.com/maps/world
· Geographical Institutes websites / Open Data:
http://centrodedescargas.cnig.es/CentroDescargas/index.jsp
Gráficos con Flourish

Storytelling and Data Visualization
- Herramienta muy versátil
- El proceso de aprendizaje es muy ràpido
- Se puede integrar en una web y en móbil
- Experiencia de usuario -> permite la exploración por parte del usuario
- Narración guiada -> explorar de forma guiada a través de las Stories
- Plugin de Canva para integrar graficos de Flourish en las presentaciones
¿Por qué Flourish?
Mil mujeres asesinadas (RTVELab)
https://lab.rtve.es/mil-mujeres-asesinadas/datos/
Singapore Societies (Kontinentalist)
http://v1.kontinentalist.com.s3-website-ap-southeast-1.amazonaws.com/stories/singapore-registered-and-secret-societies-history-19th-century-data/
The origins of Coffe in Asia (Kontinentalist)
https://kontinentalist.com/stories/are-coffee-trade-markets-in-asia-sustainable-and-ethical
Listas de espera (Newtral)
https://www.newtral.es/especiales/listas-de-espera-en-sanidad/
Proyectos con Flourish
mapa barris
sessió 3
- Presentacions amb Slides
- Gràfics amb Flourish
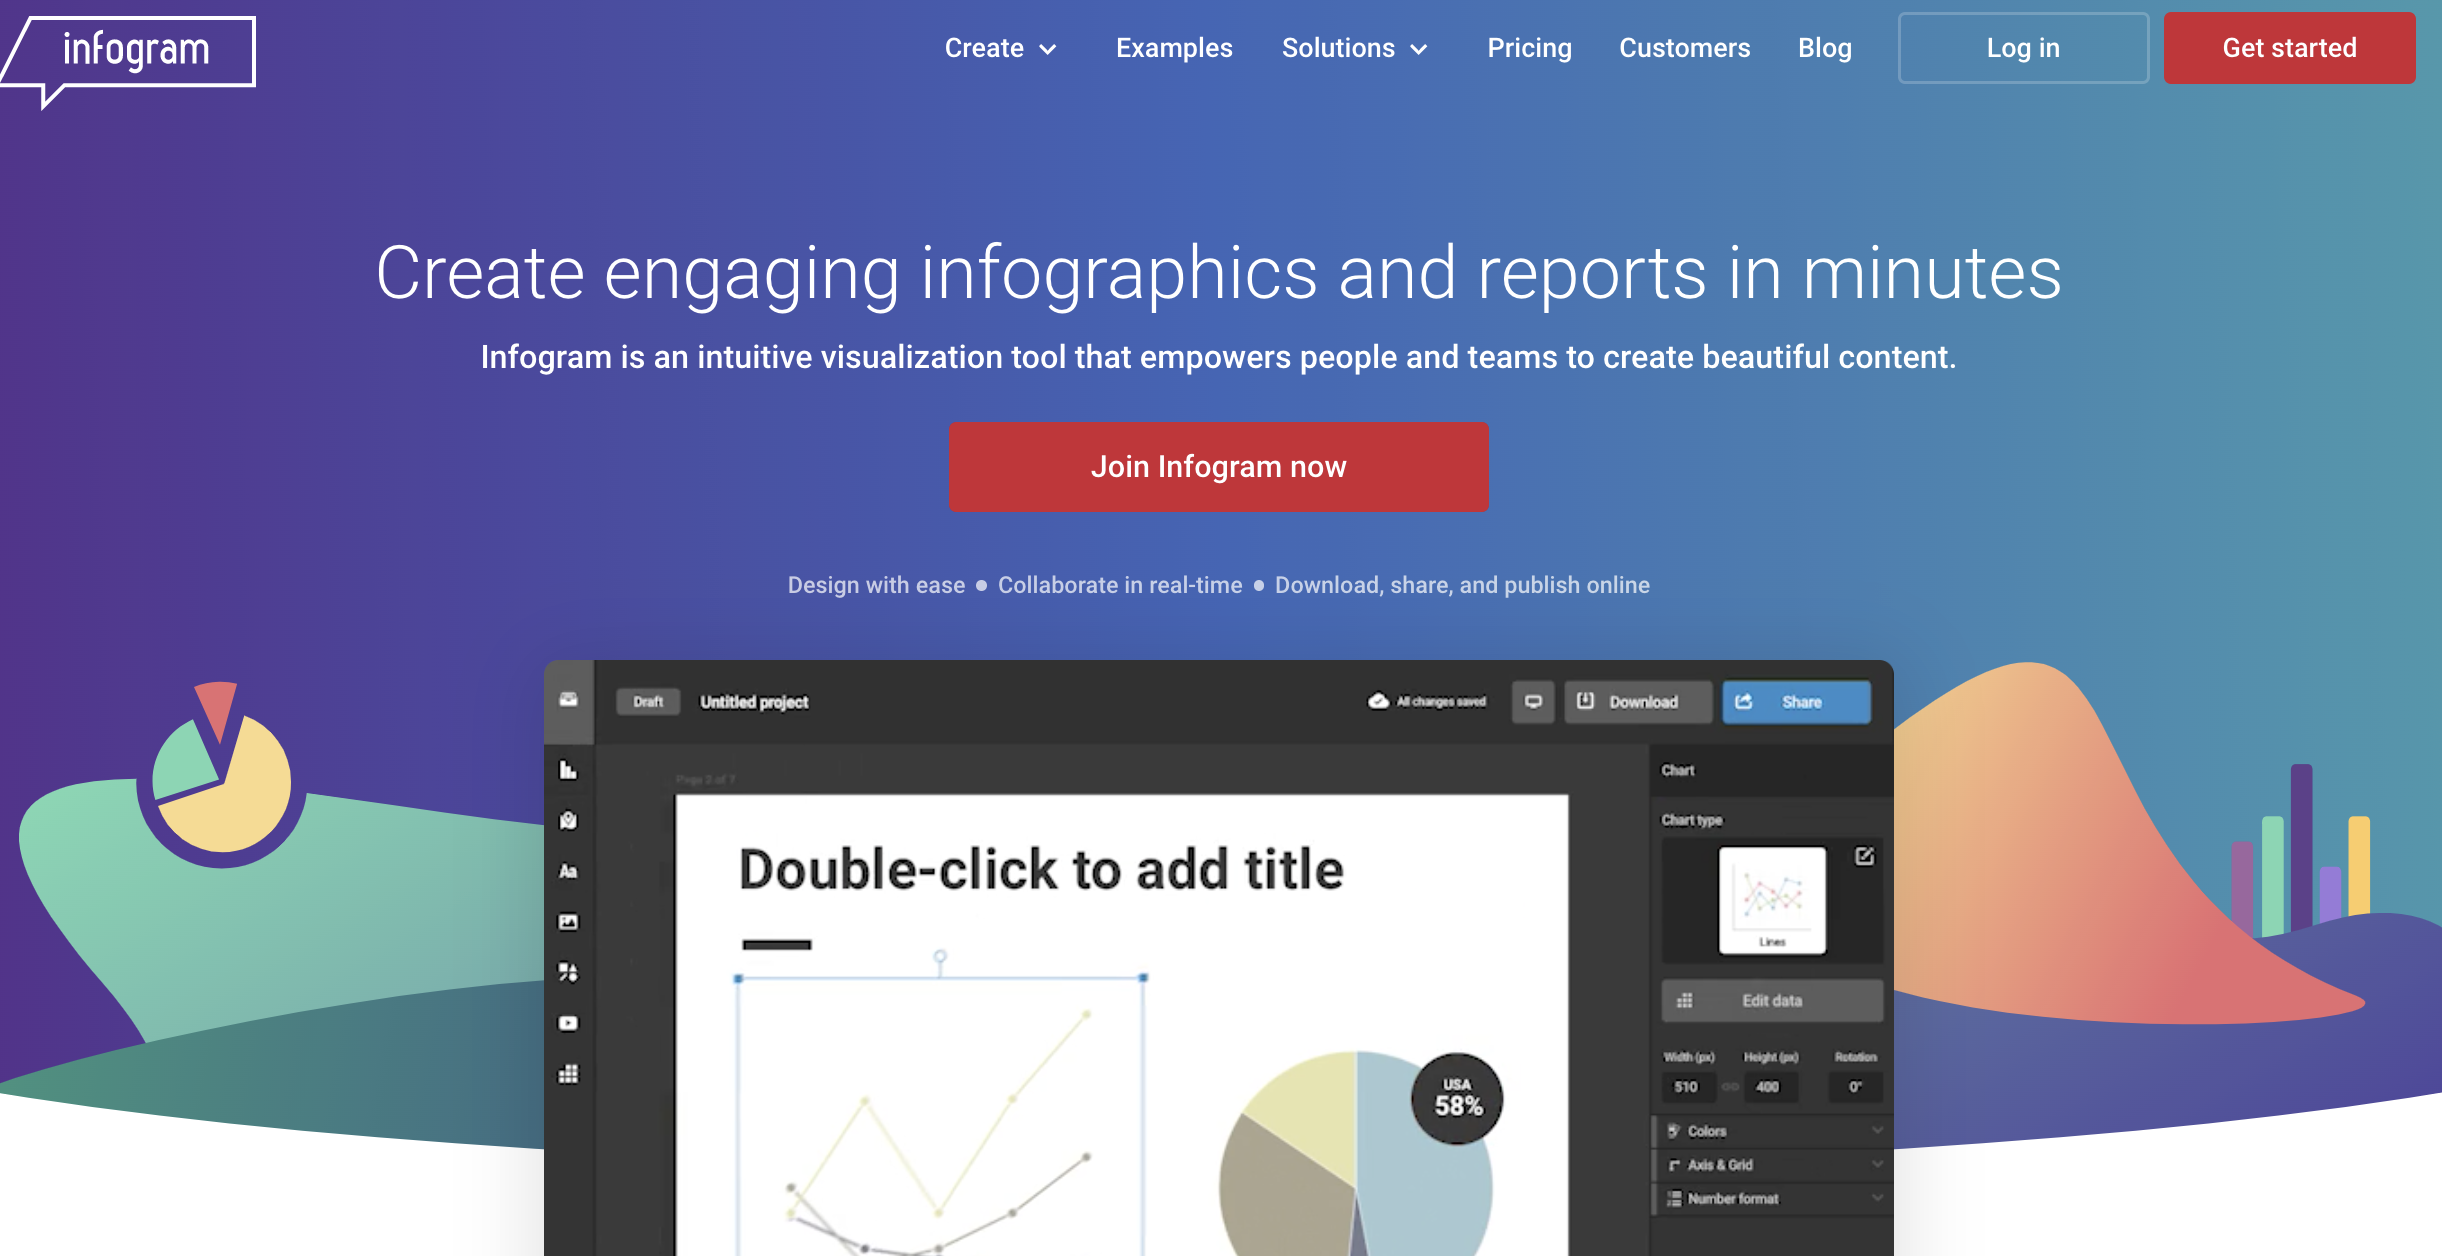
- Infogram
- Obtenir les dades
- Creació del projecte
- Afegir objectes i customitzar
Estructura
Teoria
Práctica
45'
2h
- Tipus
- Dashboards i principis gràfics
- Pictogrames per no dissenyadors

- Par explicar alguna cosa complicada, o tècnica

- Recursos gráficos que resumeixen de forma senzilla i atractiva una gran quantitat d'informació.
Infografies


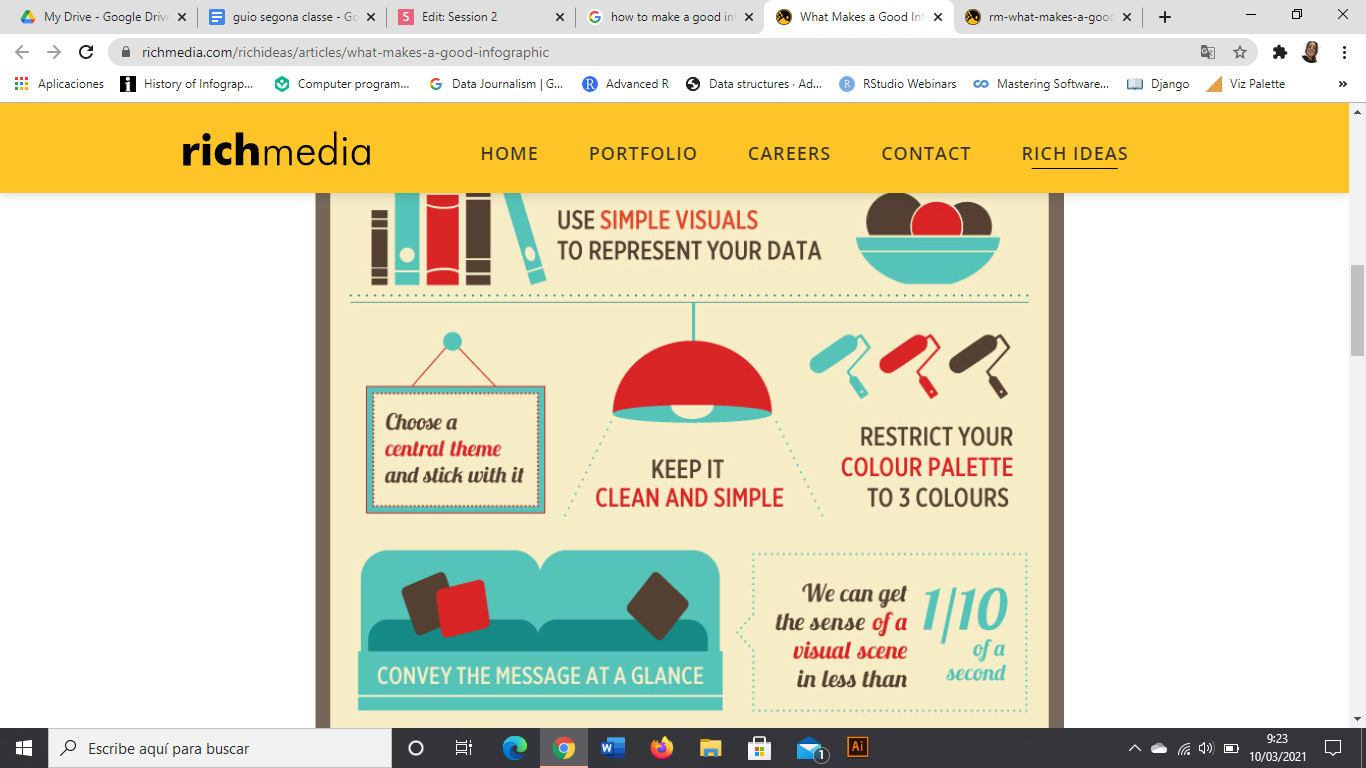

EXPLICAR UNA HISTORIA
BEN ESTRUCTURADA
VISUALMENT ATRACTIVA
MEMORABLE

Estàtic
Interactiu
Dinàmic

Categories
Títol
Cos
Peu
Parts
Estadístics

Tipus


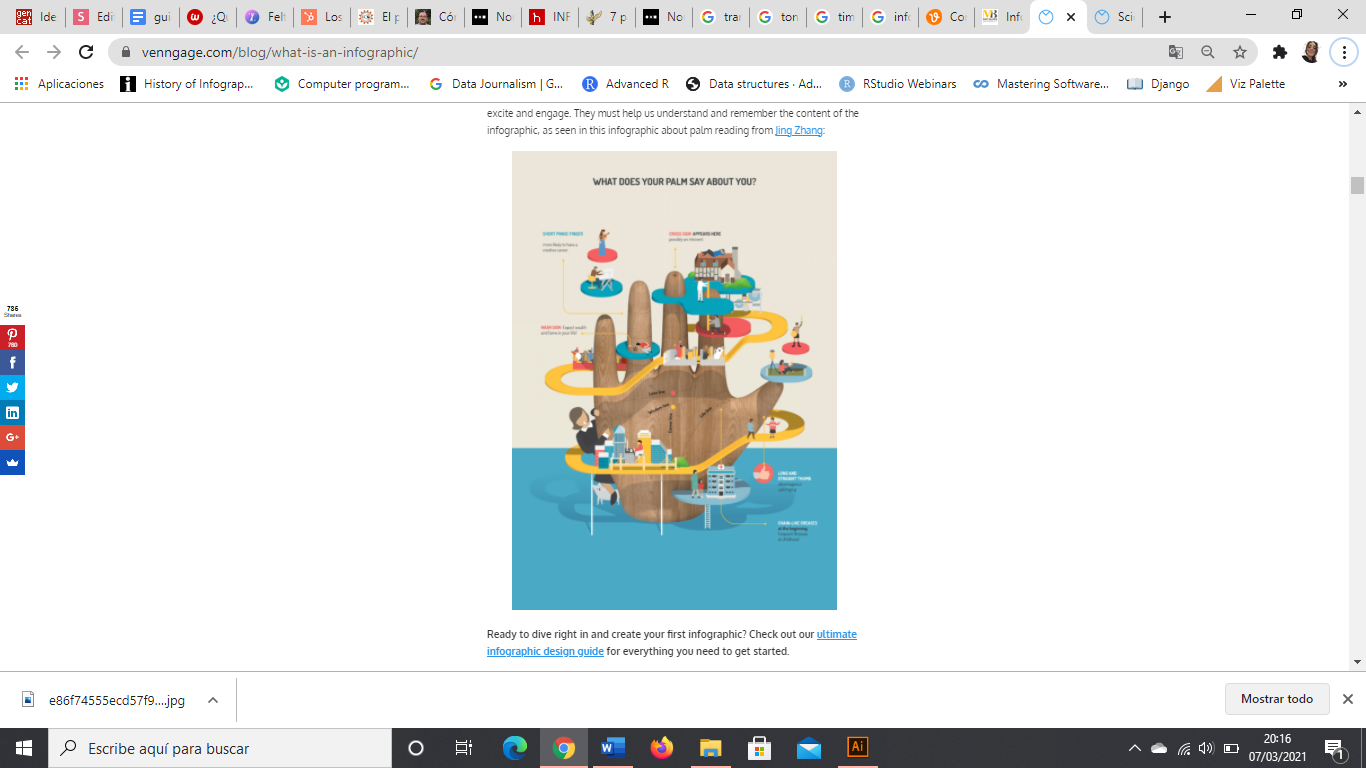
Jing Zhang

Venngage
Informatius
Tipus


Venngage
Timeline
Tipus


Procés
Tipus
Nigel Holmes
goodwaydesign

David McCandless
Comparatius
Tipus
FOOTER


Llista
Tipus
1
3
Idea o tema
Audiència
Estructura
Informació
Afegeix valor
Disseny


Com començar
1
3
SESSION 2
FOOTER
Aigua de l'aixeta a Bcn
Aigua de l'aixeta a Bcn
Beure aigua a Bcn
Aigua de l'aixeta al món
WORLD MAP
Problemes
Estructura
- Significat propi
- Poc text
- Coherència gràfica
- Legibilitat

Dissenyar conceptes


El teu torn

EL TEU TORN
2.- Fes el mateix amb Infogram.
Gràcies
eli@storydata.cat
Twitter @eli_vivas | @storydatabcn
IG @storydata