Applied
Microeconomics
Lecture 10
BE 300
Sugar Import Case
Market Intervention: Sugar Import Quotas
- Political & Economic Context of Trade Barriers
- Sugar Import Quotas Case
- Free Trade
- Autarky
- Binding Quota
- Welfare Analysis: PS, CS, DWL
Sugar Import Case
Trade Restrictions
Despite the benefits of international trade, most countries have had trade barriers (or “closed economies”) over most of their histories
- Quota: A quota imposed by Country A is a restriction on the quantity of a certain good that can be imported into Country A
- Tariff: A tariff is a tax imposed by Country A per unit of a good imported into Country A
Trade Restrictions
These restrictions are particularly common -- and costly -- in agriculture.
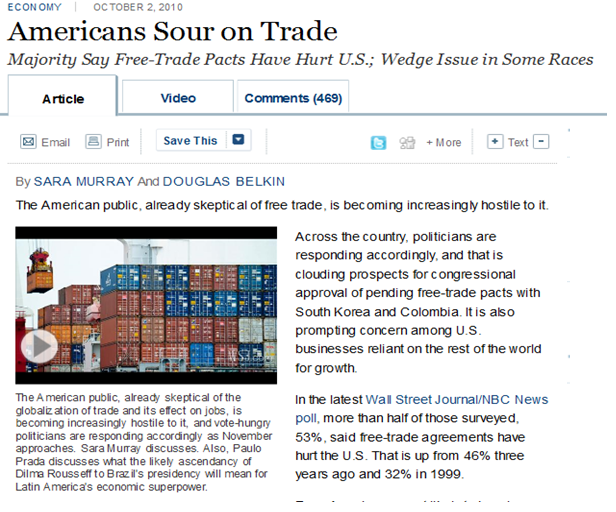
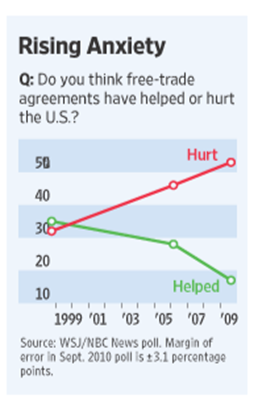
Big Sugar Holds Sway in Congress
The controversial sugar price-support program — which restricts foreign imports to prop up domestic prices and keep the industry alive — is . . . headed for passage in the U.S. Senate . . .
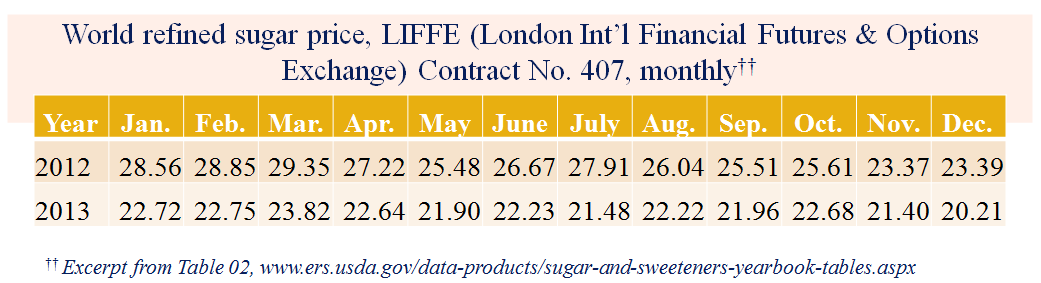
•Critics . . . say the program artificially raises sugar prices — sometimes to nearly double the world market price . . .
- Consumer advocates — citing a study last year by agriculture economic experts at Iowa State University — estimate that ending price supports would save consumers $3.5 billion a year.
-
The cost is largely hidden because it may amount to a few cents per shopping trip. The Iowa State study estimated that the sugar program costs the average consumer $9 to $11 per year, or about $40 for a family of four.
Source: http://articles.sun-sentinel.com/2012-06-13/news/fl-sugar-price-supports-continued-20120612_1_sugar-prices-consumer-prices-sugar-growers
Current Sugar Quotas
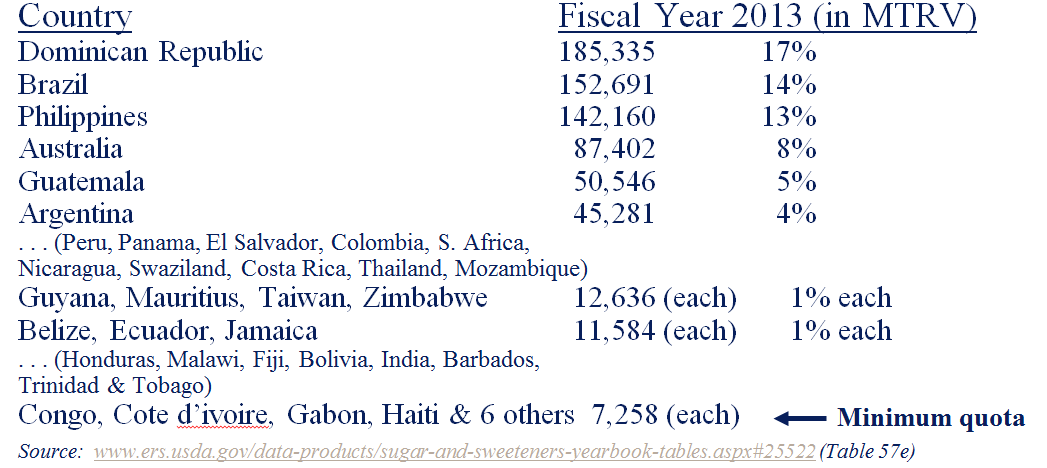
The U.S. Dep’t. of Agriculture on Sept. 12 (2013) set the 2013 – 2014 raw and refined sugar import tariff-rate-quotas .... at 1,117,195 metric tons raw value (MTRV). . . The Office of the U.S. Trade Representative is allocating the raw cane sugar TRQ to the following [40] countries. . .
Current Sugar Quotas
Sugar Quotas in the News
Summary: Sugar Quota Case Data
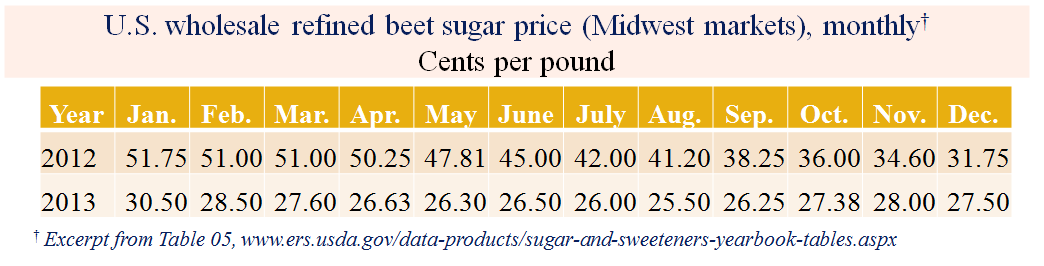
•Pre-quota Price per cwt. = $12 (or 12¢ per pound)
•Pre-quota QD = QS (total) = 220 million cwt
•Pre-quota U.S. production = QS (US) = 132 million cwt
•Pre-quota Imports = QS (I) = 88 million cwt
•Elasticity of Demand = – 0.05
•Elasticity of Supply= 0.4
Sugar is a homogeneous good (cane same as beet)
U.S. demand for sugar is about 4% of world production
Sugar Case
Before we can do any analysis, we need to find the supply and demand curves--how do we do that?
Sugar Case
Sugar Case
What does the world supply of sugar look like from the point of view of the U.S. market, if the U.S. market is small compared to the world market?
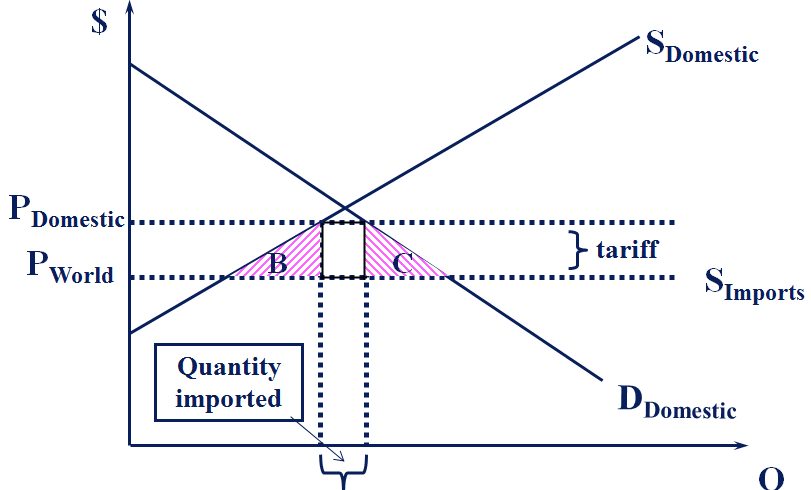
What does it look like when we graph the curves--domestic supply, domestic demand, and supply from the world market?
Sugar Case
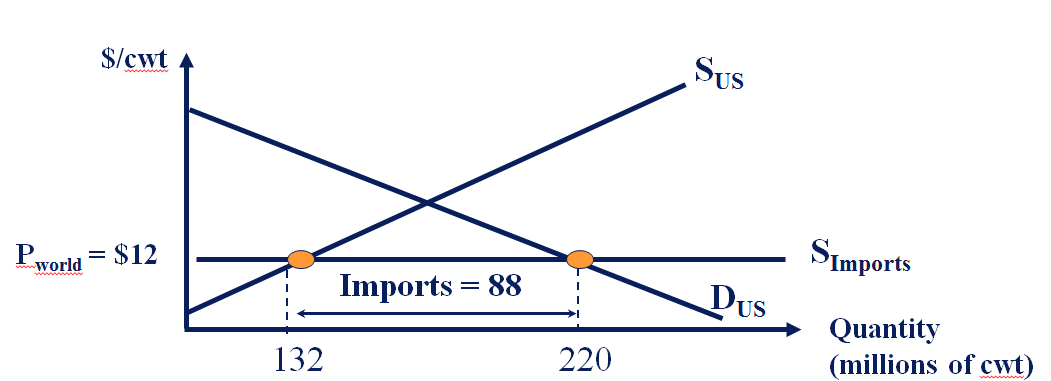
At a price of $12, domestic suppliers only want to supply 132 mill cwt. But, US consumers want to buy 220 mill cwt. The difference is made up by imports.
Where is (domestic) producer surplus?
Where is consumer surplus?
Sugar Case
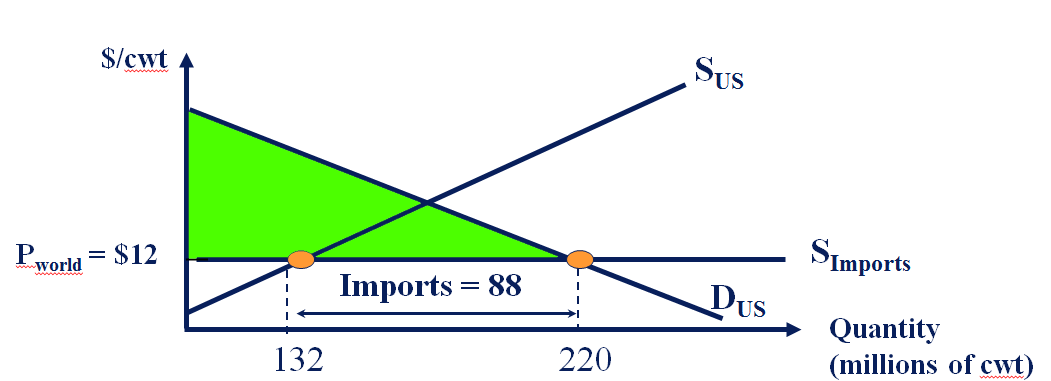
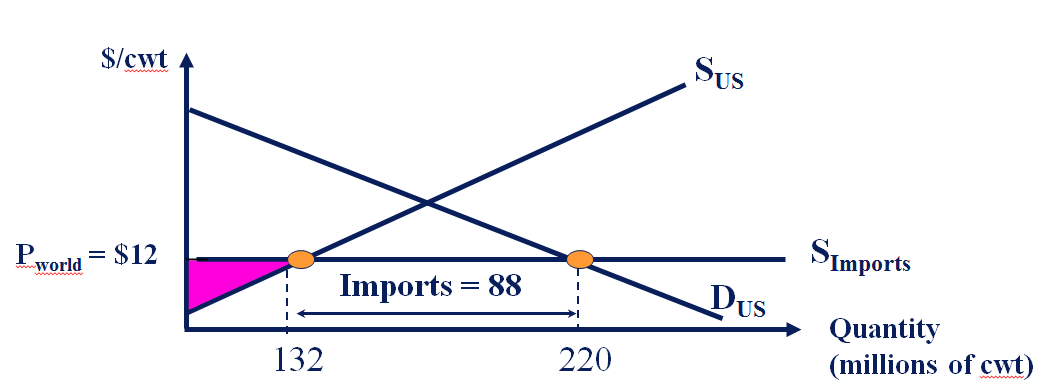
Sugar Case
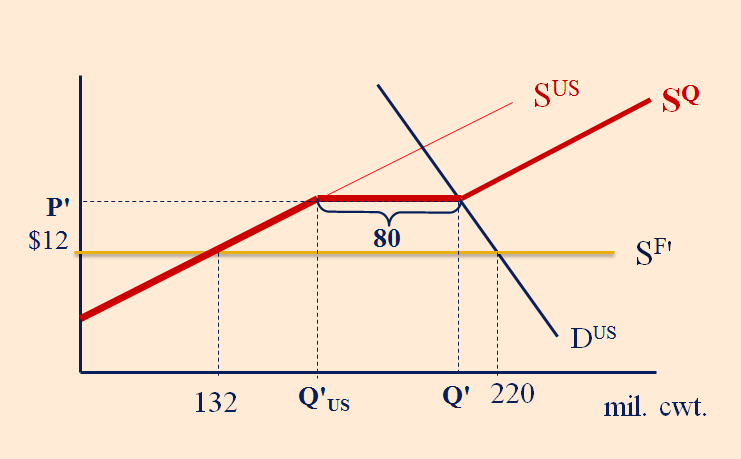
What happens if the US government puts in a quota of 80 million cwt--that is, imports cannot exceed 80 mill cwt?
Sugar Case
Quantity demanded has to equal total quantity supplied.
QD = Total QS ( = Q supplied by US + Q supplied by foreign firms )
If Q supplied by foreign firms is limited by a quota, the difference must be made up by US firms--but domestic firms are only willing to supply more if the price rises.
Sugar Case
Sugar Case
Sugar Case
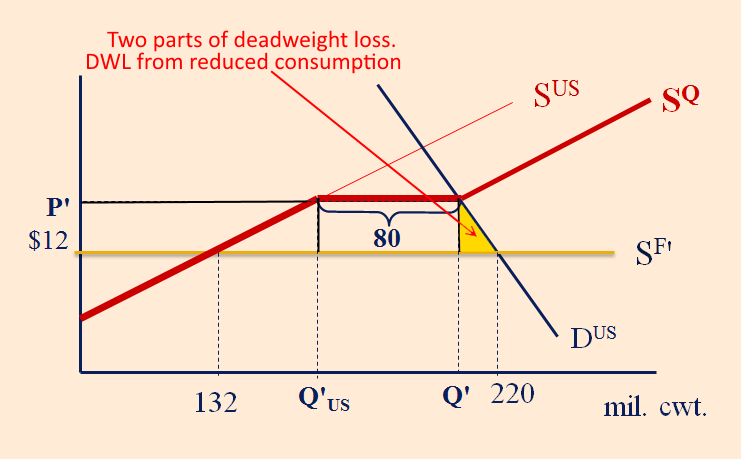
U.S. price rises due to quota ($12/cwt to $13.50/cwt)
U.S. consumption declines due to quota (220 → 218.6)
U.S. production rises due to quota (132 →138.6)
But U.S. production does not go up by the amount of the decline in imports (imports ↓ 8; Qs ↑ 6.6 bil. lbs.)
- Common misconception is that consumers will not respond to the increase in price resulting from the protection of the home market. Domestic producers get a protected share of a smaller market (which can still be quite profitable, though).
Sugar Case
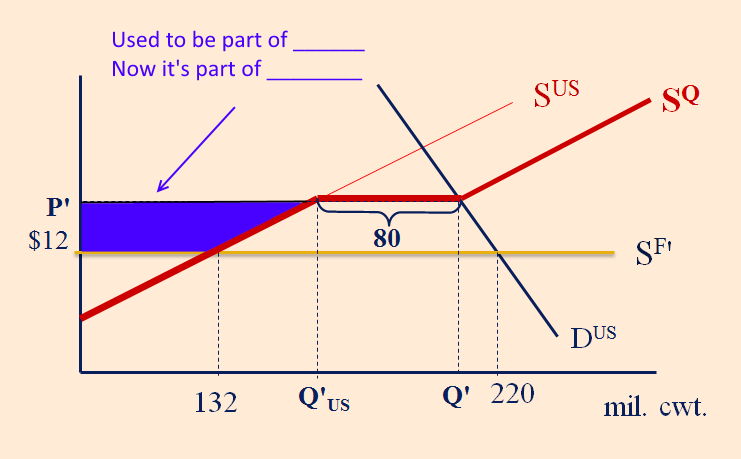
How much better off are U.S. producers with the quota?
How much worse off are consumers?
Sugar Case
Sugar Case
Sugar Case
Sugar Case
Sugar Case
Sugar Case
Sugar Case
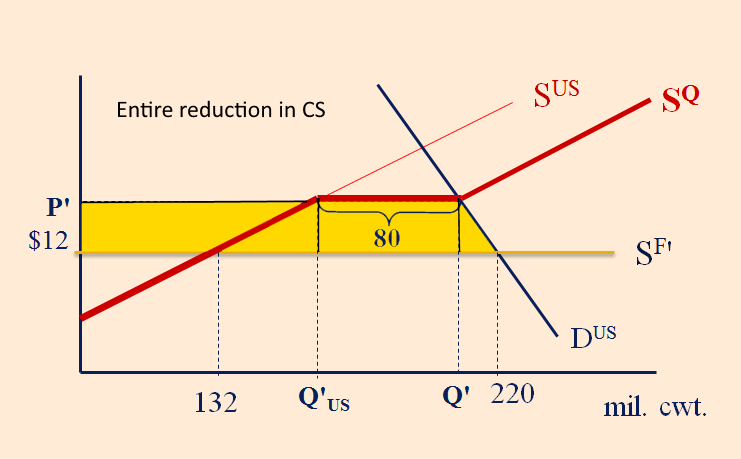
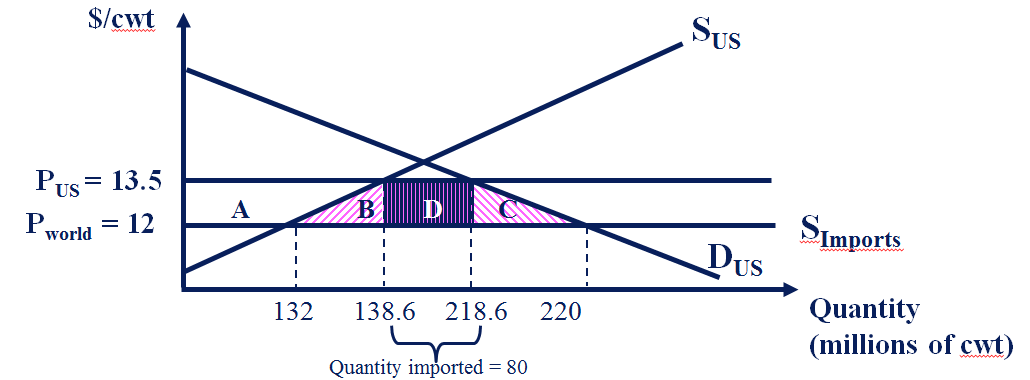
Loss in CS = A + B + C + D (per year) = $328.95 million
Transfer to U.S. producers = A (per year) = $203 million
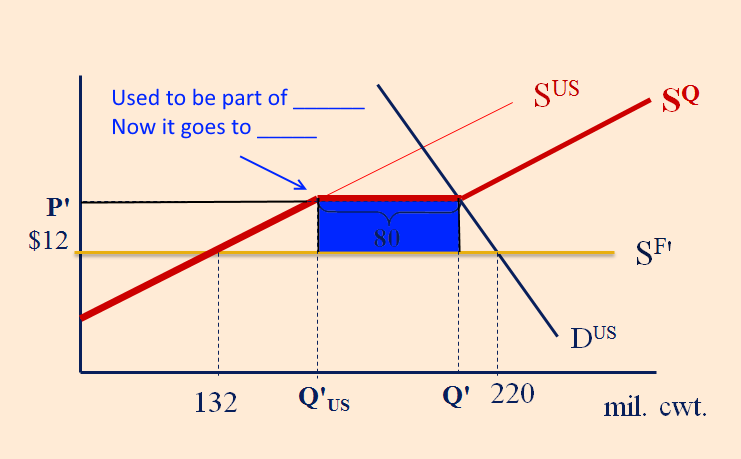
Transfer to foreign exporters or U.S. importers = D (per yr) = $120 mil.
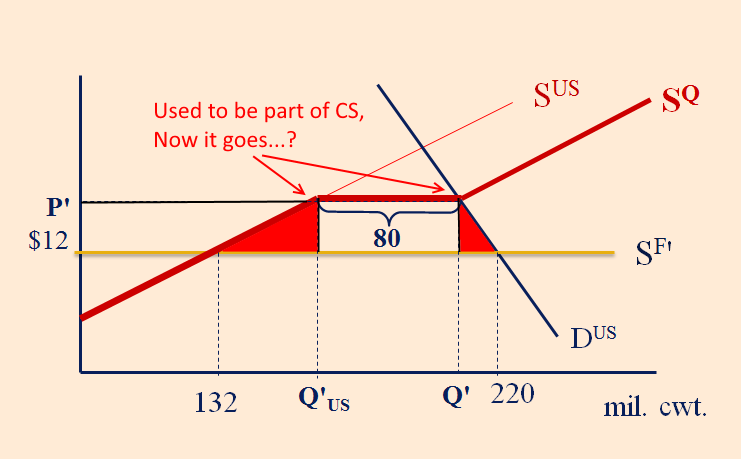
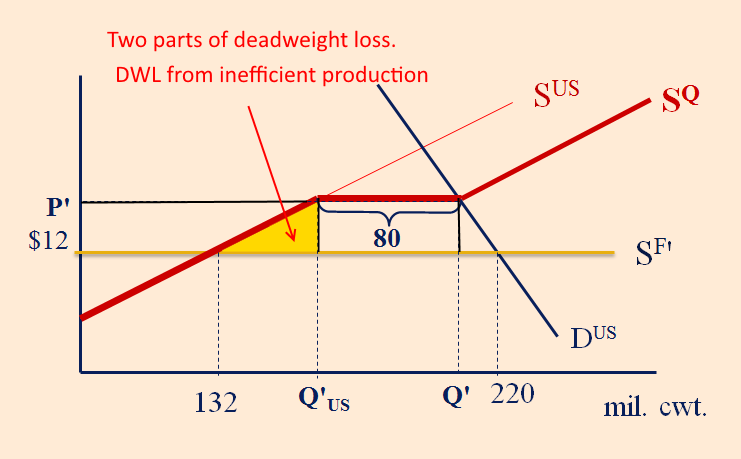
If quota, then DWL = B + C (per yr) = $6 mil.
What if we banned imports altogether?
Sugar Case
Could we achieve the same result with a tariff?
Sugar Case
How high would the tariff have to be to reduce imports to 80?
Sugar Case
How high would the tariff have to be to reduce imports to 80?
Sugar Case
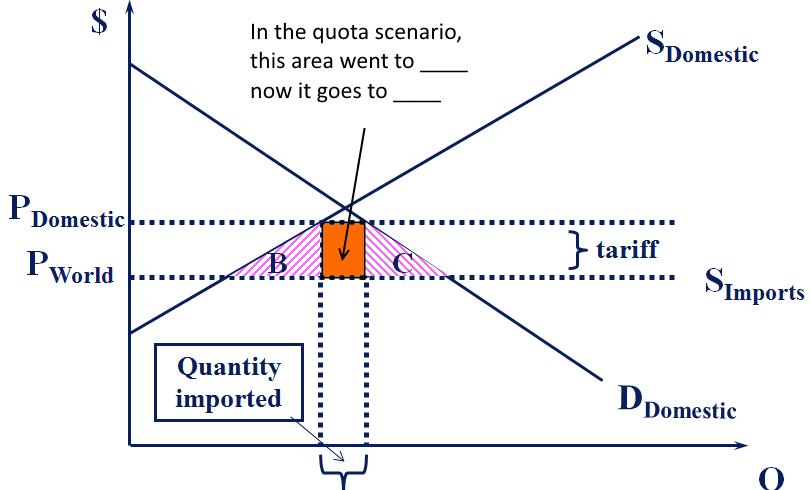
Sugar Case
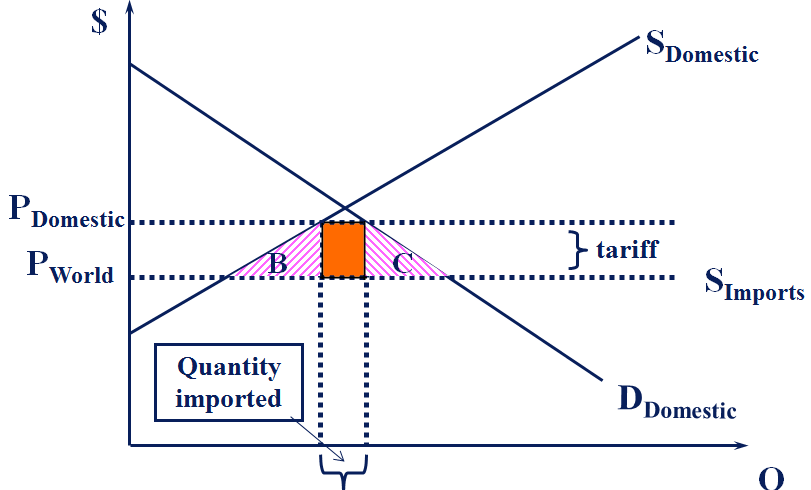
The orange box is the value of quota rights -- either a political gift, auctioned off, or captured through a tariff
Sugar Quotas: Summary
Interference with the competitive equilibrium—price controls, quotas, tariffs—leads to DWL.
Exception: government policies that correctly solve an externality issue (or other market failure).
The surplus transferred from consumers to producers (or vice versa) never counts as DWL—it is just a redistribution of income, not a welfare loss to society.
The lost CS + PS that becomes DWL arises because of the quantity going down below the “free market” (perfectly competitive) equilibrium level.
So--why do we have tariffs and quotas (and why did they persist for hundreds of years)?
•Take-home quiz available Friday 2/13; due Monday 2/16 at 8am (open note/open book…but discussion with anyone is not allowed)
TUESDAY Feb. 17
•Textbook: Ch. 17.4 – 17.5; Ch. 7.4; Ch. 13.5