Applied Microeconomics
Lecture 4
BE 300
Plan for Today
Quick review of elasticity
Other types of elasticities (besides own-price)
Regression analysis
Tagamet
Elasticity
Critical link between price sensitivity, pricing decisions, and revenue implications
- When demand is elastic (at going prices and quantities) decreasing price leads to higher revenues;
- When demand is inelastic, price increases lead to higher revenues
NOTE: revenue ≠ profit
Elasticity
In the early 1990s, the toll on the Golden Gate Bridge was raised 50 percent. Following the toll increase, traffic fell by 5 percent. Prior to the toll increase, Stephen Leonoudakis, chairman of the bridge’s finance auditing committee, warned that the toll increase could cause toll revenues to decrease by several million dollars per year.
- What is the own price elasticity of demand? Does this surprise you?
- Do you think Leonoudakis predictions came true?
Elasticity
Today, the San Francisco Transportation Authority, which is facing a $66 million budget deficit over the next five years, is considering another toll increase. Assuming that the estimate from part (a) is reasonably accurate, do you think that increasing the toll modestly will contribute to the goal of reducing the budget deficit?
Elasticity
Elasticity can be used to compare across products (some products are more or less elastic) and to compare across different points within the same demand curve.
Elasticity


Elasticity


Elasticity
In August 1980, the city government of Washington, D.C. imposed a 6% sales tax on gasoline. City officials predicted the tax would raise $13 million a year in revenue for the city.
The new tax was in effect for only three months when the city’s mayor, Marion Barry, abruptly called for an immediate repeal of the tax, citing “undue hardships both on the consumers of gas in our city and those who operate retail gas businesses.”
In reality, the tax had failed to produce the revenues expected. Evidence showed that the tax caused a 30% reduction in gasoline sales in the city during the short period it was in effect.
What went wrong?
Elasticity
Own-price elasticity |(%ΔQx ÷ %ΔPx)| (absolute value):
- Cigarettes = between 0.3 and 0.5
- Fresh salmon = 2.47
- Pet food = 0.06
- U.S. Compact Cars: 3.4
- London Subway: 0.4
- London Bus: 0.8
- Leisure Travel (air or train): 1.5
Elasticity
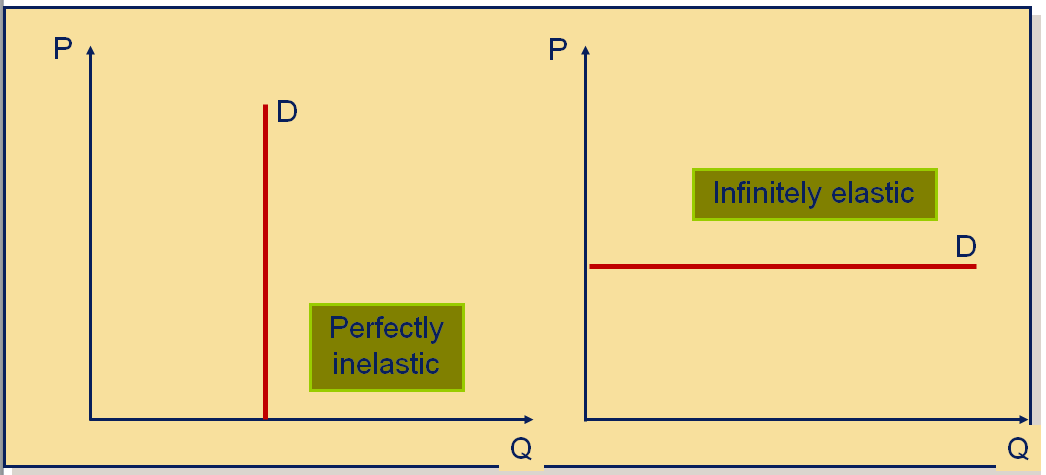
Two extreme cases:
Demand Estimation
Common techniques:
- Informal Estimation Using Historical Market Data or Test Market Data
- "Back of the envelope" estimation. You only need two points to estimate a linear demand curve.
- Statistical Approach: Regression Analysis
- Specify a model for product demand.
- Collect cross section or time series data.
- Use multiple regression to estimate a line or curve through the data.
Demand Estimation
Statistical methods are important if you want an accurate measure of how demand responds to different factors.2001 Business Communications Review -- Information taken from article in which a senior executive was speaking at a conference and asserted that telecom demand elasticity (U.S. domestic long distance) is –3.
Authors of the article don’t believe it. They say: “...a correct calculation of elasticity needs to take into account trendline growth; i.e., growth that would have occurred in any case.” Authors estimate a “true” price elasticity of –1.
Demand Estimation
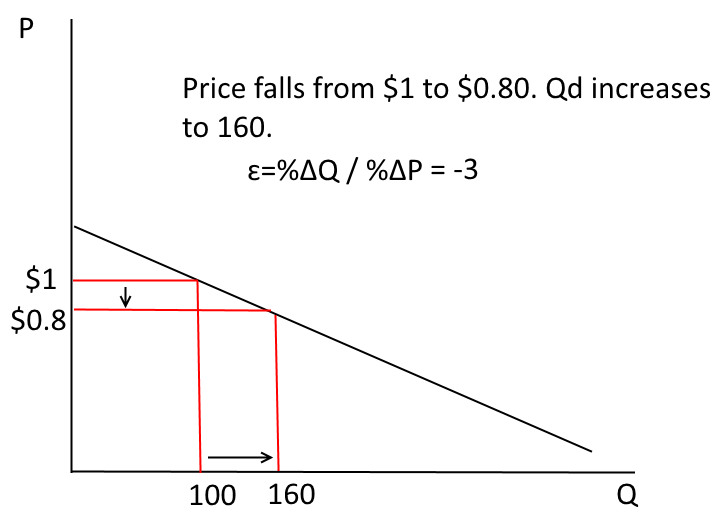
What we see...
Demand Estimation
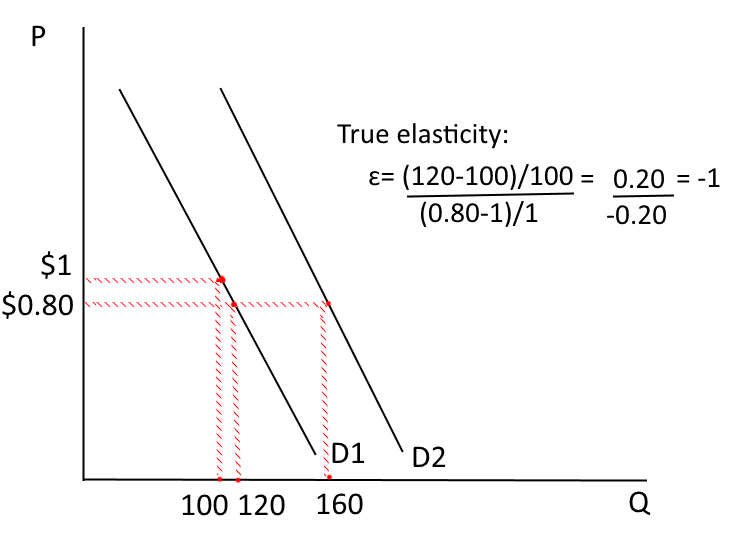
What was actually going on...
Demand Estimation
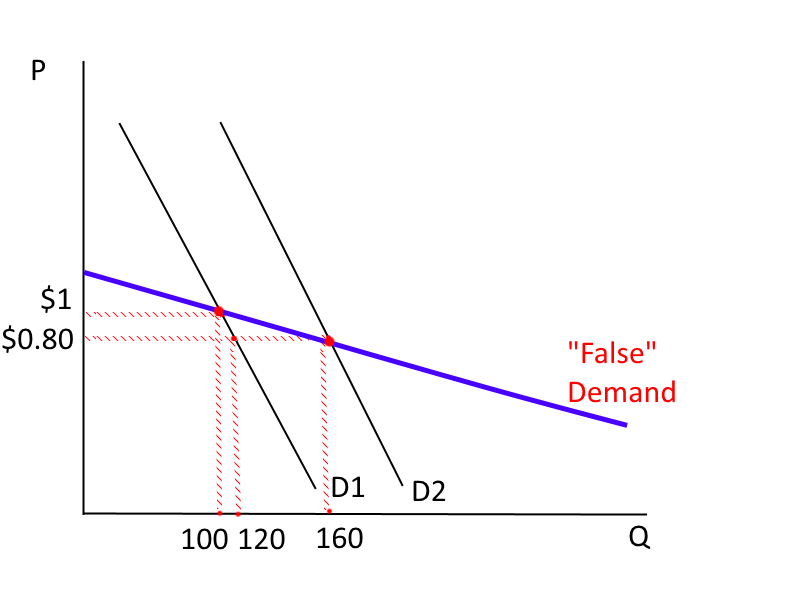
Conclusion: You must control for variables that shift the demand curve so that you can isolate the price-quantity relationship.
Demand Estimation
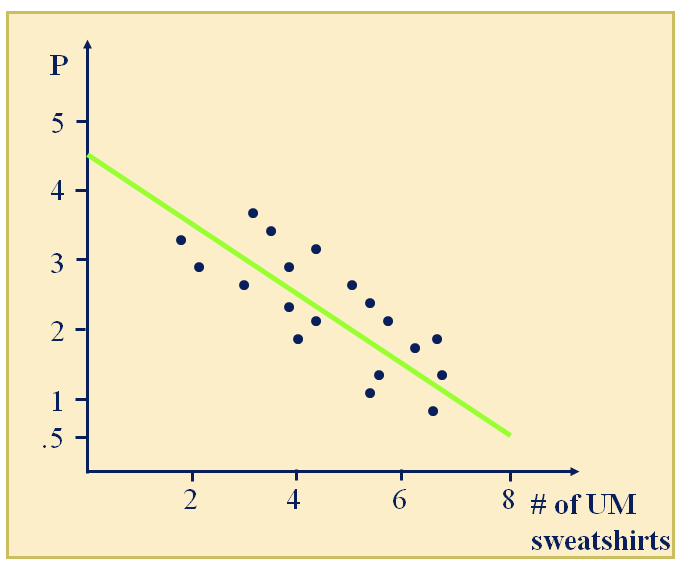
Say you have data from two months, July and October, about quantities sold and prices of UM Sweatshirts. Any possible problems?
Demand Estimation
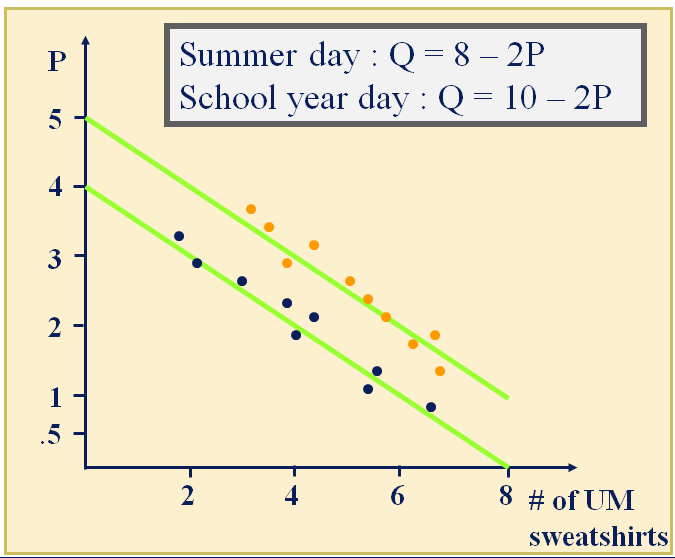
You might actually be looking at two different demand curves--you would want to estimate them separately.
Demand Estimation
“Combining” data points to estimate market demand for UM sweatshirts takes some things as given:
- market population
- income of local population
- current price of other goods such as UM T-shirts (substitute) or UM home game tix (complements)
- Record of UM football, basketball, etc. teams
- Weather conditions
Whenever these change, the whole demand curve shifts.
Demand Estimation
To account for multiple factors that may be affecting demand simultaneously, we use regression analysis.
Demand Estimation
A simple regression model might look like:
- We can estimate the intercept and slope, learn about the magnitude of the relationship (how large is β1?), and use the estimates to make predictions.
- Caution: Running a regression and finding a positive or negative relationship between X and Y does not prove causation; it only shows correlation. You provide the story to explain the relationship between the variables.
Demand Estimation
We want the best fit possible--and clearly there are many possibilities.
Demand Estimation
Need to include in the “regression” all the variables that move the demand curve around to isolate the price/quantity relationship.
In our sweatshirt example, you could separate the data from July and October.
In most cases, this is done with multiple regression analyses — with other explanatory variables beside price on the right-hand side (i.e., write Qd = f(P, Income, Season, Pt-shirt…))
Demand Estimation
A regression model of that form might look more like:
Qd=β0 + β1*P+ β2*Income + β3*Weather... .
Working with Multivariate Demand Functions
Quantity Sold = 300 + 2*Advertising − 5*Price
What is the expression for the slope with respect to price?
i.e., ΔQ/ Δ P=?
Working with Multivariate Demand Functions
Quantity Sold = 300 + 2*Advertising − 5*Price
What is the expression for the slope with respect to Advertising?
Working with Multivariate Demand Functions
Quantity Sold = 300 + 2*Advertising − 5*Price
If Advertising is held constant at $100, what is the equation describing the relationship between Quantity and Price?
Q = 500 −5*P
Working with Multivariate Demand Functions
Quantity Sold = 300 + 2*Advertising − 5*Price
If Advertising increases to $200, what is the equation describing the relationship between Quantity and Price?
Q = 700 −5*P
Data Sources
Primary Data
- Cross section or time series data available within the firm (e.g., price scanner data)
- Consumer Surveys (e.g., data on probability of purchase obtained from interviews of representative samples of individuals)
- Experimental data (e.g., using consumer laboratories (fake stores) to see how peoples' purchases change as we change offerings (displays, ads, etc.); test markets)
Government sources
- Census (by SIC/ISIC/NAICS code in U.S.) – cross section or time series
Trade sources
Data Sources
Surveys
Example: interview data on consumer purchase plans
Advantages: relatively low cost
Limitations: mistaken and/or strategic responses
Data Sources
Experiments
Examples: test markets or consumer laboratories (or economics laboratories)
Advantages: “real” transactions (unlike surveys) for certain experiments (not for econ lab ones, though), can control the setting and be sure nothing changes except the variables you're interested in
Limitations: costly (“real transactions”)
Data Sources
"Real" data
Examples: cross section or time series or panel data; “big data”
Advantages: actual behavior over time & across locations
Limitations: possible specification error,
e.g., movement along demand curve or demand curve shifts?
Elasticity
Demand data can be used to calculate several elasticities:
Own-price elasticity of demand
Cross-price elasticity of demand
Income elasticity of demand
Elasticity
Income elasticity of demand : Responsiveness of quantity demanded to changes in income (in percentage terms)
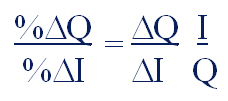
Example: If a 5% increase in I => a 10% increase in Q, what is income elasticity of demand?
Does income elasticity of demand have to be positive?
Elasticity
If income elasticity > 0 => Normal good
If 0 < Income elasticity < 1 => “Necessity”
If Income elasticity > 1 => “Luxury”
If Income elasticity < 0 => Inferior good
Can you think of some products that are "inferior goods"?
Elasticity
Cross-price Elasticity of Demand: Responsiveness of quantity demanded of Good X to changes in price of Good Y(in percentage terms)
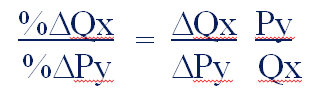
Example: If a 5% increase in the P of a caramel macchiato latte causes a 10% decrease in Q of slices of coffee cake sold, elasticity of the demand of lattes with respect to the price of coffee cake is...?
Elasticity
Changes in the price of substitutes or complements...
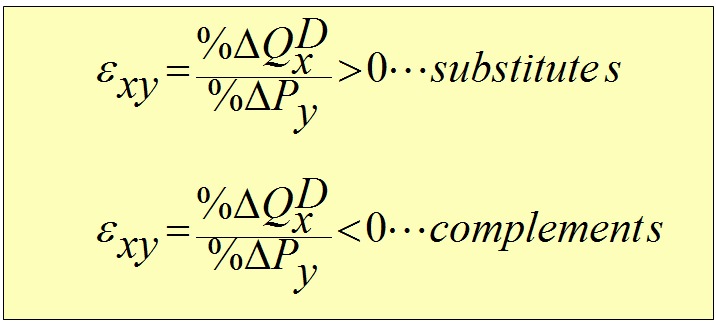
If the price of a substitute goes up, the demand for your product goes...
If the price of a complement goes up, the demand for your product goes...
Elasticity
If a 5% increase in the P of Lattes => a 10% decrease in QCake,
E of demand for Cakes wrt price of Lattes = – 10/5 = –2 => Lattes & cake are COMPLEMENTS
If a 5% increase in the Price of lattes results in a 10% decrease in Quantity of Tea,
Elasticity of demand for lattes wrt price of tea is = 10/5 = 2 => Lattes & Tea are SUBSTITUTES
Elasticity
Larger absolute values and a negative cross-price elasticity: closer, more “tightly coupled” complements
Larger absolute values and a positive cross-price elasticity:
Are cross price elasticities symmetric?
Music Break!
Elasticity
Excerpt from“If I Had a Million Dollars” by Barenaked Ladies:
If I had a million dollars
We'd take a limousine 'cause it costs more If I had a million dollars
We wouldn't have to eat Kraft Dinner
But we would eat Kraft Dinner. Of course we would, we'd just eat more. And buy really expensive ketchups with it. That's right, all the fanciest Dijon ketchups! Mmm. Mmm-hmm.
According to BNLs, what is the value range for their:
(a) income elasticity of demand for Kraft Dinner?
(b) ketchup x-price elasticity of demand (w/r/t/ Kraft Dinners)?
Elasticity
Excerpt from“If I Had a Million Dollars”
by Barenaked Ladies:
But we would eat Kraft Dinner. Of course we would, we'd just eat more. And buy really expensive ketchups with it. That's right, all the fanciest Dijon ketchups! Mmm. Mmm-hmm.
According to BNLs, what is the value range for their:
income elasticity of demand for Kraft Dinner?
- Positive. Kraft Dinner would be a normal good; cannot tell if it’s a necessity or a luxury, but most likely a necessity
Ketchup x-price elasticity of demand (w/r/t/ Kraft Dinners)?
- Would be negative: ketchup & Kraft Dinner are complements
Elasticity
Cross-price elasticity (%ΔQx ÷ %ΔPY)
Coke with respect to Pepsi: 0.52
Pepsi with respect to Coke: 0.64
Income elasticity (%ΔQx ÷ %ΔI)
Beef = 0.51
Potatoes = −0.20
Household appliances = 2.72
Demand for Tagamet
Tagamet Case
We have four objectives:
- Identifying factors that shift the demand curve (income, price of substitutes & complements, taste & preferences, season, expectations,etc.) vs. causing movement along the demand curve (only own-price)
- Interpreting multiple regression coefficients in terms of impact on the demand curve
- Using multiple regression coefficients to estimate own-price, cross-price, and income elasticities (pt. formula)
- Analyzing the meaning of estimated elasticities
Tagamet
Background:
Tagamet is an ulcer treatment drug.
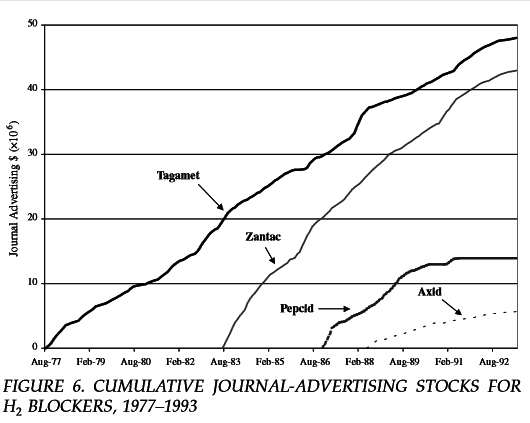
- 1977: Tagamet introduced by SmithKline-Beecham; the first H2 antagonist -- substantially more effective than existing treatments.
- 1983: Zantac introduced by Glaxo, Inc; similar to Tagamet but fewer side effects, almost twice the price.
- By mid-80s: Zantac surpasses Tagamet as leading brand; new entrants are Pepcid (1986) and Axid (1988).
Tagamet

Tagamet

Source: Azoulay, JEMS 2002
Tagamet

Source: Azoulay, JEMS 2002
Tagamet
Estimated Demand Relationship (monthly data, 1983-89):
QTagamet = 354.08 - 321.83*PTagamet + 18.76*PZantac
+ 128.16*PCarafate - 0.09*Income
Mean values of each of these variables over 1983 -1989:
- QTagamet: 68.52 (millions sold per month)
- PTagamet: 0.29 (1982 $)
- PZantac: 0.65 (1982 $)
- PCarafate: 0.26 (1982 $)
- Income: 2641.56 (billions of 1982 $)
Tagamet
Estimated Demand Relationship:
QTagamet = 354.08 - 321.83 * PTagamet + 18.76 * PZantac
+ 128.16 * PCarafate - 0.09 * Income
Are the signs of the estimated parameters as you would expect?
What do they tell you?
Tagamet
Estimated Demand Relationship:
QTagamet = 354.08 - 321.83 * PTagamet + 18.76 * PZantac
+ 128.16 * PCarafate - 0.09 * Income
What is the own-price elasticity of Tagamet (at prevailing prices and quantities)?
Is demand elastic or inelastic? Does this make sense to you intuitively?
Tagamet
Estimated Demand Relationship:
QTagamet = 354.08 - 321.83 * PTagamet + 18.76 * PZantac
+ 128.16 * PCarafate - 0.09 * Income
What are the cross-price elasticities of demand between Tagamet and Carafate and between Tagamet and Zantac (at the means)?
Which of these drugs seems to be a closer substitute for Tagamet? Does this make sense given the facts of the case?
Tagamet
Tagamet
Source: Azoulay, JEMS 2002
Demand Estimation
Formal (e.g., regression analysis) & informal methods (e.g., “back of the envelope") for calculating demand functions and elasticity measures
- Coefficient estimates from multiple regression equations of demand can be used to calculate various elasticities—own-price, cross-price, and income.
- Elasticity estimates are only as good as the demand equation estimation is (in terms of including all relevant variables that affect demand and predicting actual quantities consumed)
- Cross price elasticities do not have to be symmetrical
For Next Time
We begin the section on costs.
Look over the case Franchise McCosts (for class discussion only)
Ch. 5 intro, Ch. 6 intro & Ch. 6.1–6.3
Articles:
How to Walk Away; Why Don’t Airlines Just Add More Flights?; Outsource Your Way to Success