Multilevel Modeling Part 1
PSY 383
- Introduction: What are multilevel models and why would we use them?
-
Between vs. within-group variance
- Fixed vs. random effects
- Intra-class correlation
- Our first multilevel model: the random-effects ANOVA
-
Incorporating predictors
- Random intercept regression model
- Intercepts-as-outcomes
- Slopes-as-outcomes
Multilevel models
Motivation: nested data
-
We use multilevel models in the presence of a nested data structure.
- Multiple students in the same school
- Multiple children of the same mother
- Multiple time points observed on the same person
Why use multilevel models?
-
In the presence of nested data, the assumption of independence of errors is not met.
-
Multilevel models allow us to...
-
...model group-level effects, if they are of substantive interest
-
...determine the relative magnitude of within-group effects
-
...generalize to a population of group effects
-
Independence of Error Terms
-
In the presence of nested data, the assumption of independence of errors is not met.
-
This is key, because a standard linear model assumes that between-group differences are the only source of variation
-
If we ignore nesting of data, we obtain biased estimates of coefficients and standard errors
-
Standard errors often downwardly biased, leading to inflated Type I error rate
-
Other options
Randomly sample one observation from each group
-
Fixed effects model
i.e., including a regression coefficient for each grouping
-
Two approaches which only estimate marginal effects
Generalized estimating equations
-
Adjustments to standard errors which adjust for clustering
Huber-White SEs, so-called "sandwich" estimator
Why use multilevel models?
-
Multilevel models allow us to...
-
...model group-level effects, if they are of substantive interest
-
e.g., How does school climate affect math scale scores?
-
-
...determine the relative magnitude of within-group effects
-
e.g., How much do school-level factors affect math scale scores, relative to child-level scale scores?
-
-
...generalize to a population of group effects
-
e.g., How much do school-level factors affect math scale scores, relative to child-level scale scores, above and beyond the schools we are currently considering?
-
-
Why use multilevel models?
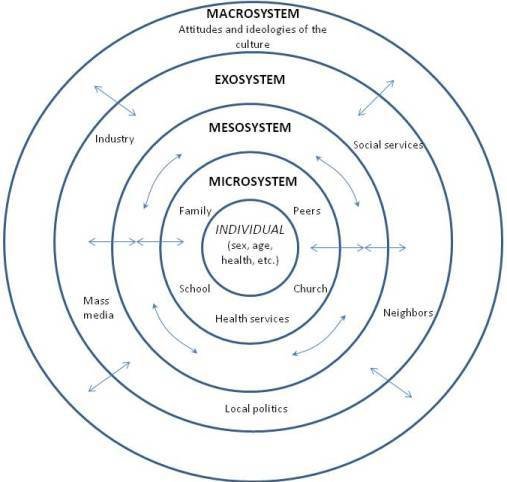
Multilevel models, at least theoretically, allow us to model the interplay between these levels.
A note on nomenclature
- Multilevel models go by a number of different names:
- Random coefficient models
- Mixed models
- Hierarchical linear models
- Additionally, the same model is often referred to in multiple different ways
- e.g., a slopes-as-outcomes model vs. a model with a cross-level interaction
- We will try to be as general as possible but if ever you are confused, please just ask!
Between-groups variance vs. within-groups variance
Partitioning variance
- Our first task is to figure out how much variance in our outcome is related to differences between groups, and how much is related to variation within groups.
- How similar are kids who go to the same school in terms of math ability?
- How similar are a teenager's self-reported depressive symptoms from one day to the next?
- How similar are externalizing problems among children of the same parent?
Motivating example: ECLS-K
-
Nationally representative study children's cognitive and social development from kindergarten to eighth grade
-
\(N=15305\) children sampled starting in 1998
-
Here we look at math skills in a cross-section of students in third grade
-
Children nested within school
Motivating example: ECLS-K
-
Questions we wish to answer
-
To what extent do differences between children in math ability owe to differences between schools?
-
Which child-level factors are associated with higher math scores?
-
Which school-level factors are associated with higher math scores?
-
Do the effects of child-level factors vary from one school to the next?
-
The random-effects ANOVA model
Level 1
Level 2
where \(i\) indexes children and \(j\) indexes school.
\(\beta_{0j}\) is a subject's predicted math score, given that they are a student at school \(j\).
Within-group variance
Level 1
Level 2
\(r_{ij}\) is the subject-specific deviation from this predicted mean.
\(\sigma^2\) is the within-school variance.
\(\gamma_{00}\) is the grand mean math score across schools.
Between-group variance
Level 1
Level 2
\(u_{0j}\) is the school-specific deviation from this grand mean.
\(\tau_{00}\) is the between-school variance.
grand mean across schools
Putting it together
Reduced form equation
some school-specific deviation from that grand mean
some child-specific deviation from the school-implied value
Total variance = \(\tau_{00}\) +\(\sigma^2\)
How much of the variance in math scores owes to differences between schools?
- We answer this question with an intraclass correlation coefficient (ICC).
\(ICC = \frac{BetweenGroups Variance}{Total Variance}\)
\(ICC = \frac{\tau_{00}}{\tau_{00}+\sigma^2}\)
Incorporating predictors
Motivating example: ECLS-K
-
Questions we wish to answer
-
To what extent do differences between children in math ability owe to differences between schools?
-
Which child-level factors are associated with higher math scores?
-
Which school-level factors are associated with higher math scores?
-
Do the effects of child-level factors vary from one school to the next?
-
\(\beta_{0j}\) is the predicted math score for a child who watches no TV, given that they are a student at school \(j\).
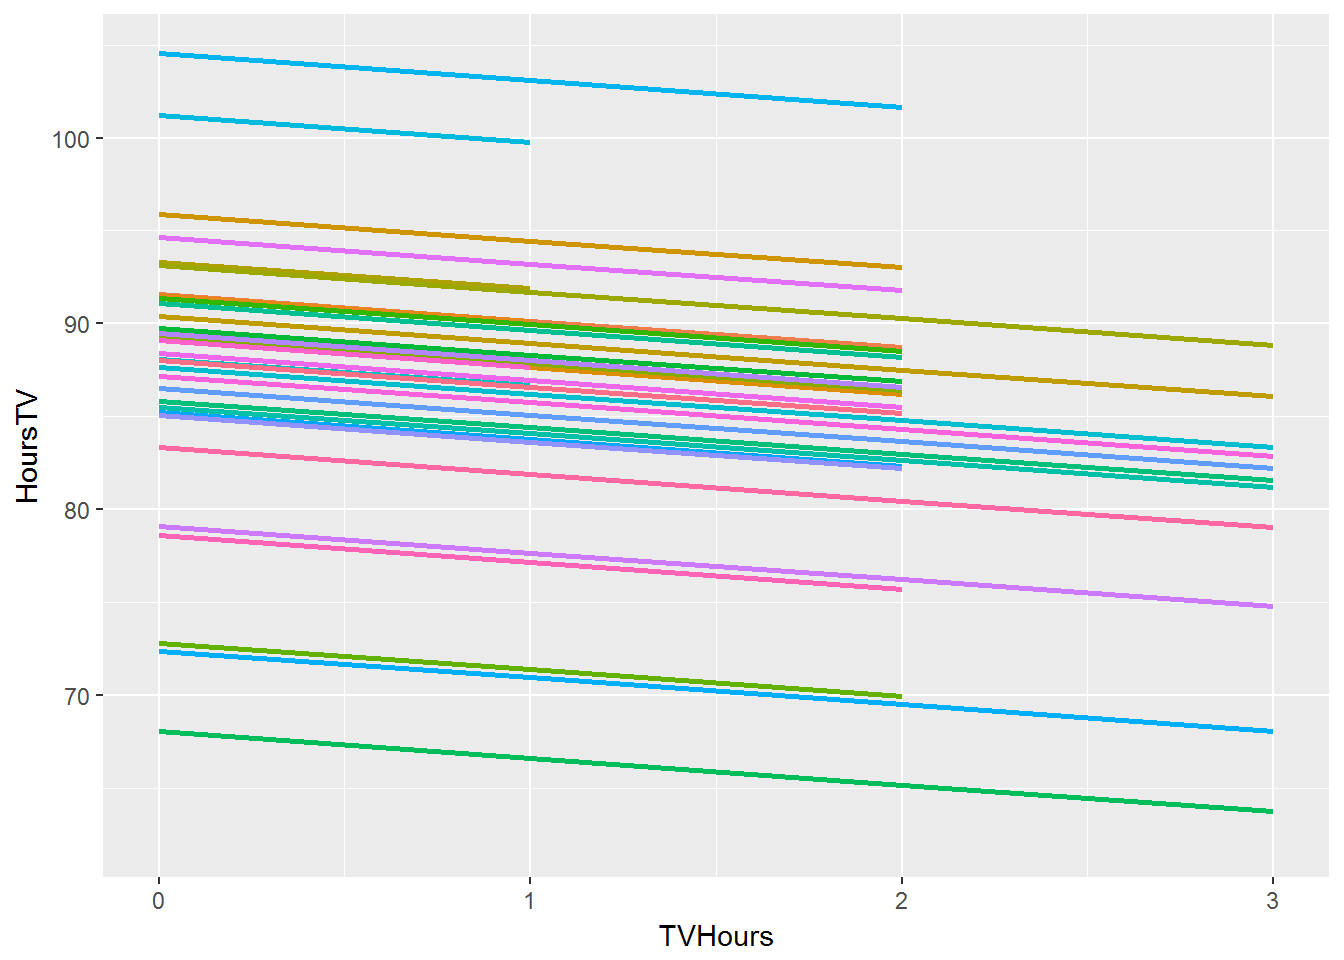
Random intercept model
Level 1
Level 2
\(\beta_{1j}\) is the effect of hours of TV watched on math score for school \(j\). Note that it is the same for all schools here.
The random-effects ANOVA model
Level 1
Level 2
where \(i\) indexes children and \(j\) indexes school.
Random intercept model
Reduced-form equation
random
fixed
Random intercept model
random
fixed
Note that this model could also be run (erroneously) as a standard linear regression by getting rid of random effects!
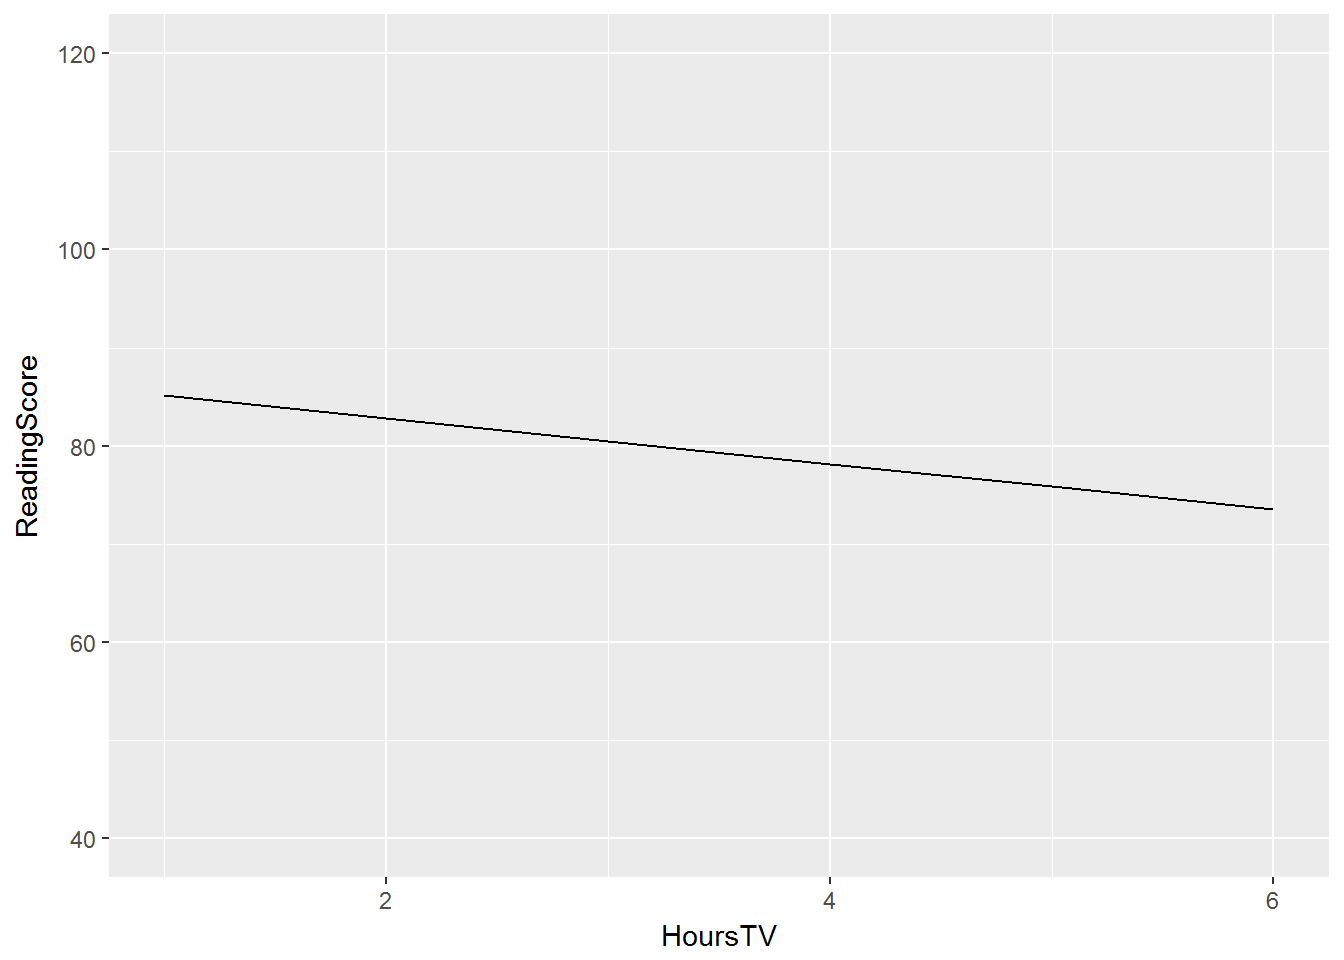
Example: ECLS-K
-
We predict math scale score from the number of hours of TV watched after dinner without accounting for nesting within schools
-
We find a fairly precipitous drop, predicting a 2.32-point reduction in math score for each hour of TV watched.
Motivating example: ECLS-K
-
Questions we wish to answer
-
To what extent do differences between children in math ability owe to differences between schools?
-
Which child-level factors are associated with higher math scores?
-
Which school-level factors are associated with higher math scores?
-
Do the effects of child-level factors vary from one school to the next?
-
Intercepts-as-outcomes model
Level 1
Level 2
Here \(\gamma_{01}\) conveys the effect of \(PctFRL_j\) (the percentage of students qualifying for free or reduced lunch at school \(j\)) on the overall predicted math score for school \(j\).
\(\beta_{0j}\) is the predicted math score for a child who watches no TV, given that they are a student at school \(j\).
Random intercept model
Level 1
Level 2
\(\beta_{1j}\) is the effect of hours of TV watched on math score for school \(j\). Note that it is the same for all schools here.
Intercepts-as-outcomes model
Reduced-form equation
random
fixed
Note that even though \(PctFRL_j\) is a school-level variable and \(HoursTV_i\) is a child-level variable, both are fixed effects.
Motivating example: ECLS-K
-
Questions we wish to answer
-
To what extent do differences between children in math ability owe to differences between schools?
-
Which child-level factors are associated with higher math scores?
-
Which school-level factors are associated with higher math scores?
-
Do the effects of child-level factors vary from one school to the next?
-
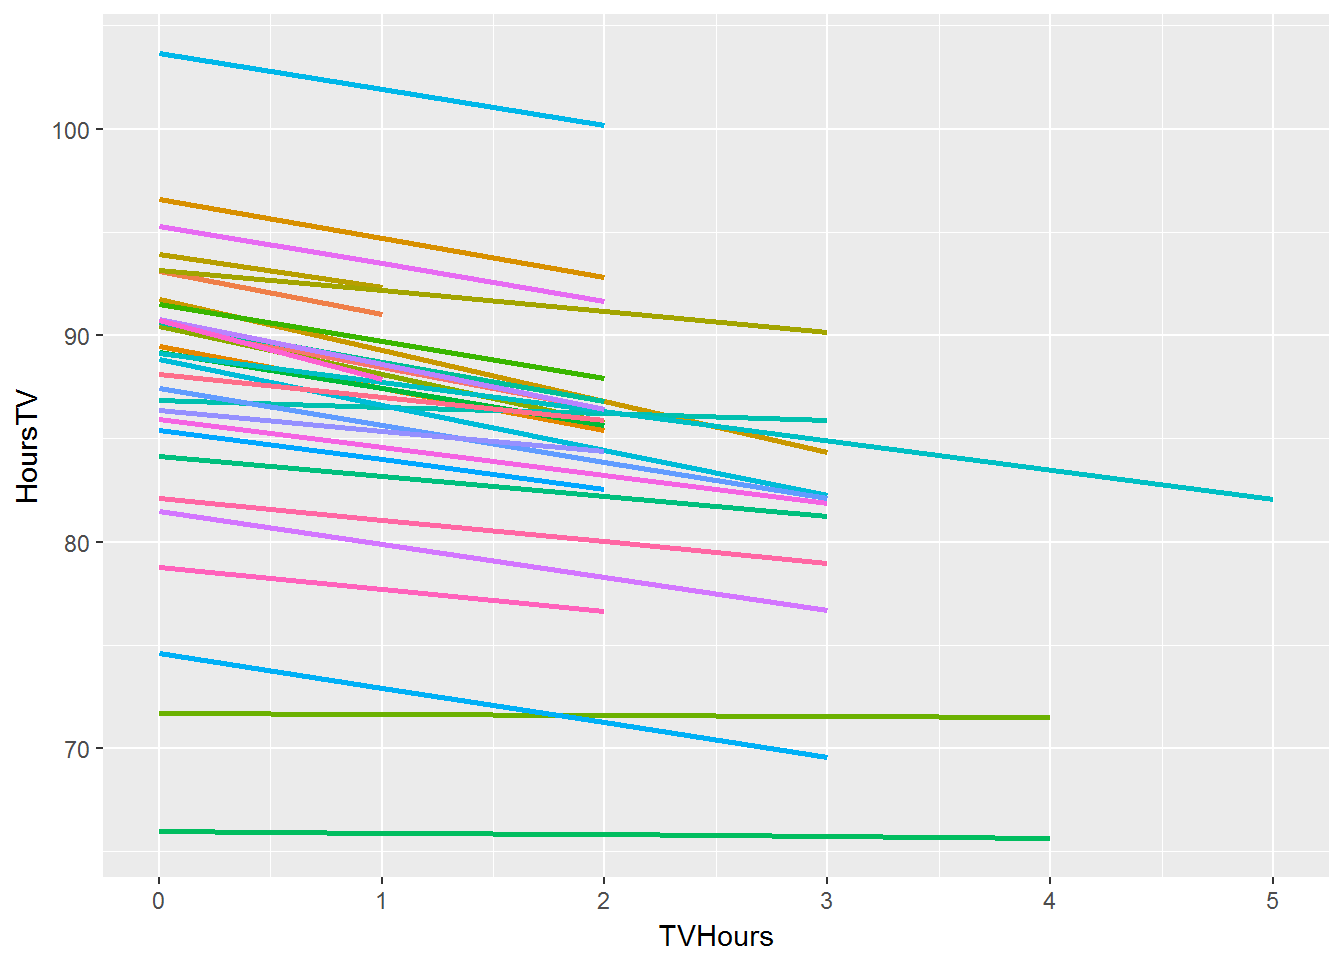
Slopes-as-outcomes model
Level 1
Level 2
Here \(\gamma_{01}\) conveys the effect of \(PctFRL_j\) (the percentage of students qualifying for free or reduced lunch at school \(j\)) on the overall predicted math score for school \(j\), and \(\gamma_{01}\) conveys the effect of \(PctFRL_j\) on the effect of \(HoursTV_i\).
Intercepts-as-outcomes model
Level 1
Level 2
Here \(\gamma_{01}\) conveys the effect of \(PctFRL_j\) (the percentage of students qualifying for free or reduced lunch at school \(j\)) on the overall predicted math score for school \(j\).
Slopes-as-outcomes model
Reduced-form equation
random
fixed
fixed
Assessing the significance of effects
- Notice that we have not been examining significance tests for fixed effects.
- This makes it hard to say, e.g., whether the effect of a level-2 variable on the level-1 slope is significant
- Our best strategy is to use likelihood ratio tests
- Our MO: Test whether the fit of Model A, which contains all of the relevant effects, is significantly better than Model B, which contains a subset of these effects.
- We say that Model B is "nested" within Model A, but note that the word means something different here.