Logistic regression
PSY 383
- These are strategies we use when we have a categorical outcome.
- It is easier to think about us using a 2-level categorical (i.e., binary) variable, but we can use them for all different kinds of non-normally distributed outcomes, such as ordinal outcomes.
- They have analogs in things you already know how to do.
- t-test \(\rightarrow\) chi-square
- linear regression \(\rightarrow\) logistic regression
Bottom line up front
...but you don't have to think of them that way if it makes it more confusing (which for many people it does)!
...we are trying to predict whether someone expresses gratitude over the span of a one-hour conversation.
Suppose...
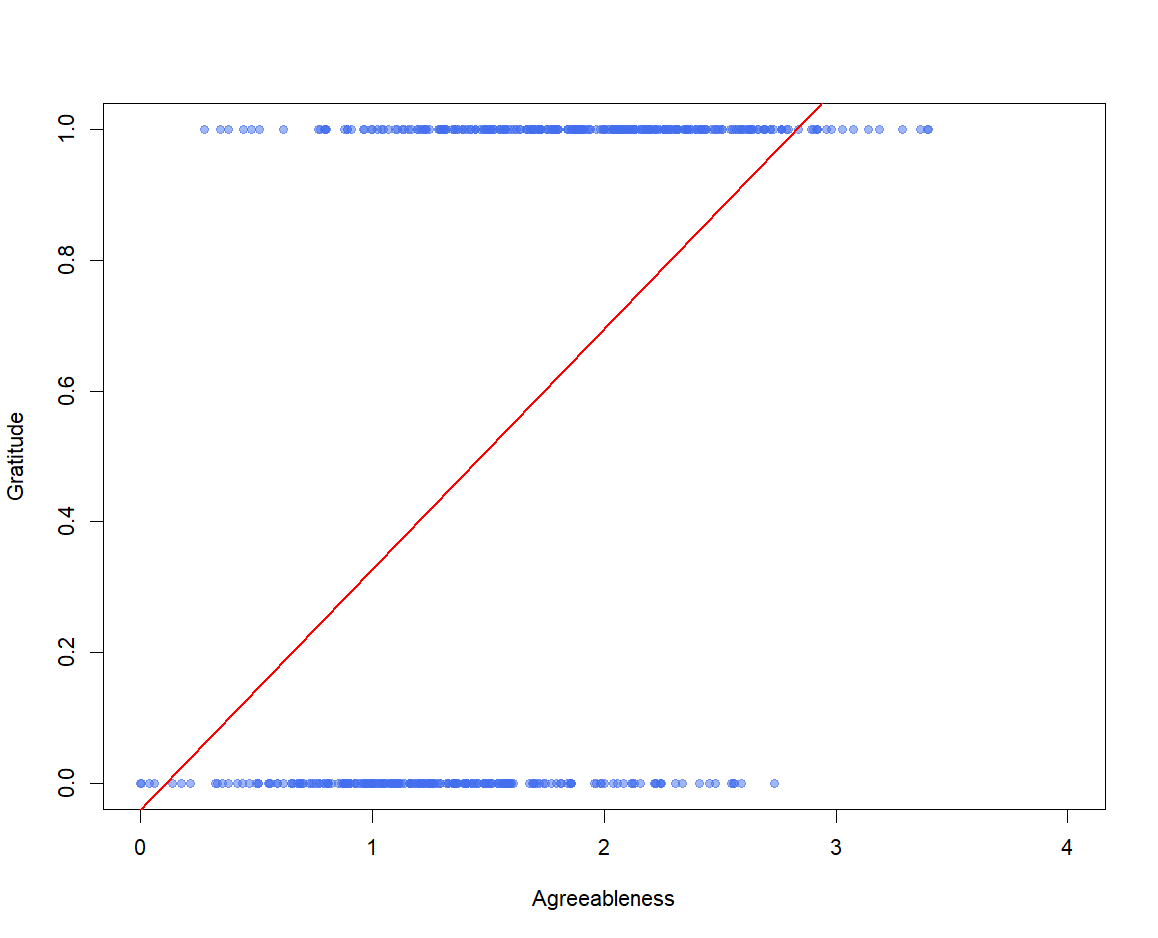
Why can't we use linear regression?
$$\hat{grat} = b_0 + b_1\left(agr\right)$$
- We codify this as a variable, grat, on which person gets a value of 0 if they don't express gratitude at any point, and 1 if they do.
- We think that people who score higher on agreeableness will express more gratitude. Agreeablness is expressed as agr, a mean score that ranges from 0 to 5.
Problem 1: Will predict values between 0 and 1
Problem 2: Will predict values beyond 0 and 1
We will address this problem in two ways.
Tricky thing: by modeling the probability rather than the response itself, we don't have a standard "error" term like in linear regression. Rather, we simply accept that there will be some error around our predictions without being able to model it directly.
- For instance, suppose \(P\left(grat = 1\right) = .68\).
- It is not the case that, because \(P\left(grat = 1\right) > .5\), grat will necessarily be 1.
- More like, because \(P\left(grat = 1\right) > .5\), grat will probably be 1. And it would be even more likely that grat would be 1 if \(P\left(grat = 1\right) = .95\).
First, we will not model grat directly, but the probability that grat = 1. We will refer to this as
$$P\left(grat = 1\right)$$
But probabilities have to be between 0 and 1. How do we ensure that?
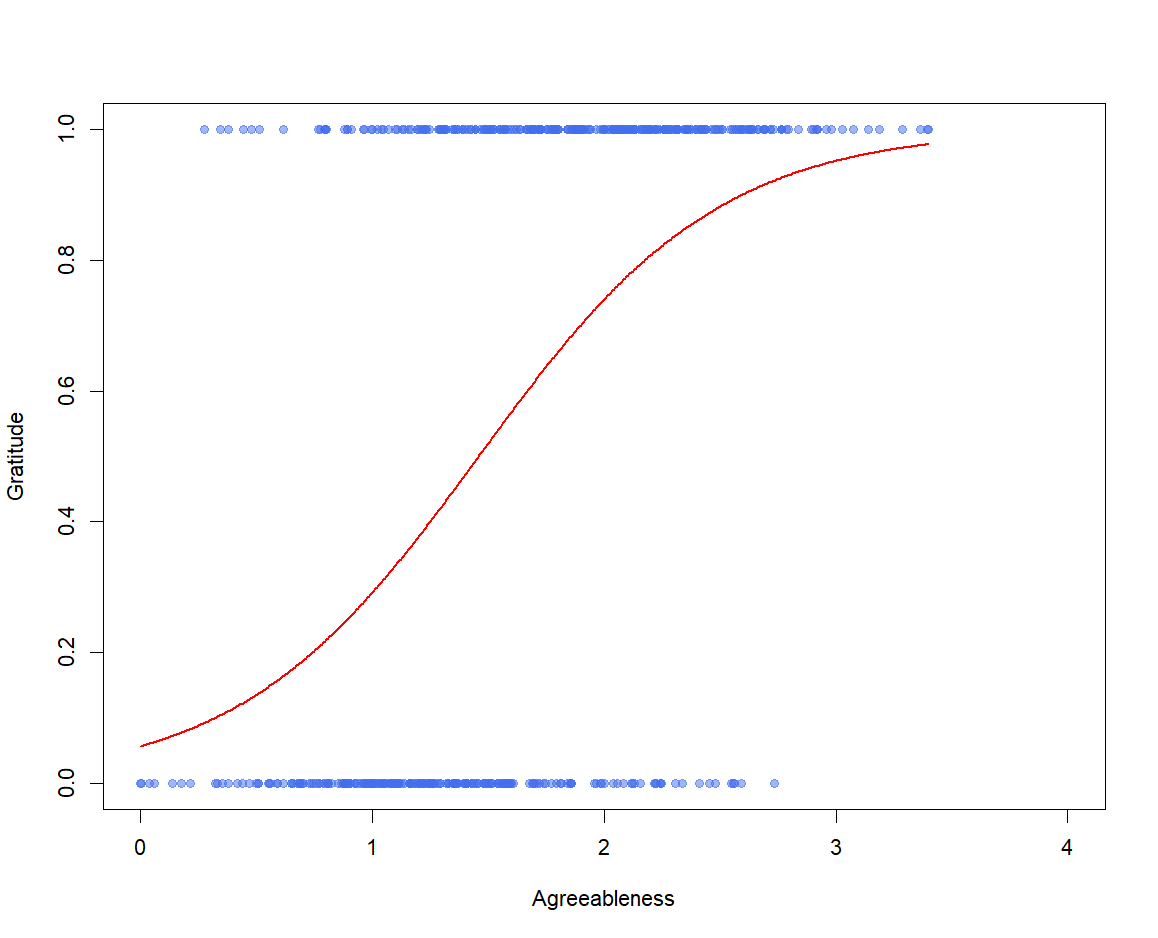
The second part of our solution is to use a logistic, rather than a linear, regression equation.
Specifically, we will model \(P\left({grat} = 1\right)\) as follows:
$$P\left(grat = 1\right) = \frac{1}{1+e^{-\left(b_0 + b_1agr\right)}}$$
Basically, everything that would typically go in a linear regression equation goes in these parentheses
This function yields values exclusively between 0 and 1, which follow an "S" curve
So... what do \(b_0\) and \(b_1\) mean?
Let's actually fit the regression.
$$P\left(grat = 1\right) = \frac{1}{1+e^{-\left(b_0 + b_1agr\right)}}$$
If we want a parallel to linear regression, we can interpret these in log-odds. So \(b_0\) represents the log-odds of expressing gratitude for a person whose agreeableness = 0, and \(b_1\) represents the increment in log-odds associated with a one-unit increase in agreeableness.
$$P\left(grat = 1\right) = \frac{1}{1+e^{-\left(-2.823 + 1.934agr\right)}}$$
$$b_0 = -2.823$$
$$b_1 = 1.934$$
....what??
Let's actually fit the regression.
$$P\left(grat = 1\right) = \frac{1}{1+e^{-\left(b_0 + b_1agr\right)}}$$
If we want an interpretation that actually tells us something, we need to exponentiate these. That is, we need to raise e to the power of each of them. This yields odds ratios.
$$P\left(grat = 1\right) = \frac{1}{1+e^{-\left(-2.823 + 1.934agr\right)}}$$
$$b_0 = -2.823$$
$$b_1 = 1.934$$
For a person with a score of 0 on our agreeableness measure, the odds of expressing gratitude are .059.
For each 1-point increase in agreeableness, the odds of expressing gratitude increase 6.92-fold.
Is the effect of agreeableness significantly different from zero?
$$P\left(grat = 1\right) = \frac{1}{1+e^{-\left(-2.823 + 1.934agr\right)}}$$
$$b_0 = -2.823$$
$$b_1 = 1.934$$
$$e^{b_0} = e^{-2.823} = .059$$
$$e^{b_1} = e^{1.934} = 6.92$$
Is the effect of agreeableness significantly different from zero? Two ways to find out. For both, we need the standard error.
- We can examine the test statistic. For logistic regression, we use a z statistic rather than a t statistic. Specifically:
$$z = \frac{b_1}{SE_{b_1}}$$
Anyone remember the critical value for z??
$$P\left(grat = 1\right) = \frac{1}{1+e^{-\left(-2.823 + 1.934agr\right)}}$$
$$b_0 = -2.823$$
$$b_1 = 1.934$$
$$e^{b_0} = e^{-2.823} = .059$$
$$e^{b_1} = e^{1.934} = 6.92$$
$$SE_{b_0} = 0.321$$
$$SE_{b_1} = 0.196$$
$$ = \frac{1.934}{0.196} = 9.860$$
2. We can get the 95% confidence interval. Specifically:
= \(e^{\left(b_1 - 1.96\left(SE_{b_1}\right)\right)}\)
= \(e^{\left(b_1 + 1.96\left(SE_{b_1}\right)\right)}\)
If the confidence interval contains 1, the odds ratio is not significant. Why?
$$P\left(grat = 1\right) = \frac{1}{1+e^{-\left(-2.823 + 1.934agr\right)}}$$
$$b_0 = -2.823$$
$$b_1 = 1.934$$
$$e^{b_0} = e^{-2.823} = .059$$
$$e^{b_1} = e^{1.934} = 6.92$$
$$SE_{b_0} = 0.321$$
$$SE_{b_1} = 0.196$$
= \(e^{\left(1.934 - 1.96\left(0.196\right)\right)}\) = 4.709
= \(e^{\left(1.934 + 1.96\left(0.196\right)\right)}\) = 10.157
Just as in a linear regression, we need to demonstrate that the model explains a significant portion of the variance in our outcome.
The way we do this is nominally by comparing to a "null" model. Specifically, we use a \(\chi^2\) test*, with df equal to the number of predictors in our model.
Here, \(\chi^2\left(1\right) = 138.81, p < .001\).
*which, yes, is related to the \(\chi^2\) test for contingency tables!
In APA format:
Our logistic regression model explained a significant amount of variance in gratitude, \(\chi^2\left(1\right) = 138.81, p < .001\). For each one-point increase in agreeableness, the odds of expressing gratitude increased by a factor of almost 7, OR = 6.92, 95% CI = (4.709, 10.160).
Note: If it's a multiple-predictor logistic regression, you add in the "controlling for (whatever the other variable is)" language, just like linear regression.