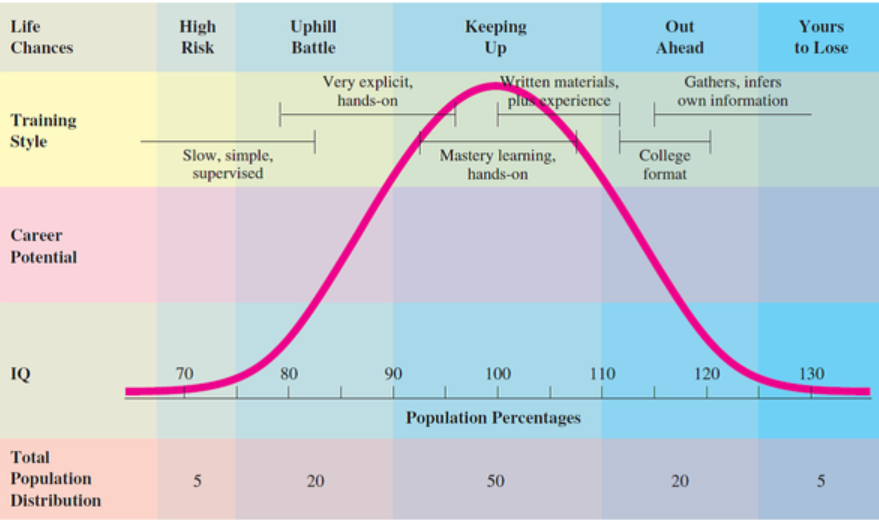
Scales of measurement Test norms
FYS 100, Module 2
- Nominal – categories
- Ordinal – rankings
- Interval – equal increments but NO real zero
- Ratio – YES real zero
Scales of measurement
Don’t worry too much about interval vs. ratio – we will just call both of these types of variables continuous.
- Think of all the categories you've ever been placed into as a result of a test...
- Pass or fail
- Fraternity or sorority membership
- Sidebar: does this count as a test?
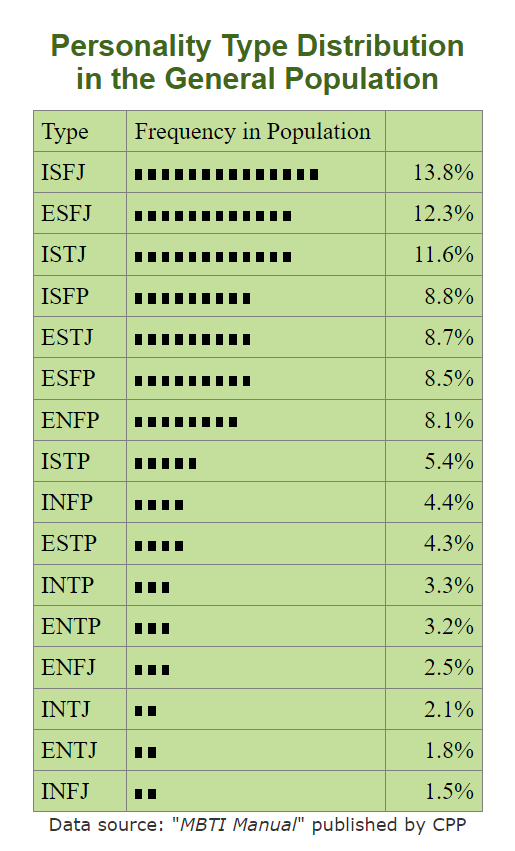
- Key distinction is that nominal data involves categories that are categorically different from one another.
- e.g., mouse vs. dog vs. cat
Nominal data
- Categories that have some order, but not a measureable distance between adjacent ones.
- Rankings
- Tiers
- Grades?
- Seems like this involves collapsing continuous variable into an ordinal one...
- Are Likert-type items ordinal or continuous?
- e.g., items ranging from strongly disagree (1) to strongly agree (7)
- This is hotly contested!
- e.g., items ranging from strongly disagree (1) to strongly agree (7)
Ordinal data
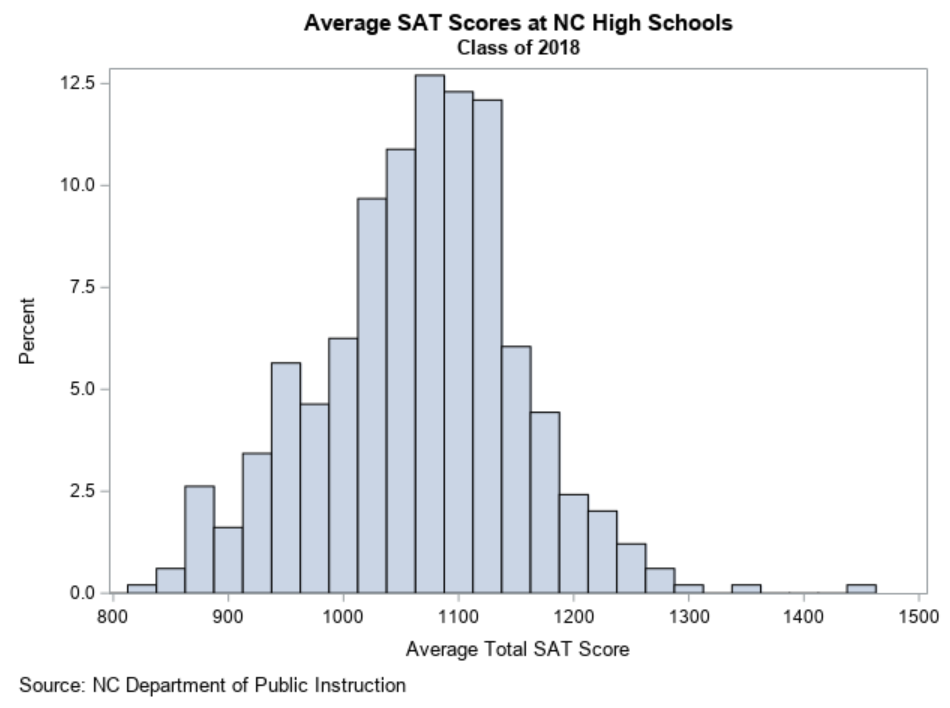
- Truly continuous data has meaningful distances between adjacent values
- For instance, person A scored 100, person B scored 200, and person C scored 125. To whom is person C closer in score?
- Examples
- Test scores that are sums of items
- Numerical values in the physical world
- Weight
- Height
- Time
- Temperature
Continuous data
Exercise: Think of one person who is the best at something. Provide one number which tells us why they are the best.
- Consider the following examples
- Alex scored a 1360 on the SAT
- Brit scored a 135 on a math test
- Cait scored 87 on her Accounting 111 final
- Dave endorsed 2 out of 9 diagnostic criteria for depression
- How do you interpret these scores? What other information do you need?
Test norms
-
Test norms are any statistics which tell us what typical performance on a given test looks like. These can take many forms...
- Means and standard deviations
- No worries if you don't know what a standard deviation is
- Percentiles
- Proportions of people who passed or failed
- Means and standard deviations
- The key idea here is that understanding the test's distribution is what is useful
- For continuous variable, this typically looks like the mean and SD, or percentiles
- For a categorical variable, this typically means knowing the proportion of people in each category
Test norms
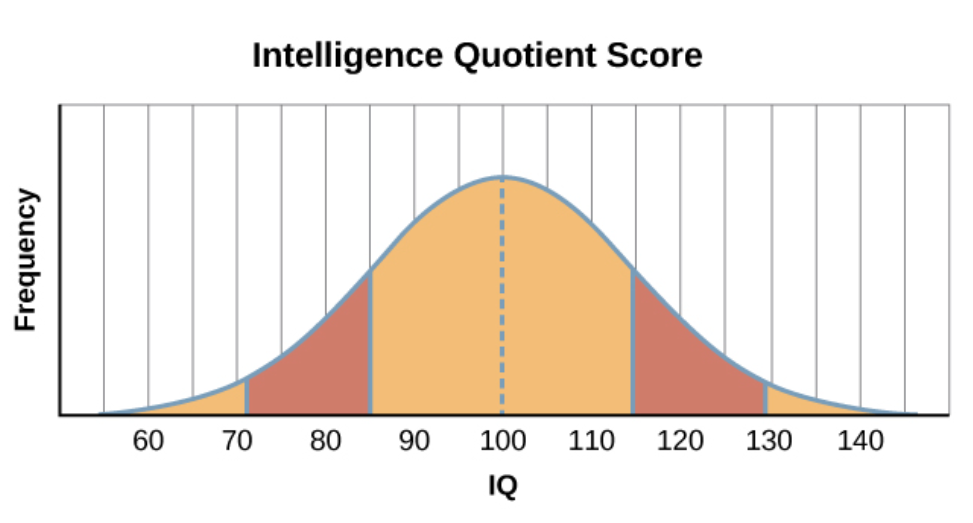
The promise of test norms is that they can help us to understand where we are in a distribution. The peril of test norms is that we could map subjective meaning onto them that isn't warranted. For instance...
Please note that this is an example of how not to interpret test norms.
What's wrong with it?