AIS Student Competitions
College of Business - ISBA
Arturo Castellanos, PhD Candidate
Information Systems and Business Analytics
www.arturocastellanos.com
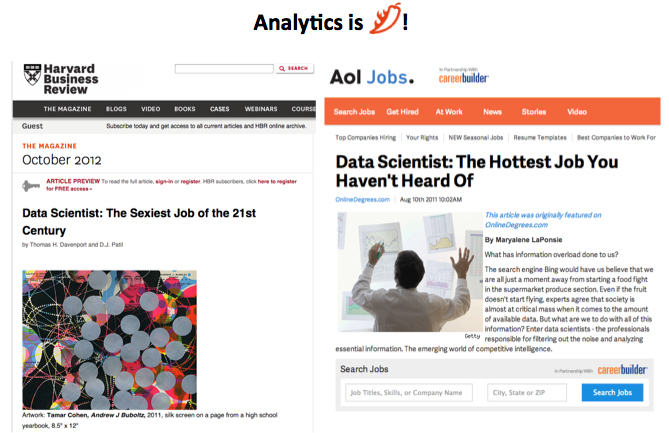
Data is the new oil Forbes
Data is the new oil Forbes
The best time to start was yesterday
The second best time is NOW.
AIS Challenges
1. Bright ICT IMB Bluemix
2. Security: Mutual insurance company
3. Analytics Challenge
4. Video competition
5. SAP Innojam
Analytics Challenge
Create a graphic that addresses one or more of the questions in the problem description. The visualization should provide insight in addressing the problem.
Teams submit their graphic and a one page description highlighting its key features. Students can use any tool to create their entries.


Problem Statement
- Where and how should the vaccine be deployed to achieve the greatest impact?
- How fast does the virus spread, and how quickly can the vaccine begin to lower the spread?
Outbreak Data – historical trends on outbreaks.
- Vaccine Map from the Council on Foreign Relations
Vaccination Rates – historical data on vaccination rate across time, across geographies (countries).
- Immunization, Vaccines and Biologicals Data Page from the World Health Organization
- Immunization Coverage from the World Health Organization
Problem Statement
- What are the potential untapped markets?
- What is the role of location in the products (i.e., ticket packages) sold?
- Is there are relationship between potential donors and ticket sales? By location? By other demographics?
- How can PAB use their advertising budget to increase public awareness and reach their target audience/donors?
Ticket Sales, 2014-2016 Seasons (Excel file, ~7.5 MB) – data and metadata are on separate tabs

Problem Statement
- What are the products and product categories that sell best in the US market?
- How effective are QVC’s campaigns in driving product sales?
- How effective are QVC’s on-air broadcast and on-air personalities in driving product sales?
- What is the impact of QVC’s social networking presence on driving product sales?
The data is a 3 month sampling of QVC data that comprises 20% of the actual volume.
QVC Sales and Campaign Data (zip file ~100MB)
QVC Data Dictionary (Full explanation of tables and fields)
AIS Analytics Challenge
What happens after you submit
- You will receive a confirmation email acknowledging your entry.
- Finalists will be notified by email on February 22, 2016 or before.
- Finalists will present their work at the AIS Student Chapter Conference April 1-3, 2016.
Deadlines
- October 9, 2015 Challenge starts. Students given data set and rules
- February 10, 2016 Challenge ends. Submissions due
- February 22, 2016 Finalists announced
- April 1-3, 2016 Final Judging and Awards Event
Prizes
1st $2000
2nd $1250
3rd $750
Honorable Mentions (2) $500
Tableau Resources: Tableau KB
"For the things we have to learn before
we can do, we learn by doing." Aristotle
Tableau: Training and tutorials
"Stand on the shoulders of giants"
"Stand on the shoulders of giants"
QVC Challenge Example
Any questions?
acast317@fiu.edu

Happy Thanksgiving!
Stay warm!
FIU AIS
By acast317
FIU AIS
Talk to AIS FIU Student Chapter students - 11.24.15


