Using COVID-19 data
with EdelweissData
Overview
- Case study 1 : Dashboard for Slovenia
- Case study 2: Estimating cases from deaths
- What is Edelweiss Data?
- Using COVID-19 data from ED with Jupyter
- How to do nightly data imports with Github Actions
- Using the power of metadata
Dashboad for Slovenia
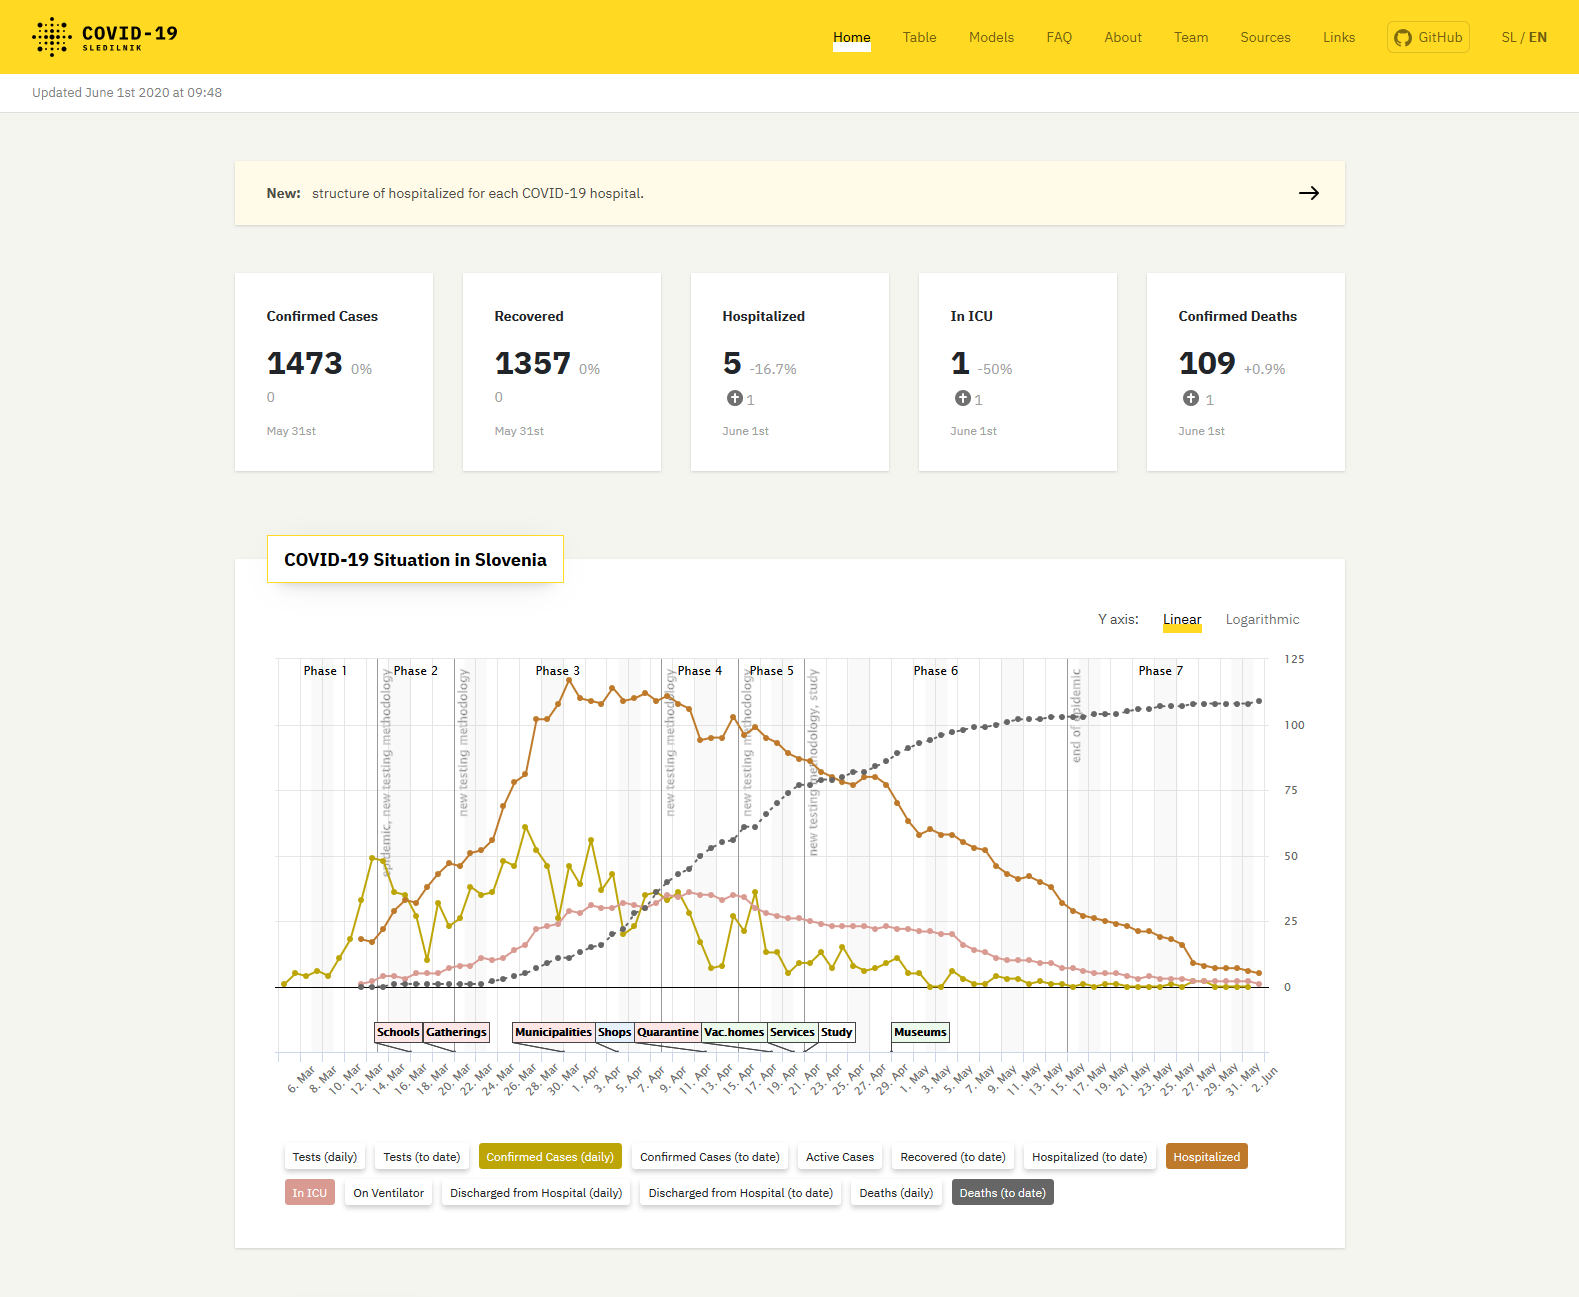
Dashboad for Slovenia
- Grassroots effort to collect and communicate data
- CSV files on Github worked fine initially
- But country comparision started to strain browser resources
Dashboad for Slovenia
Estimating case numbers from deaths
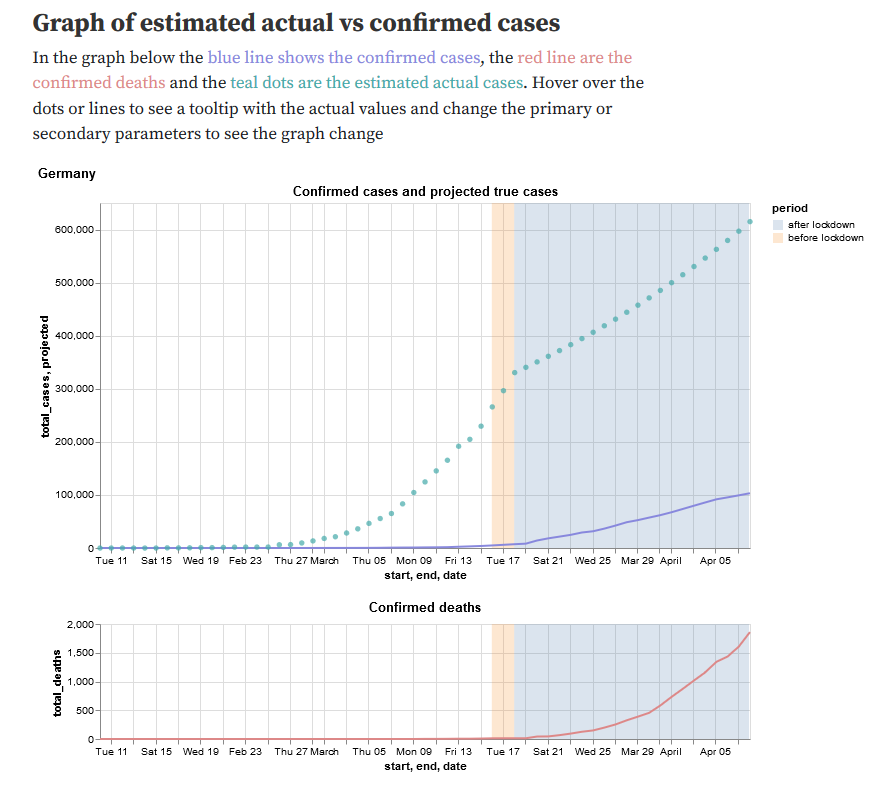
Estimating case numbers from deaths
- Limited testing capacity means case numbers are unreliable
- Deaths are harder to miss
- Given the IFR (~ 1 in 140), estimate true cases from deaths
10 total deaths
Estimating case numbers from deaths
10 total deaths
1400 infected
23 days earlier
- Limited testing capacity means case numbers are unreliable
- Deaths are harder to miss
- Given the IFR (~ 1 in 140), estimate true cases from deaths
Estimating case numbers from deaths
What is EdelweissData?
A platform for managing tabular datasets
- with rich metadata support
- strong versioning
- interactive web UIs
- APIs that work with all sorts of tools (Python, R, Excel, KNIME, ...)
4 parts of every dataset
| date | location | cases |
|---|---|---|
Metadata
JSON
📄
README
Schema
date: datetime
location: string
cases: int
How did ED help with the Slovenia Dashboard?
- Easy importing of data
- ED provides JSON APIs with powerful filtering
- Automatic updates every night + full version history
How did ED help with the case estimation notebook?
- Metadata made it possible to easily switch between worldwide and country level datasets
- Metadata describes columns, enumerates regions, provides links to extended documentation
Consume data with your favourite tool

How to unify data sources
| location | date | new_cases | total_cases | new_deaths | total_deaths |
|---|---|---|---|---|---|
| state | date | cases | deaths |
|---|---|---|---|
| Bundesland | Meldedatum | AnzahlFall | AnzahlTodesfall |
|---|---|---|---|
{ "columnNames": {
     "region": "location",
     "date": "date",
     "total-cases": "total_cases",
     "new-cases": "new_cases",
     "total-deaths": "total_deaths",
  	 "new-deaths": "new_deaths"
  }
}
{ "columnNames": {
"region": "state",
"date": "date",
"total-cases": "cases",
"total-deaths": "deaths",
}
}{ "columnNames": {
"region": "Bundesland",
"date": "Meldedatum",
"total-cases": "AnzahlFall",
"total-deaths": "AnzahlTodesfall",
}
}Our world in data Dataset
metadata.json
New York Times Dataset
metadata.json
RKI Dataset
metadata.json
Periodic data imports
One neat way: Github Actions
# This workflow runs as a cron job to download the current version of the New York Times
# covid 19 dataset for the US and publishes a new version of this dataset into edelweiss
# data
name: Update New York Times dataset

on:
  schedule:
  - cron: '15 15 * * *'

jobs:
  test:
    - name: run update
      working-directory: data-import-scripts
      env:
        REFRESH_TOKEN: ${{ secrets.REFRESH_TOKEN }}
      run: python new-york-times.py
Public beta soon ...
Thank you!
These slides:
slides.com/danielbachler/covid19-edelweiss-data
Using COVID-19 data with EdelweissData
By Daniel Bachler


