Rapidly configurable, portable, interactive visualization of
tabular results
Felix Wiegand, David Lähnemann, Felix Mölder, Alexander Schramm,
Johannes Köster
University of Duisburg-Essen
Tables are the central entity
in data analysis

Not always a single table
oncoprint + individual variant calls
differentially expressed genes + expression matrix
Not always just a table
oncoprint + individual variant calls +
differentially expressed genes + expression matrix +

State of the art
Individual tables (tsv, excel) and plots:
- easy to publish
- limited interactivity
- no jumping between corresponding items
Web applications (custom, shiny, ...):
- running server (or local installation)
- implementation overhead
The problem
Input:
- set of tables
- relations between tables
- set of rendering definitions
Output:
- portable interactive visual presentation
- static printable version
name: My oscar report
default-view: oscars

datasets:
  oscars:
    path: "data/oscars.csv"
    links:
      link to oscar plot:
        column: age
        view: oscar-plot
      link to movie:
        column: movie
        table-row: movies/Title

  movies:
    path: "data/movies.csv"
    links:
      link to oscar entry:
        column: Title
        table-row: oscars/movie

views:
  oscars:
    dataset: oscars
    desc: |
      ### All winning oscars beginning in the year 1929.
      This table contains *all* winning oscars for best actress and best actor.
    page-size: 25
    render-table:
      columns:
        age:
          plot:
            ticks:
              scale: linear
              domain:
                - 20
                - 100
        name:
          link-to-url: "https://lmgtfy.app/?q=Is {name} in {movie}?"
        movie:
          link-to-url: "https://de.wikipedia.org/wiki/{value}"
        award:
          plot:
            heatmap:
              scale: ordinal
              domain:
                - Best actor
                - Best actress
              range:
                - "#add8e6"
                - "#ffb6c1"
        index(0):
          display-mode: hidden
        regex('birth_.+'):
          display-mode: detail

  movies:
    dataset: movies
    render-table:
      columns:
        Genre:
          ellipsis: 15
        imdbID:
          link-to-url: "https://www.imdb.com/title/{value}/"
        Title:
          link-to-url: "https://de.wikipedia.org/wiki/{value}"
        imdbRating:
          precision: 1
          plot:
            bars:
              scale: linear
              domain:
                - 1
                - 10
        Rated:
          plot-view-legend: true
          plot:
            heatmap:
              scale: ordinal
              color-scheme: accent

  oscar-plot:
    dataset: oscars
    desc: |
      ## My beautiful oscar scatter plot
      *So many great actors and actresses*
    render-plot:
      spec-path: ".examples/specs/oscars.vl.json"

  movies-plot:
    dataset: movies
    desc: |
      All movies with its *runtime* and *ratings* plotted over *time*.
    render-plot:
      spec-path: ".examples/specs/movies.vl.json"


+
Dataset definition
datasets:
  oscars:
    path: "data/oscars.csv"
    links:
      link to movie:
        column: movie
        table-row: movies/Title

  movies:
    path: "data/movies.csv"
Heatmap columns
Rated:
  plot:
    heatmap:
      scale: ordinal
      color-scheme: accent
Heatmap columns
award:
  plot:
    heatmap:
      scale: ordinal
      domain:
        - Best actor
        - Best actress
      range:
        - "#add8e6"
        - "#ffb6c1"
Tick columns
age:
  plot:
    ticks:
      scale: linear
      domain: [20,100]
Bar columns
imdbRating:
  precision: 1
  plot:
    bars:
      scale: linear
      domain: [1,10]
Linkouts
movie:
  link-to-url: "https://de.wikipedia.org/wiki/{value}"
Display-mode
regex('birth_.+'):
  display-mode: detail
Custom plots
movies-plot:
  dataset: movies
  render-plot:
    spec-path: "specs/movies.vl.json"
{
    "$schema": "https://vega.github.io/schema/vega-lite/v5.json",
    "description": "A scatterplot showing movie ratings.",
    "width": "container",
    "height": 400,
    "transform": [
        {
            "calculate": "parseInt(datum.Runtime)",
            "as": "parsed_runtime"
        }
    ],
    "mark": {
        "type": "circle",
        "opacity": 0.8,
        "tooltip": {
            "content": "data"
        }
    },
    "encoding": {
        "x": {
            "field": "Year",
            "type": "quantitative",
            "scale": {
                "zero": false
            }
        },
        "size": {
            "title": "Runtime",
            "field": "parsed_runtime",
            "type": "quantitative",
            "scale": {
                "zero": false
            }
        },
        "y": {
            "field": "imdbRating",
            "type": "quantitative",
            "scale": {
                "zero": false
            }
        },
        "href": {
            "field": "link to oscar entry"
        },
        "color": {
            "field": "Rated",
            "type": "nominal"
        }
    }
}
Portability
├── index.html
├── movies
│   ├── index_1.html
│   └── table.js
├── oscars
│   ├── index_1.html
│   └── table.js
├── movies-plot
│   └── index_1.html
├── oscar-plot
│   └── index_1.html
└── static
    ├── bootstrap.bundle.min.js
    ├── bootstrap.min.css
    ├── bootstrap-select.min.css
    ├── bootstrap-select.min.js
    ├── bootstrap-table-filter-control.min.js
    ├── bootstrap-table-fixed-columns.min.css
    ├── bootstrap-table-fixed-columns.min.js
    ├── bootstrap-table.min.css
    ├── bootstrap-table.min.js
    ├── datavzrd.css
    ├── jquery.min.js
    ├── jsonm.min.js
    ├── lz-string.min.js
    ├── showdown.min.js
    ├── vega-embed.min.js
    ├── vega-lite.min.js
└── vega.min.js- interaction projected to filesystem
- no server process
- load data via script tags
- single, self contained folder
Scalability
Data storage:
- convert to JSON
- apply JSON-M
- BASE64-compatible Lempel-Ziv-Welch compression (lz-string)
If more than n rows:
- precompute paging
- no row filters, but precomputed search index for each column
- load search index on demand via iframes
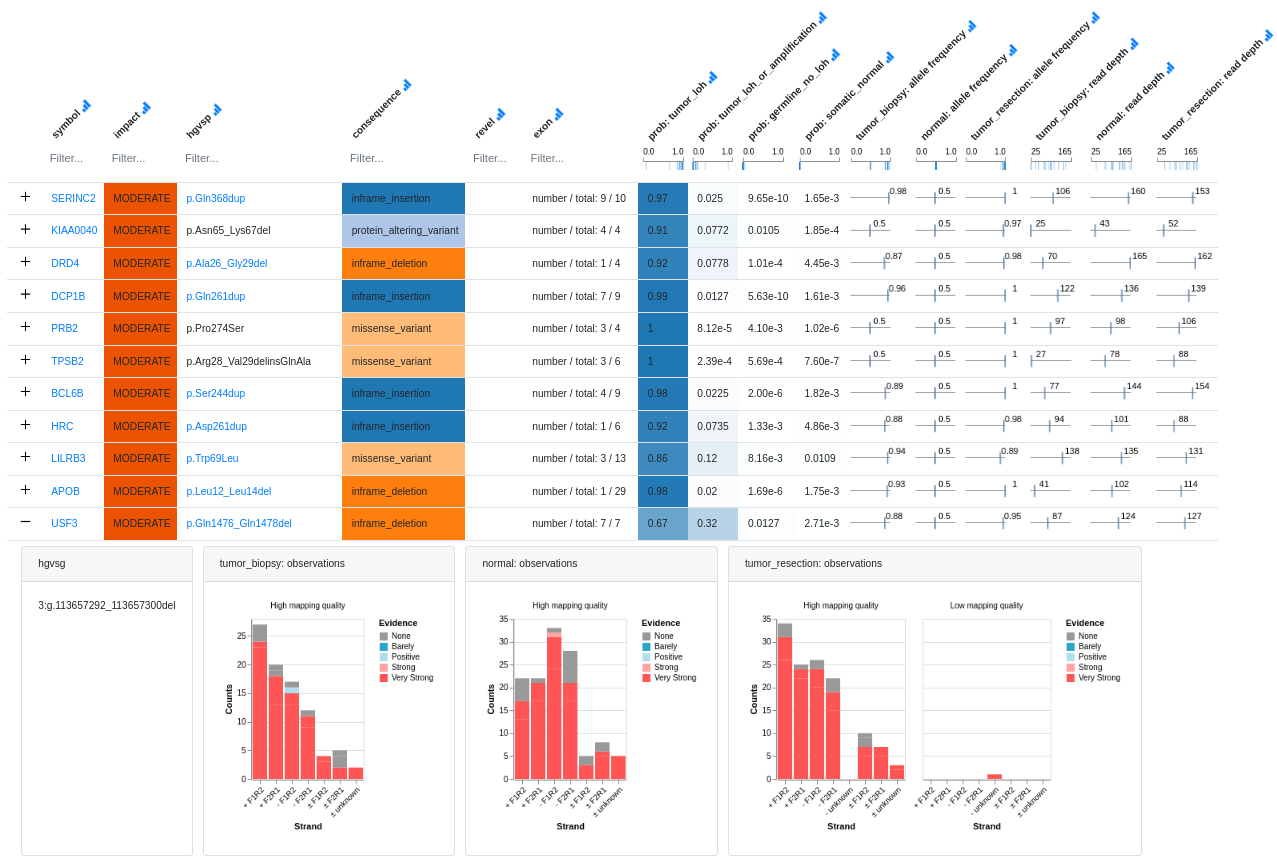
Real-world application: Varlociraptor variant calls
Conclusion
name: My oscar report
default-view: oscars

datasets:
  oscars:
    path: "data/oscars.csv"
    links:
      link to oscar plot:
        column: age
        view: oscar-plot
      link to movie:
        column: movie
        table-row: movies/Title

  movies:
    path: "data/movies.csv"
    links:
      link to oscar entry:
        column: Title
        table-row: oscars/movie
- interactive, visual exploration of tabular data
- portable, no server process
- scalable for big data at low memory footprint
- rapidly configurable via YAML

https://github.com/koesterlab/datavzrd
@johanneskoester@fosstodon.org
.svg)
Acknowledgements
Felix Wiegand
David Lähnemann
Felix Mölder
Alexander Schramm
Datavzrd
By Johannes Köster
Datavzrd
Datavzrd presentation at CSHL


