Data Visualization
What?
Why?
How?
{context}
{what is data visualization?}
{what is ethics?}
{what do you want to do with your life?}
Let's try something different...
mfviz.com/info200
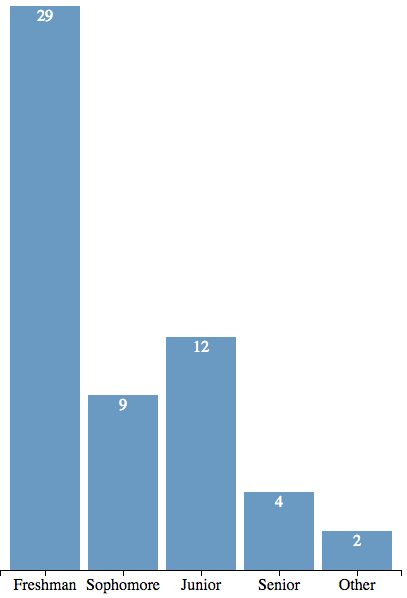
{are we on the same page?}
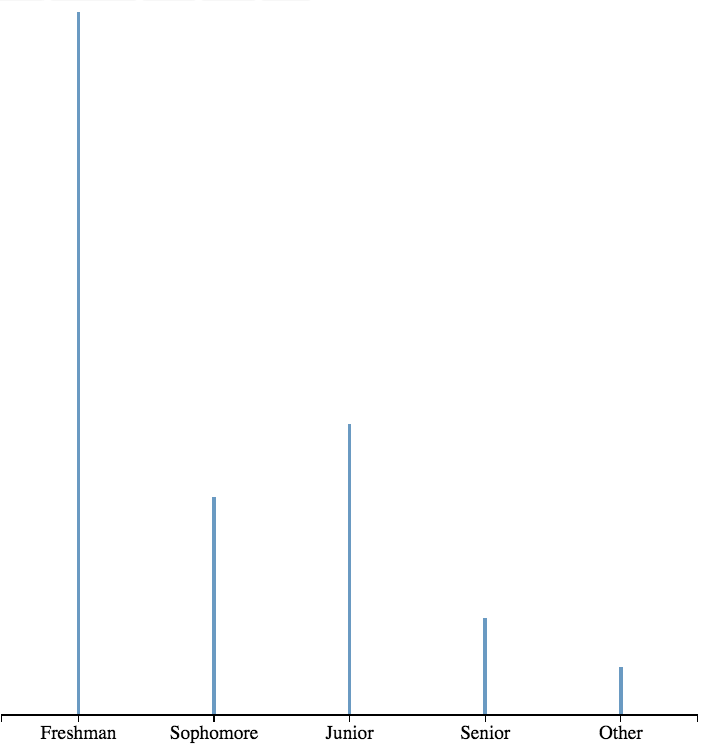
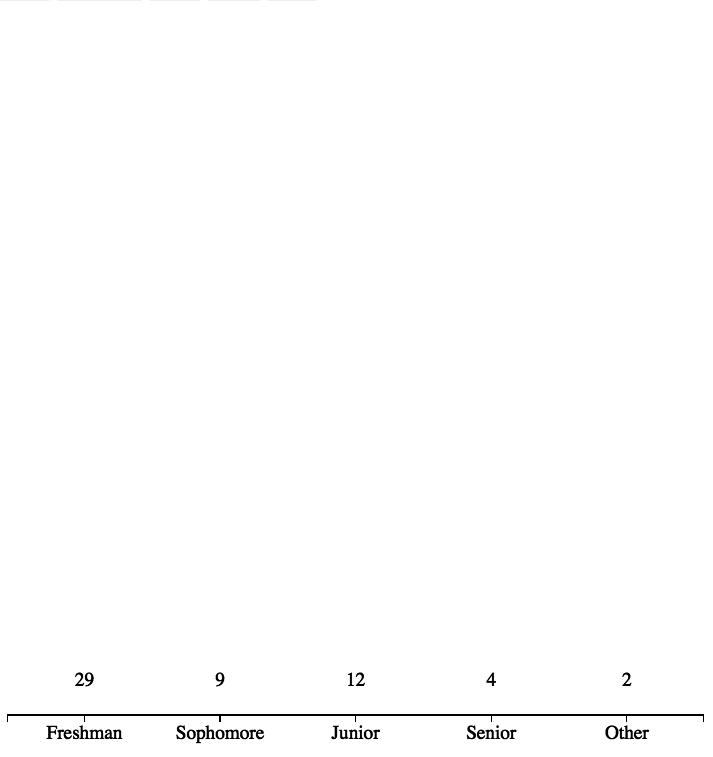
What's the data?
What's the visual encoding?
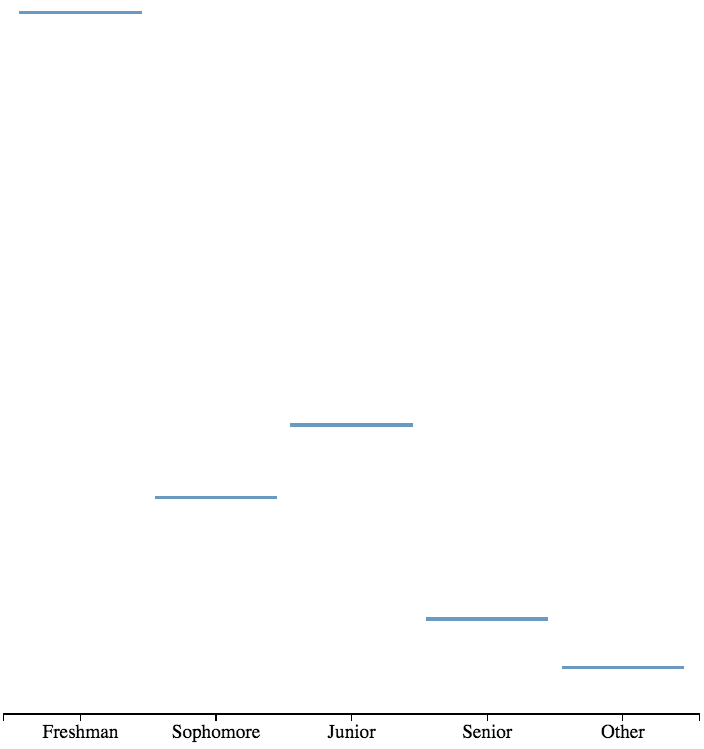
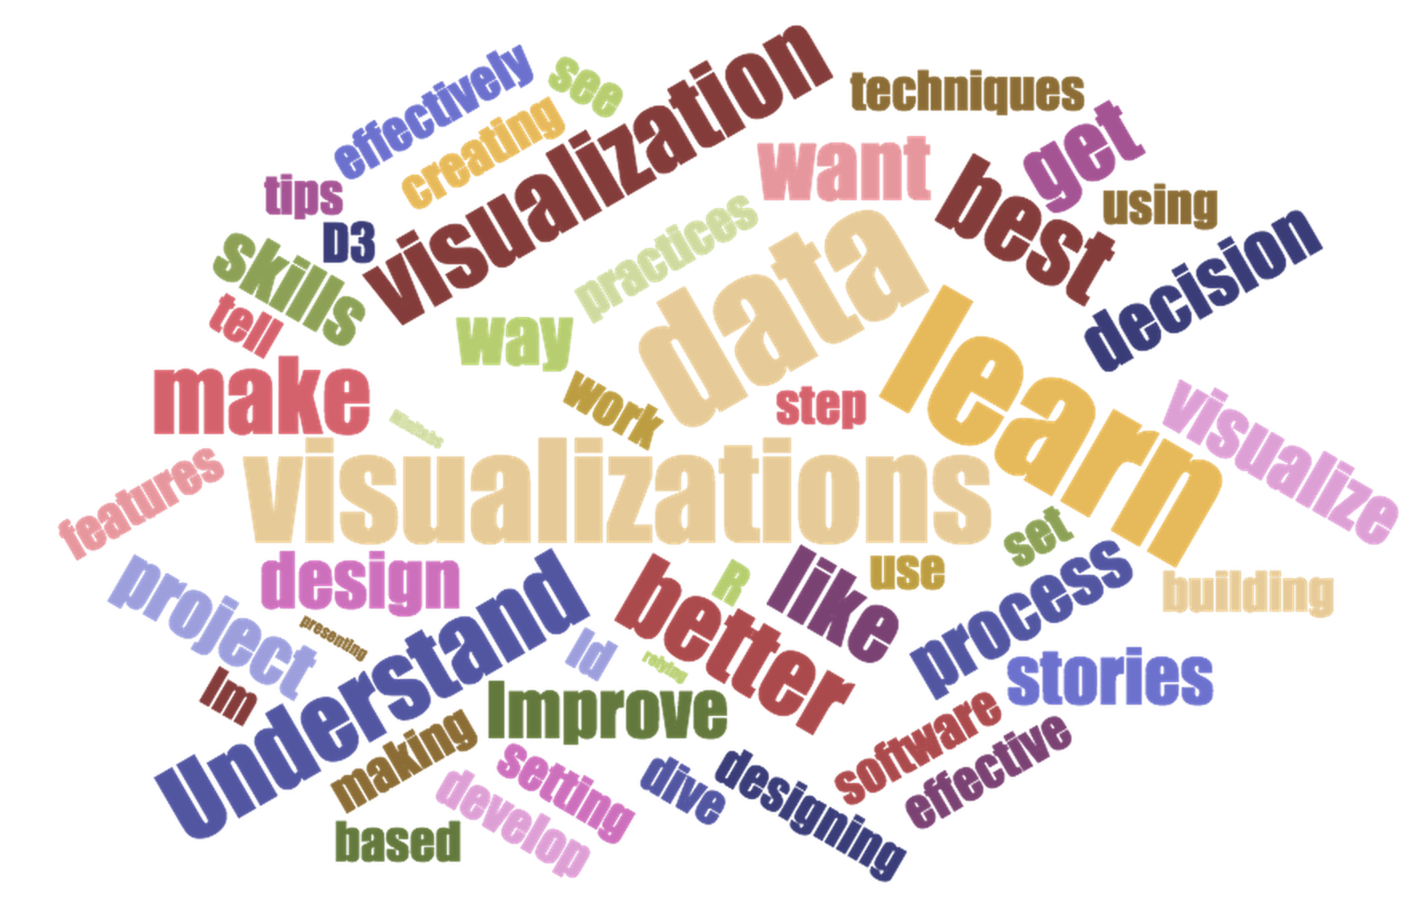
What's the data?
What's the visual encoding?
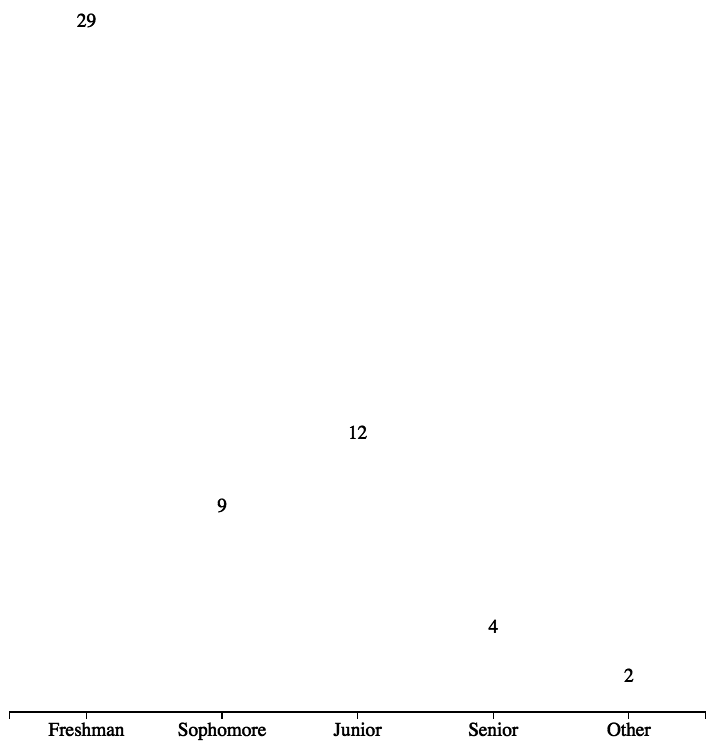
What's the data?
What's the visual encoding?
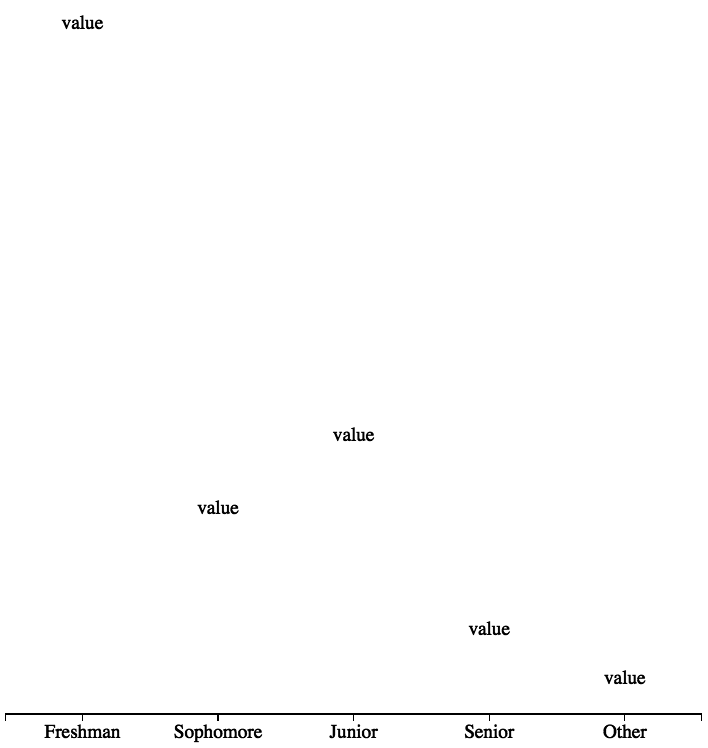
What's the data?
What's the visual encoding?
What's the data?
What's the visual encoding?
What's the data?
What's the visual encoding?
What's the data?
What's the visual encoding?
What's the data?
What's the visual encoding?
So... what is data visualization?
The visual encoding of data to enhance perception.
{lots of definitions}
{why?}
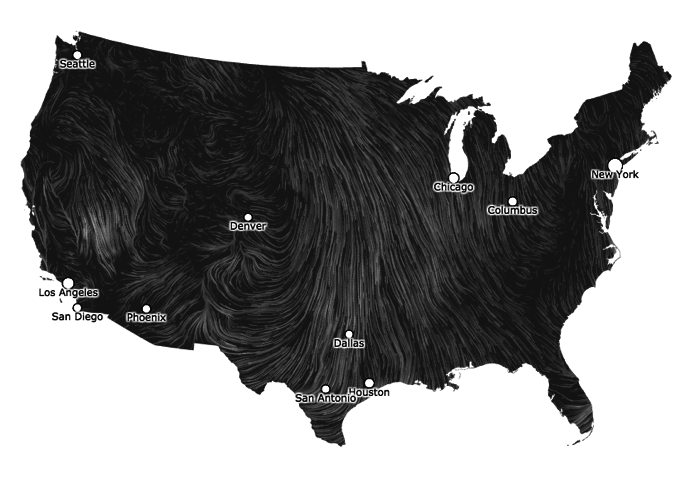
Illumination
Does the wind blow East to West, or West to East?
Exploration
How long do people live?

Impact
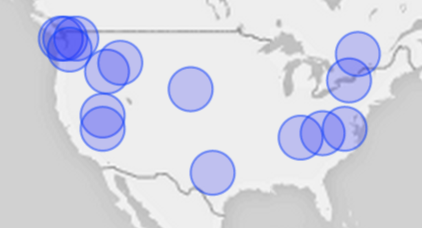
How segregated are U.S. cities?
{how?}
Visualization is a design problem
Identify user/audience
Articulate problem scope
Develop personas
Write scenarios
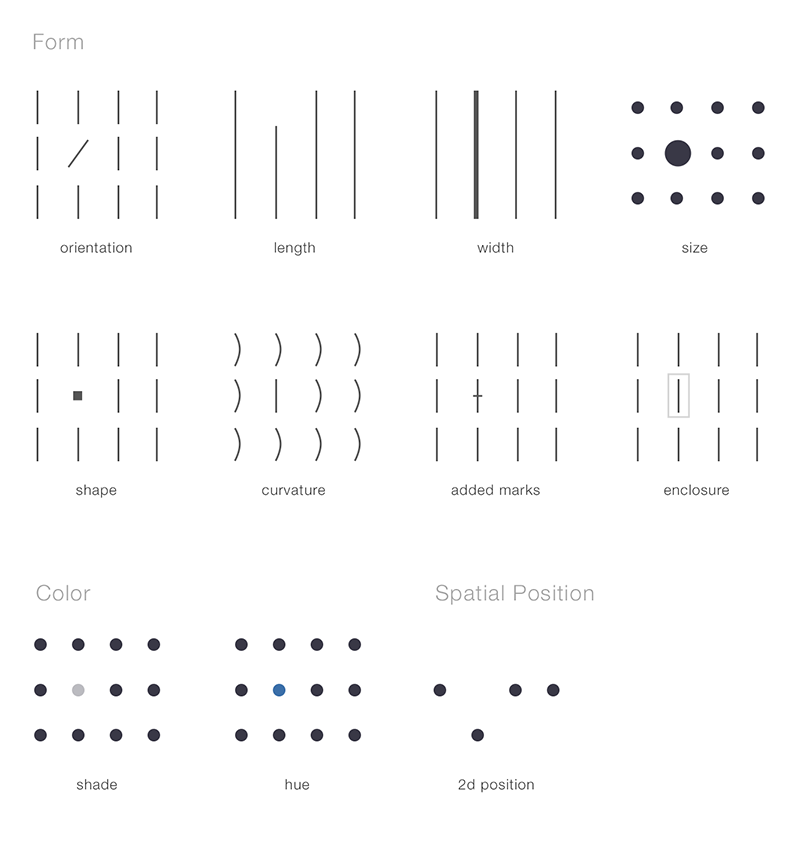
Encode data to solve problems
Maximize how quickly and accurately people decode information from graphics
Maximize how quickly and accurately people decode information from graphics
(Preattentive cognition)
How many 3's are there?
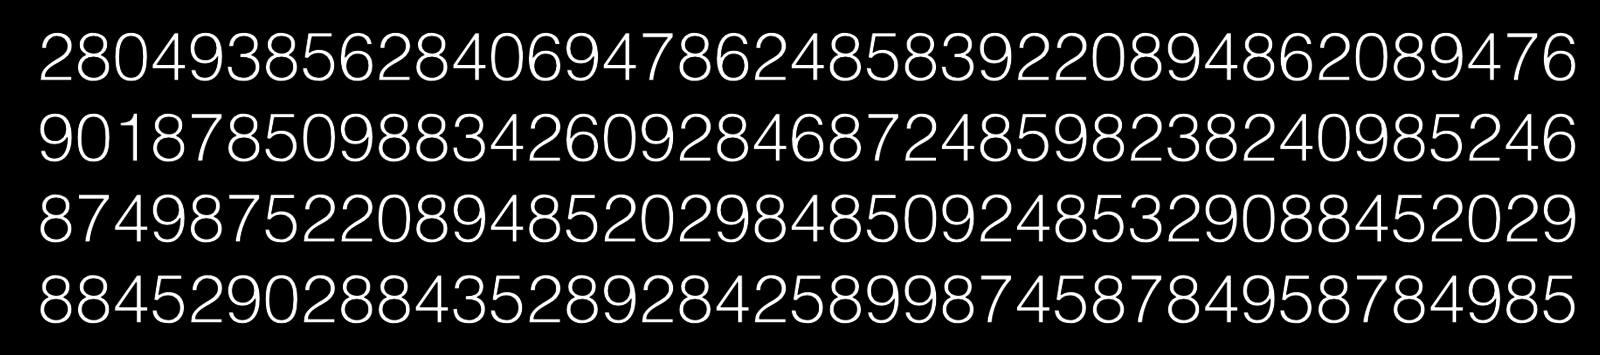
How many 3's are there?
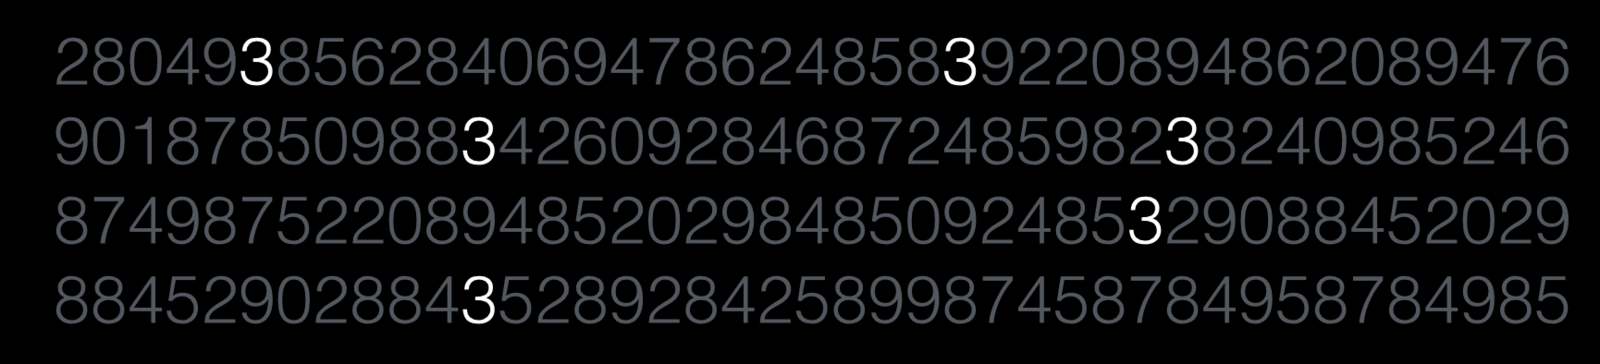
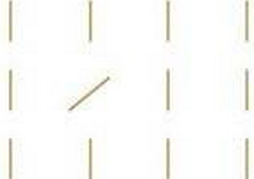
Orientation
Maximize how quickly and accurately people decode information from graphics
Maximize how quickly and accurately people decode information from graphics
(graphical perception)
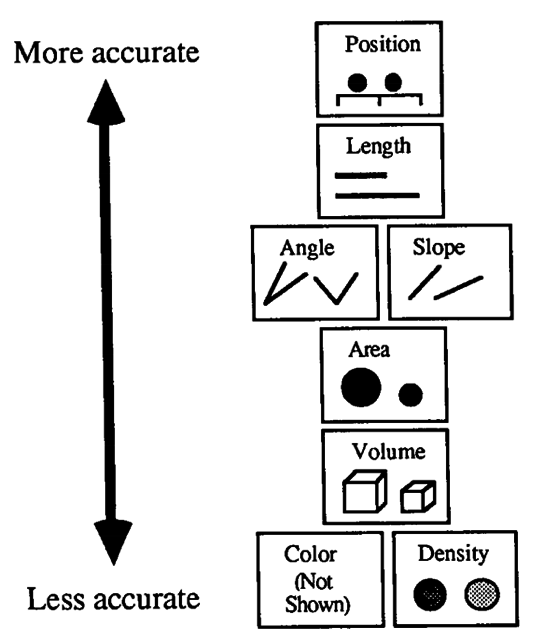
Most accurate
Least accurate
This only matters if you
know what is most
important to your user
An example
Percentage of people who smoke in each U.S. county
Estimates from 1996 - 2012, separately for men and women
Who is your user, and in what scenario would they use this information?
Which questions should be answered for your user?
What to walk away with
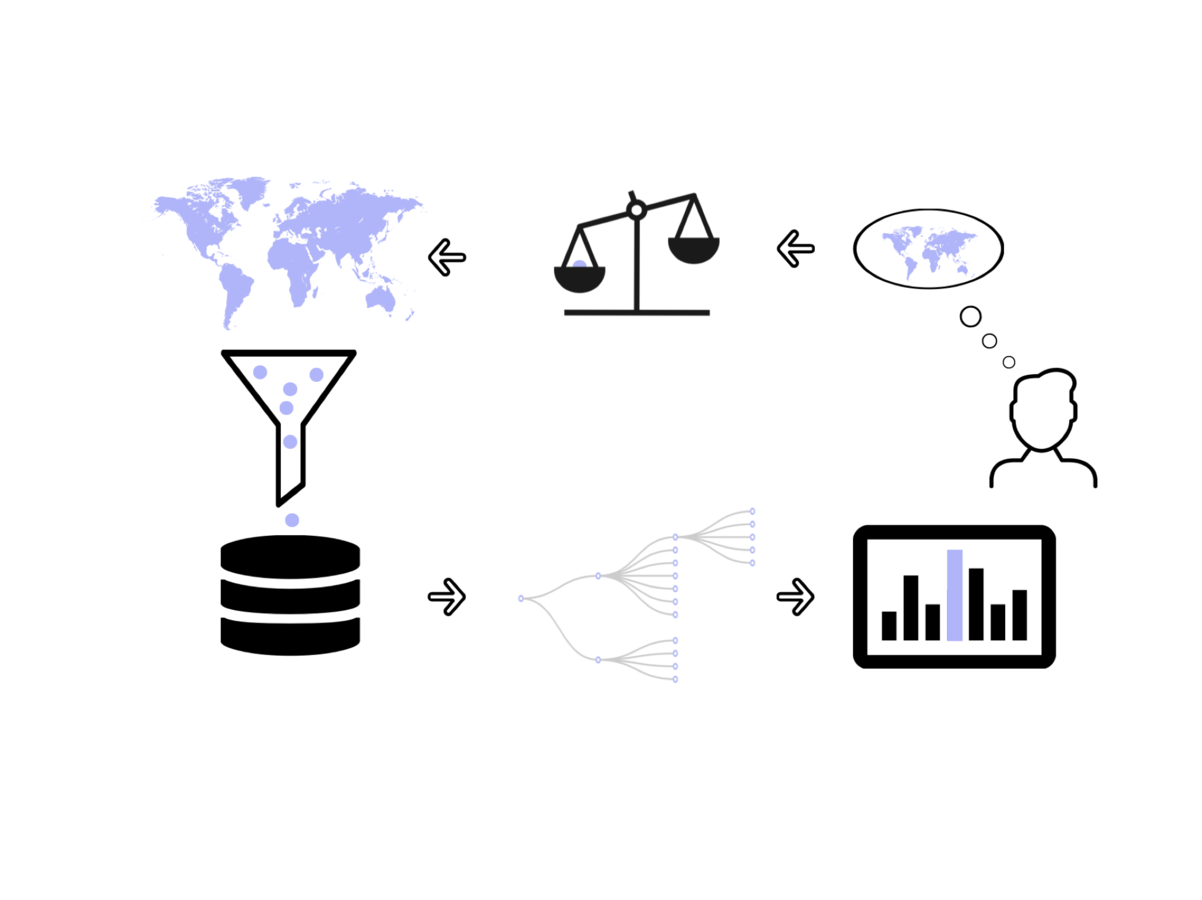
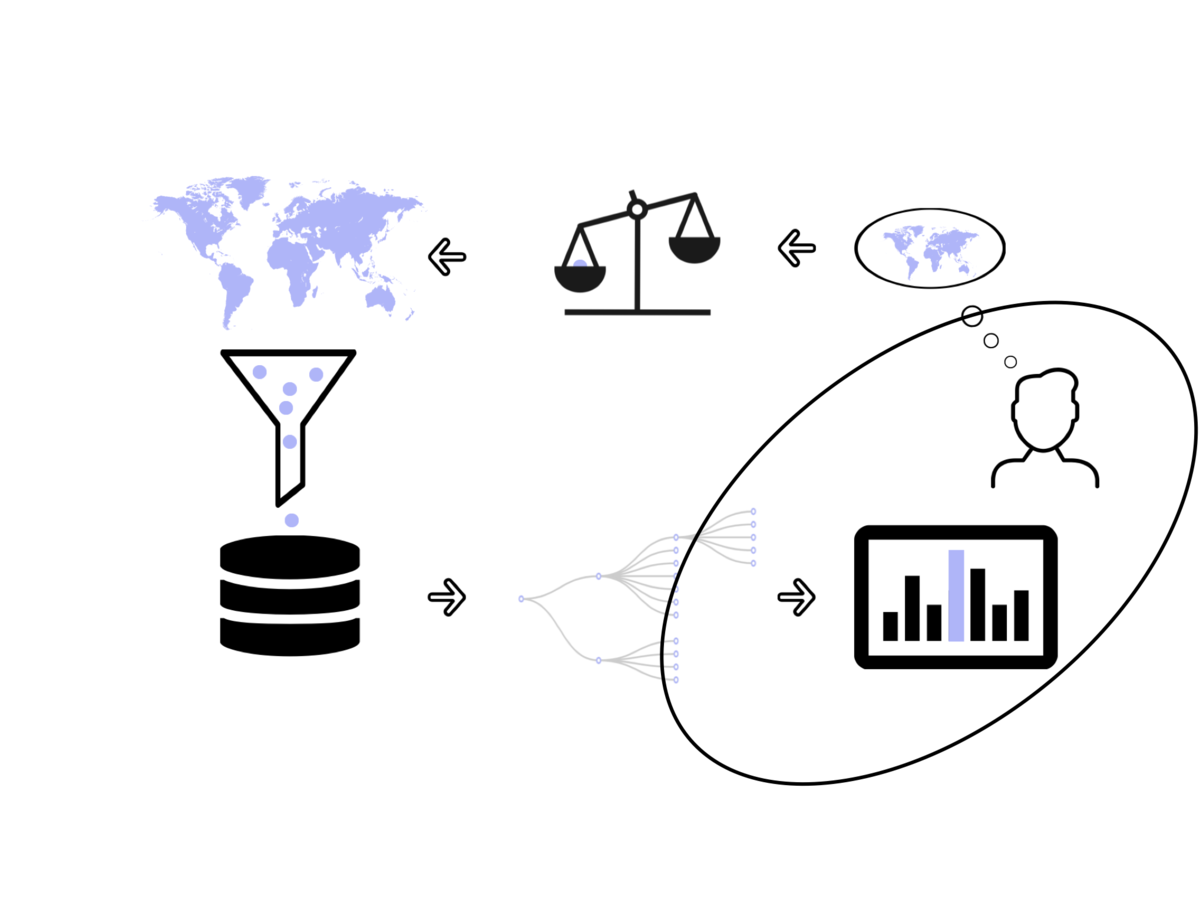
Turning data into information
Thanks!
info200-for-class
By Michael Freeman


