Learning how to learn....
Outline
Context
Learning approaches
Plotly API
{context}
So far.....

Read interesting data into an analysis program
Wrangle the data to ask questions about it

Write and share reports with interesting insights
Understanding of R programming syntax
Ability to use Git and GitHub to track code
What's next....
Interactive graphics
Dynamic applications

Introduction to analytical methods
Visualization and coding principles
Collaborative coding techniques
{learning approaches}
If you wanted to learn how to make a map in R, what steps would you take?
Well....
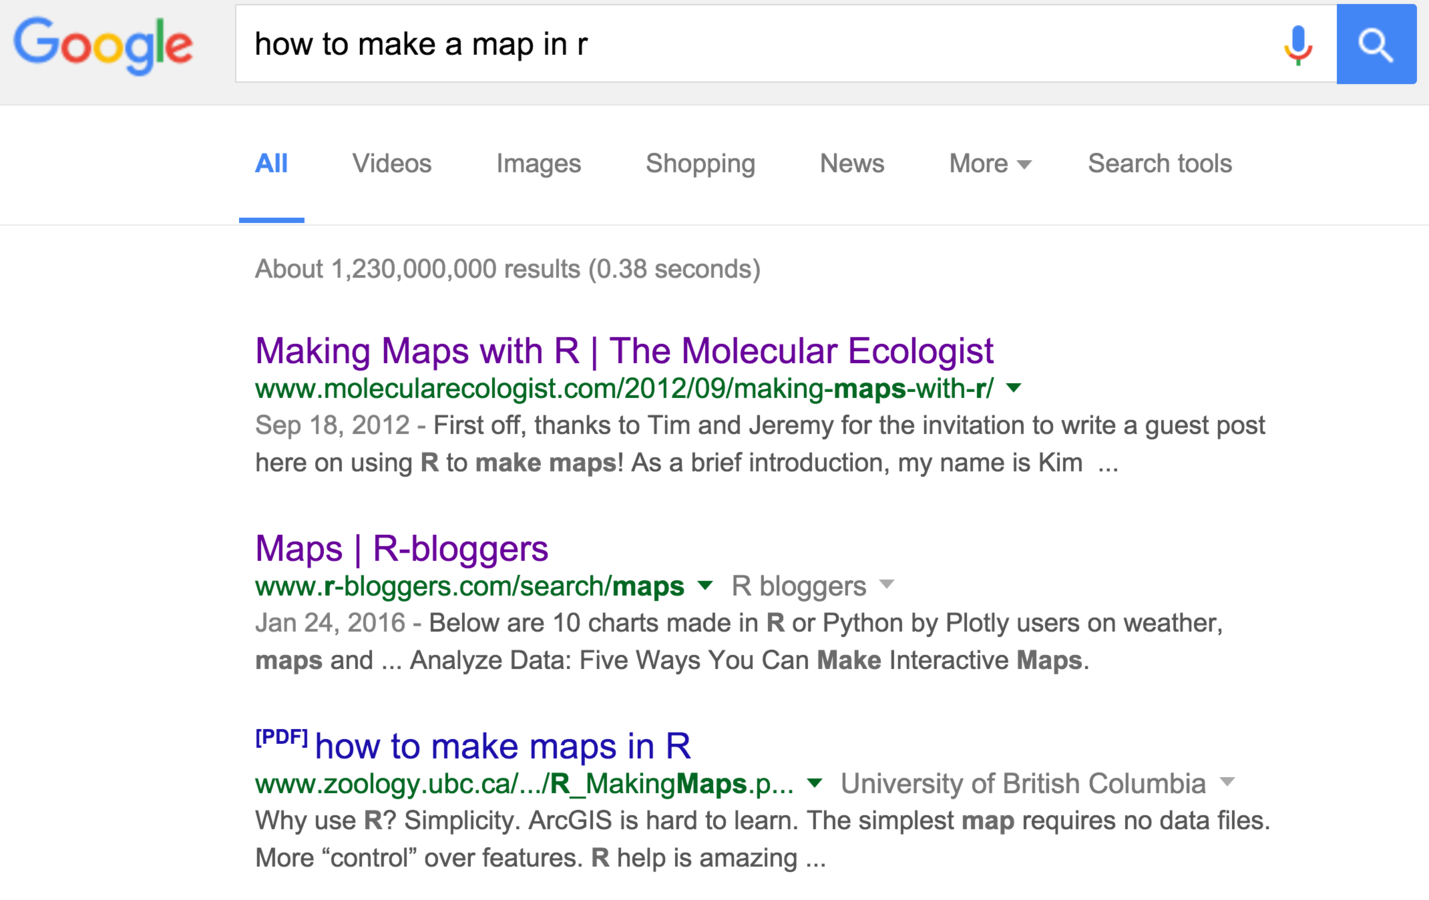
{then what....?}
Build an example
Start with documentation
Top-down Approach
Start with an example
Consult documentation
Bottom-up Approach
Exercise 1: Getting Started
Find the Plotly R documentation
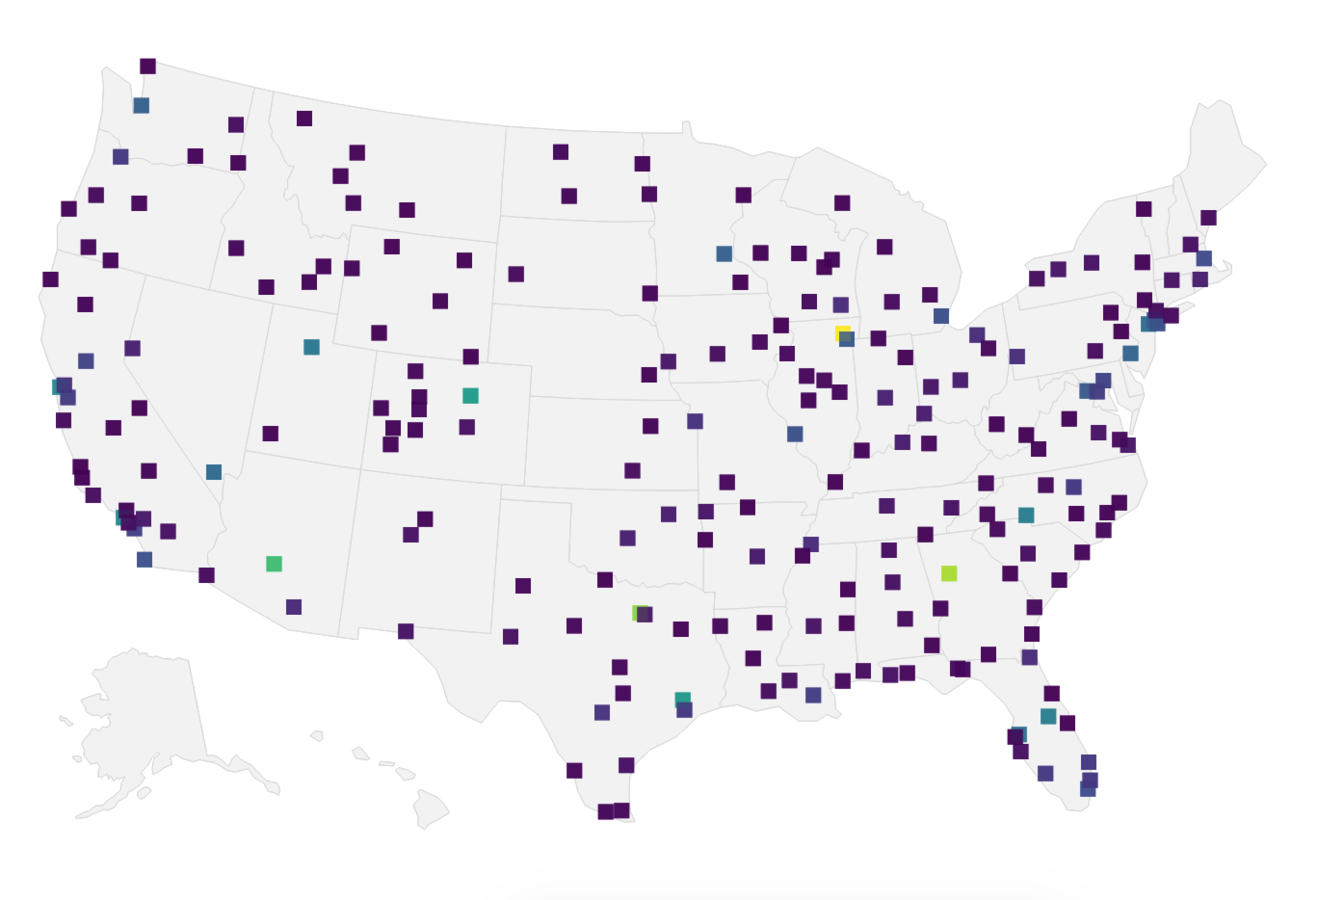
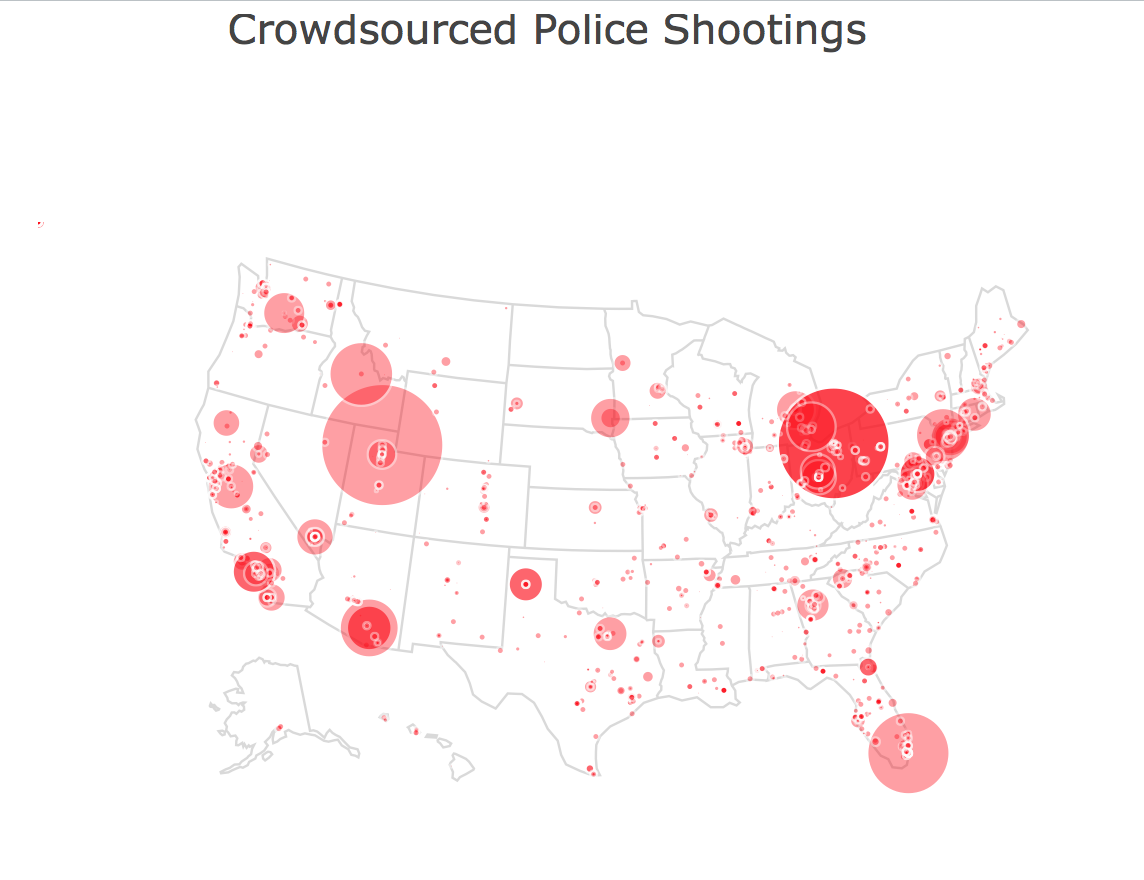
Find an example of a Plotly R bubble map
Get an example of a bubble map up and running
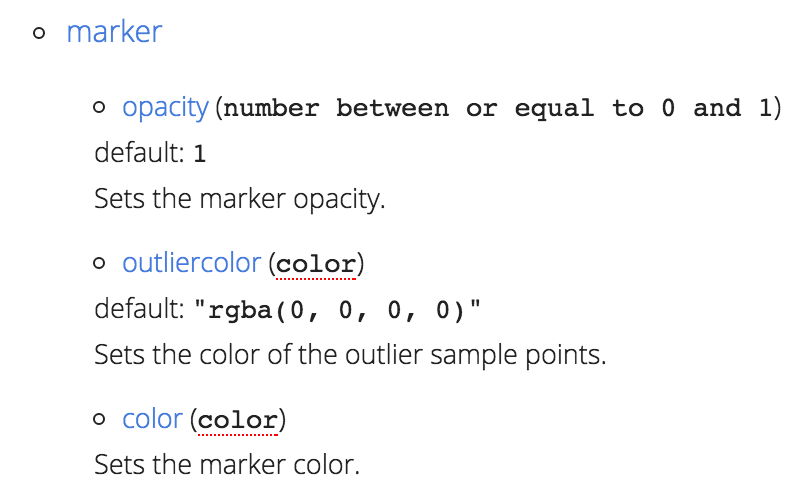
But what does all this mean?
g <- list(
  scope = 'usa',
  projection = list(type = 'albers usa'),
  showland = TRUE,
  landcolor = toRGB("gray85"),
  subunitwidth = 1,
  countrywidth = 1,
  subunitcolor = toRGB("white"),
  countrycolor = toRGB("white")
)
If you wanted to figure out what all that syntax meant, what would you do?
Reference code
Start with documentation
Top-down Approach
g <- list(
  scope = 'usa',
  projection = list(type = 'albers usa'),
  showland = TRUE,
  landcolor = toRGB("gray85"),
  subunitwidth = 1,
  countrywidth = 1,
  subunitcolor = toRGB("white"),
  countrycolor = toRGB("white")
)
Fiddle with your code
Consult documentation
Bottom-up Approach
g <- list(
  scope = 'usa',
  projection = list(type = 'albers usa'),
  showland = TRUE,
  landcolor = toRGB("gray85"),
  subunitwidth = 1,
  countrywidth = 1,
  subunitcolor = toRGB("white"),
  countrycolor = toRGB("white")
)
Exercise 2: Digging in
Determine what different parameters actually do
Use whatever approach is appropriate
Take good notes!
So, what else do you need to do get the map that you want?
Get your data in the right format
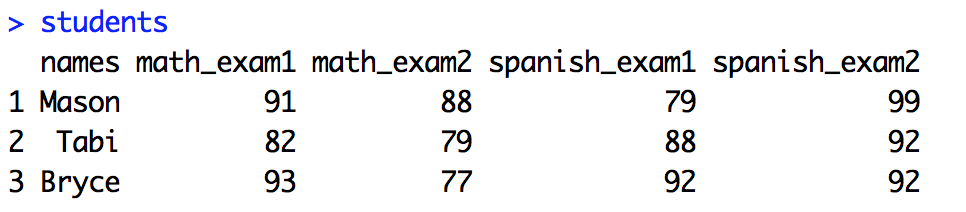
Wide data
Long data
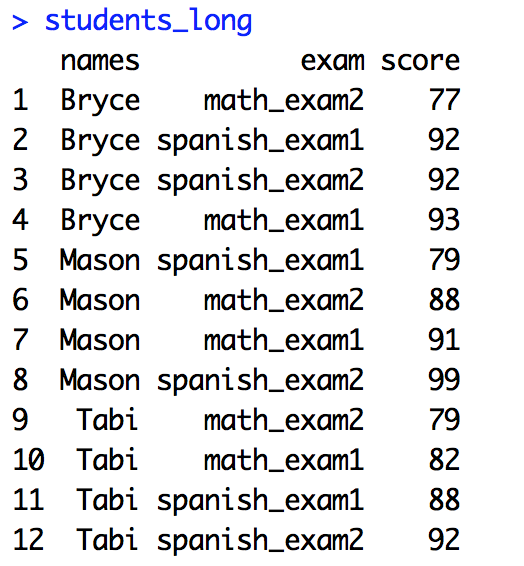
Long data will let you group by column and compare computed values
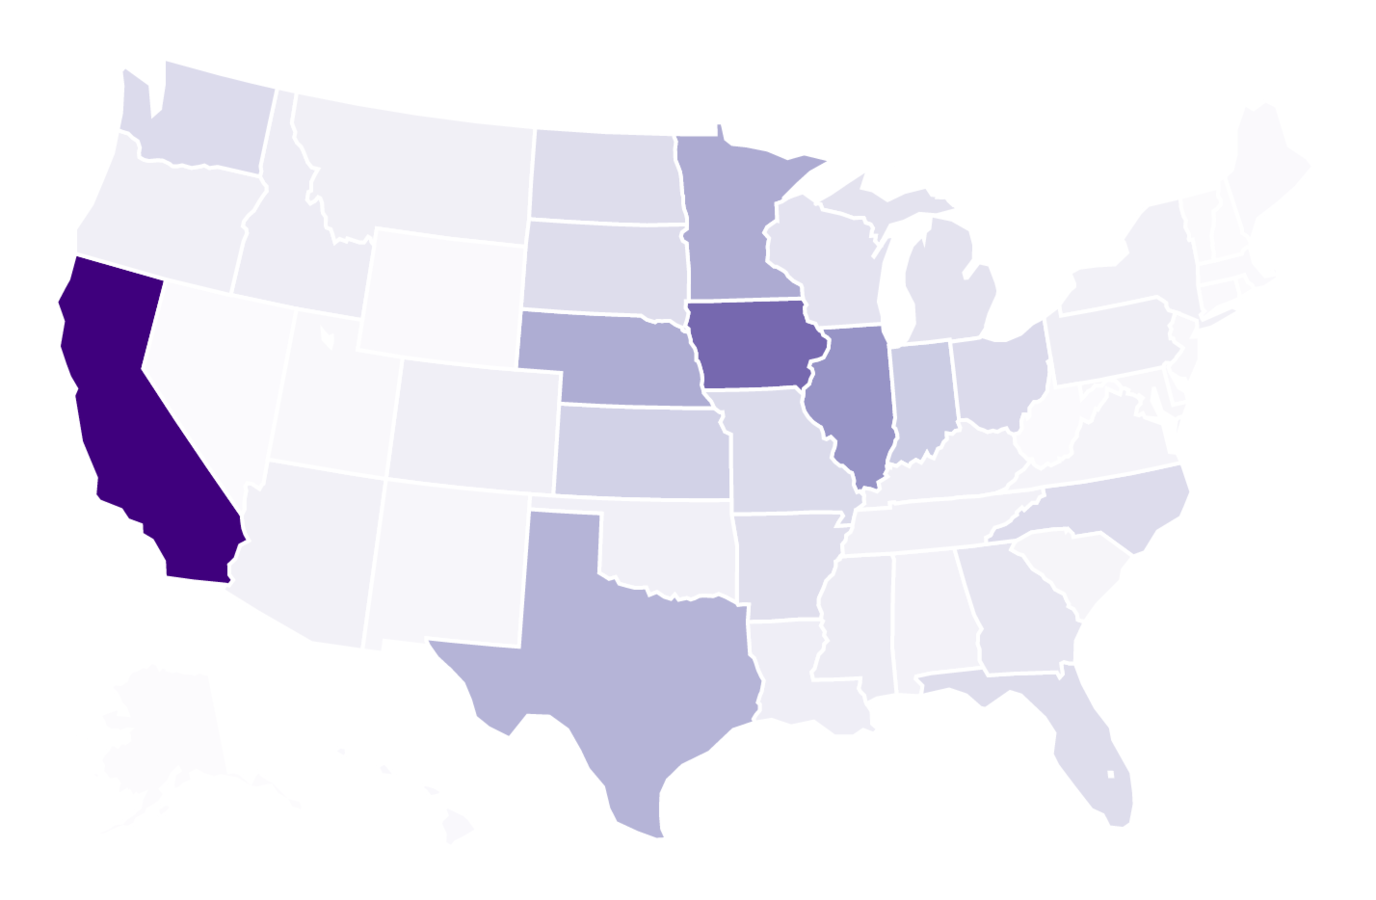
Find other examples
Consult documentation
Add / remove parameters
Exercise 3
Resources
Plotly documentation
Plotly examples
Assignments
Assignment-6: Mapping Shootings (due Wed. 2/17)
plotly-mapping
By Michael Freeman


