Scalability:
Sometimes You
Have to Scale Down
Ron DuPlain
ron.duplain@gmail.com
slides.com/rduplain/scaling-down
ron.duplain@gmail.com
slides.com/rduplain/scaling-down
Maternity Neighborhood at Private Practice Inc
maternityneighborhood.com
Charlottesville VA USA
2014-05-21
maternityneighborhood.com
Charlottesville VA USA
2014-05-21
We make software for maternity care.
We started nights and weekends.

We launched in 2011.
We got users.
We built a great team.
This is a story about scale.
This is a story about scale?
We use Linode.
Ubuntu LTS - GNU/Linux - Python - PostgreSQL
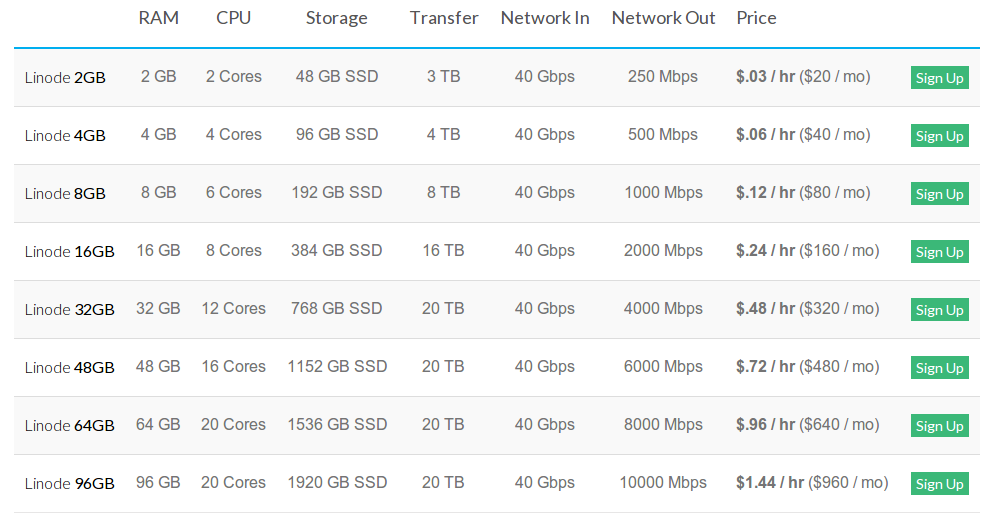
The application we're discussing fits on one box.

Linode has alerts.
Late October ...
"I upped the threshold on these alerts, but we're still getting them. It seems that our disk I/O rate has gone up considerably in the last month. I'm all for letting the server do its thing, but it's worth some investigation as to what a normal value is, so that we can get alerts when something abnormal is going on."

Linode has configurable alerts.
(TIL this is the max setting.)
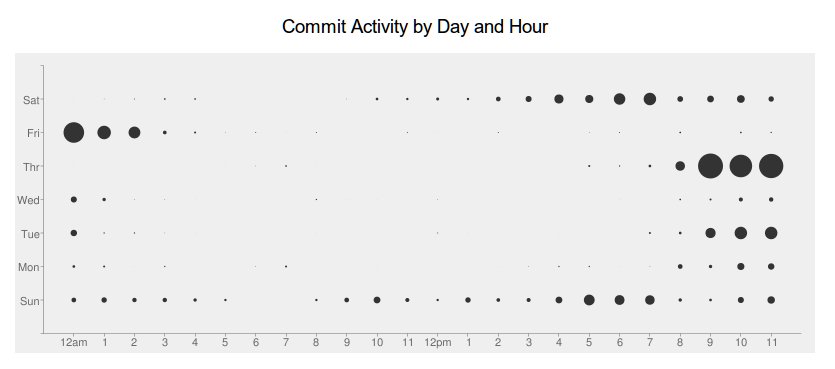
This is a story about disk I/O.
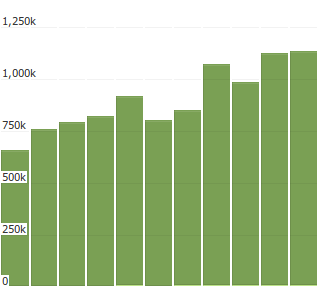
Linode has graphs.
We've found Linode to be stable.
... but on a Monday in March ...
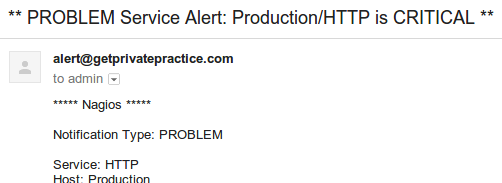
BEGIN FORENSICS
What's happening?
- Server IO is locked up.
- Is it a hardware failure?
- Something's up with our postgres workers.
- Is problem in postgres, or are we just seeing symptoms?
- One thing is clear: stability is gone.
- What do we do?
Don't panic.
Digression #1: John Cleese on creativity

"We can usefully describe the way in which people function at work in terms of two modes: open and closed. ... By the closed mode, I mean the mode that we are in most of the time when we are at work. We have inside us a feeling that there's lots to be done ... we're probably a little impatient ... it's a mode in which we are very purposeful ... but not creative. By contrast, the open mode is relaxed, expansive, less purposeful, in which we are probably more contemplative, more inclined to humor, which always accompanies a wider perspective, and consequently more playful." [Creativity is a way of operating, one that is playful.]
We considered logging slow queries
but that is really costly.
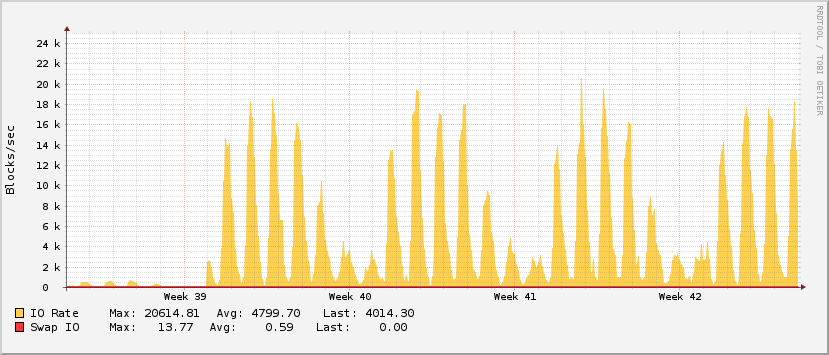
me: What date is "Week 39" in graphs? September 23, 2013?

Linode: Thank you for contacting Linode support! You are correct in that week 39 for 2013 is from September 23rd to the 29th.

me: Let me double-check. The hash mark "Week 39" on the graph means Sep 23. You have a hash mark for "Week 00" which makes me think that the hash mark for "Week 39" is actually Sep 29, 2013. Could you clarify?

Linode: Sorry for the confusions. After further review, it does appear that week 39's dates fall between September 29th - October 5th. Since our graphs count weeks as 00 - 51 the 39th week is actually going to be 40th week on the regular calendar.

me: Okay, so if I'm looking at the graphs on this page: [URL] The axis mark which says "Week 39" means October 5. Correct?

Linode: Yes, that's about where that would be.

me: I need the exact date, not an approximation. Please confirm the exact date.

Linode: I'm sorry for the confusion, but that is the correct date, but we couldn't tell you exactly which tick mark aligned with the text would mark an exact to-the-second moment in time. That's as specific information as you will be able to get.

me: Okay. I just needed the date, not the time. Thanks.

Linode: Week 39 ends on October 5th as mentioned.
Oct 5 ...

What happened that weekend?
Oct 5
- Deployment? No git tags near then.
- Server hardware change? No. That was last week.
-
No unusual traffic in http logs.
-
OS updates? /var/log/apt/history.log ... No.
- Third party API usage? Nothing unusual.
- Strange new user? Nothing unusual.
- Configuration change? etckeeper ? Nothing.
Digression #2: Systems Thinking

Staring at iotop, everything comes into view.
DISK READ  DISK WRITE          COMMAND
 0.00 B/s  50.00 MB/s          postgres: ....
Staring at iotop, everything comes into view.
DISK READ  DISK WRITE          COMMAND
 0.00 B/s  50.00 MB/s          postgres: .... SELECT
DISK READ  DISK WRITE          COMMAND
 0.00 B/s  50.00 MB/s          postgres: .... SELECT
- At this point, we have total clarity.
-
Why is a SELECT statement causing 50MB/s write?
Exactly. - Log temporary files.
- See SELECT query in /var/log/postgresql/.
#log_temp_files = -1         # log temporary files equal or larger
                             # than the specified size in kilobytes;
                             # -1 disables, 0 logs all temp files
log_temp_files = 0
work_mem = 5MB # was 1MB
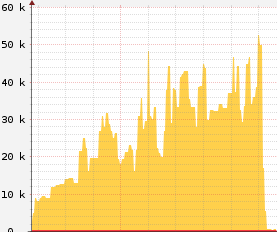
There's activity on the right,
it's just 100x smaller.
it's just 100x smaller.
Digression #3: the command line.
A personal statement:

11 years ago, I decided that if I could do something from the command line, I would. This was among the most important decisions in my career. This sent me on a journey, a Unix journey, in which understanding was one seemingly minor but important epiphany after another toward a more complete understanding of what the computer is actually doing. With the command line, I learned how to inspect a machine, how to converse with it, and ultimately, how to build my own environment to do anything -- including working from a remote machine as though it were right in front of me.

                                                          --rduplain


PS: Learn GNU Screen or tmux and use emacs or vim inside it.
Scalability: Scaling Down
Most applications I see really do fit on one box. More boxes, more problems. Load balancers are an important tool, but only when you have load. Not all load. Some load goes away with insightful optimizations to your code and to your configuration.
Measure.
Then scale.
resources for the minimalist
- Docs. No really, these are useful.
- Monitor
- Logging
- log response times with your request logs
- in Python, I log with `time.time`. simple.
- pandas and IPython Notebook for inspection
- generate UUID to list with ALL logs inside request

- One of the better talks on explaining SQL's purpose,
and how database systems deal with disk I/O. -
Nevermind that it has SQLAlchemy in the title.
- Slides.
- Optimization:
- Asking the DB a single question
- Doing EXPLAIN and adding indexes
We asked the wrong question.
We asked: Do you see anything causing IO issues?


The one on the right is 30x. Same trend; different scale.
We should have asked: When did this start?
When we did, we soon understood.

Scalability: Sometimes You Have to Scale Down
By Ron DuPlain
Scalability: Sometimes You Have to Scale Down
Our disk IO has been trending upward for months. It has hit the point where our application is crashing during peak load. We need to do something, and we need to do it fast. Increase resources? Add more nodes? Hurry! This was our situation, with an application built on Python and PostgreSQL. To find the answer, we had to ask the right question. In the end, we scaled down our load with a one-line configuration change. I'll tell our story.


