shirley wu
(@sxywu)

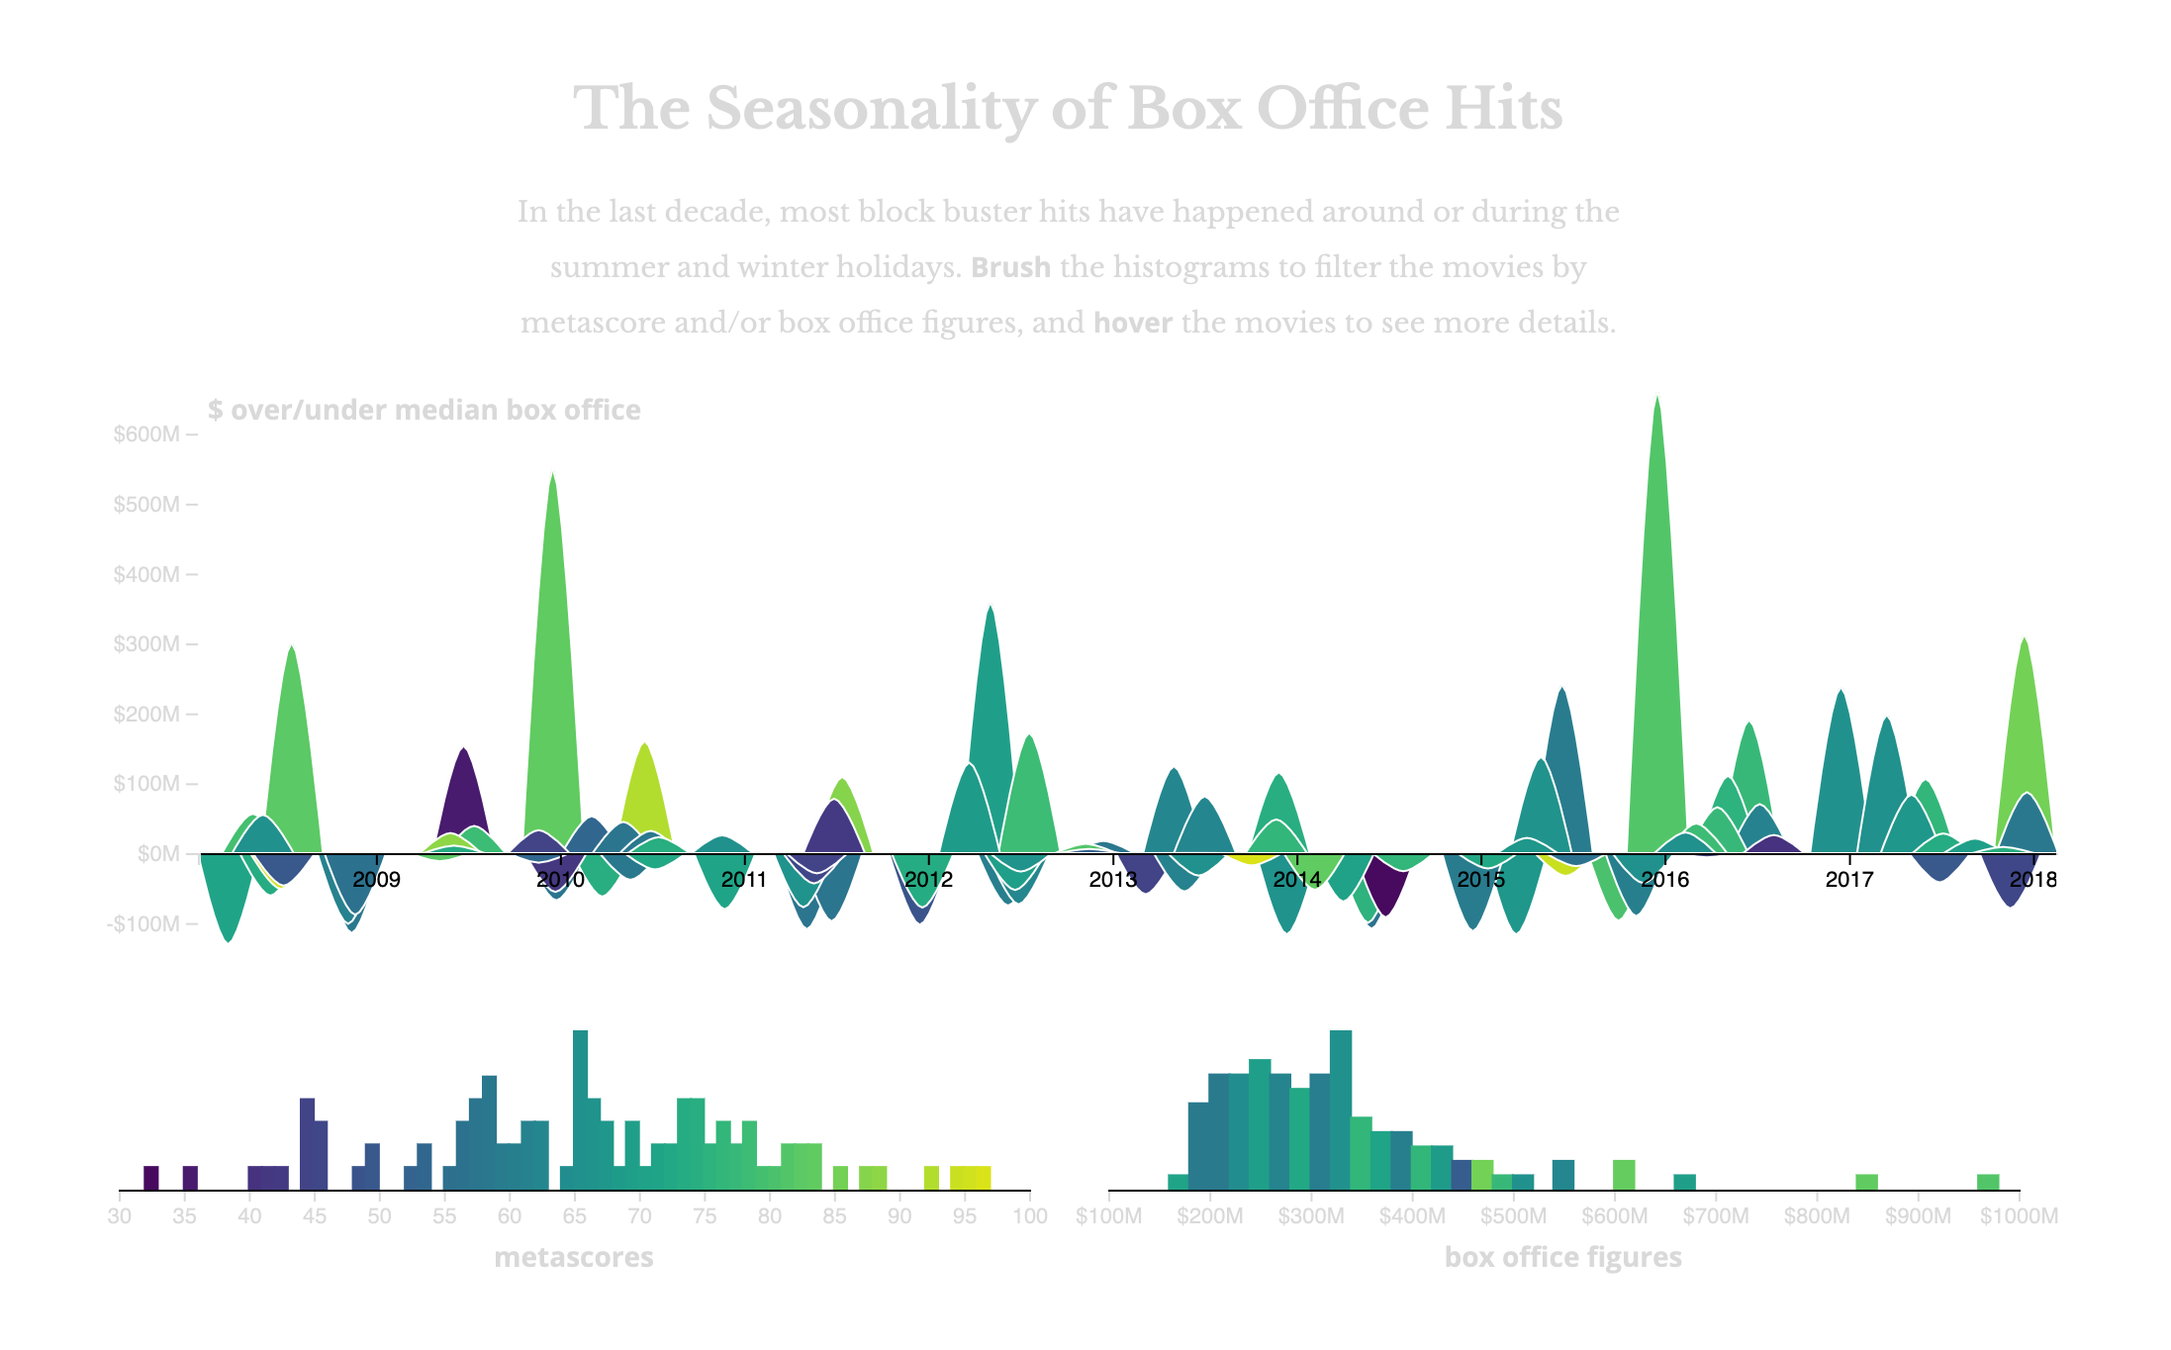
what we're building
what we'll be using
for creating
data visualizations for the web

for building
interactive single-page applications
but why use them together?
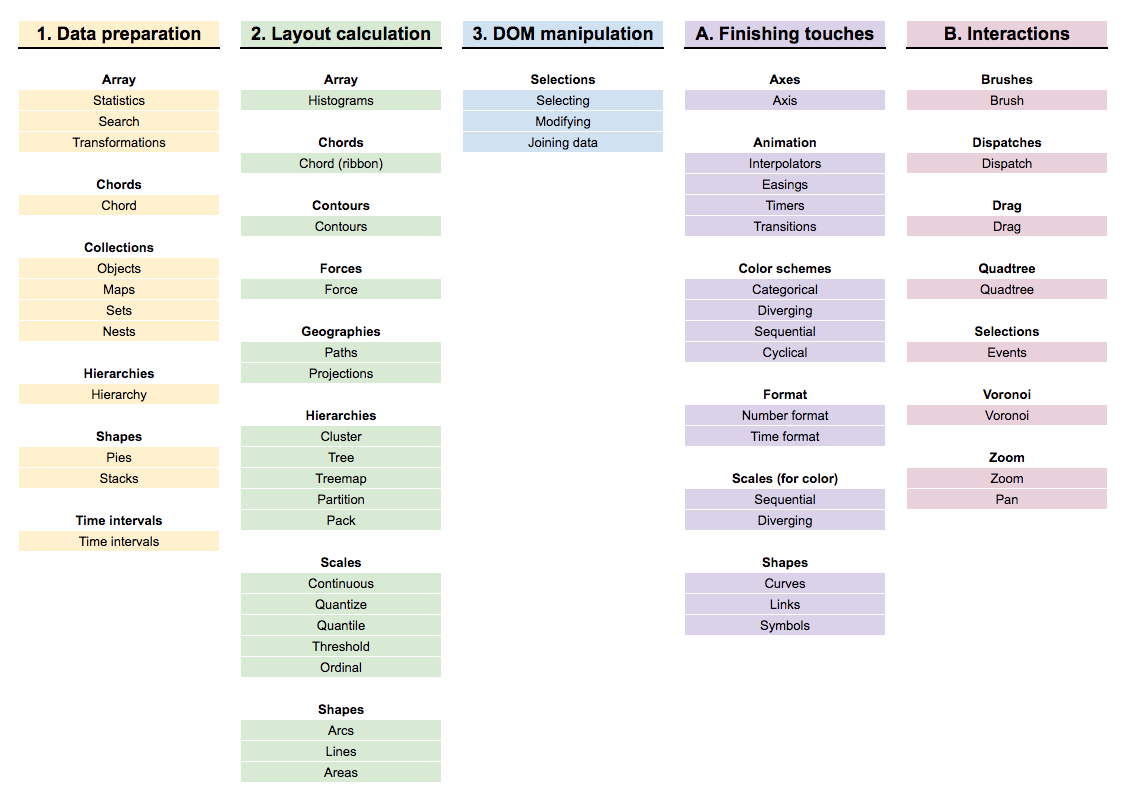
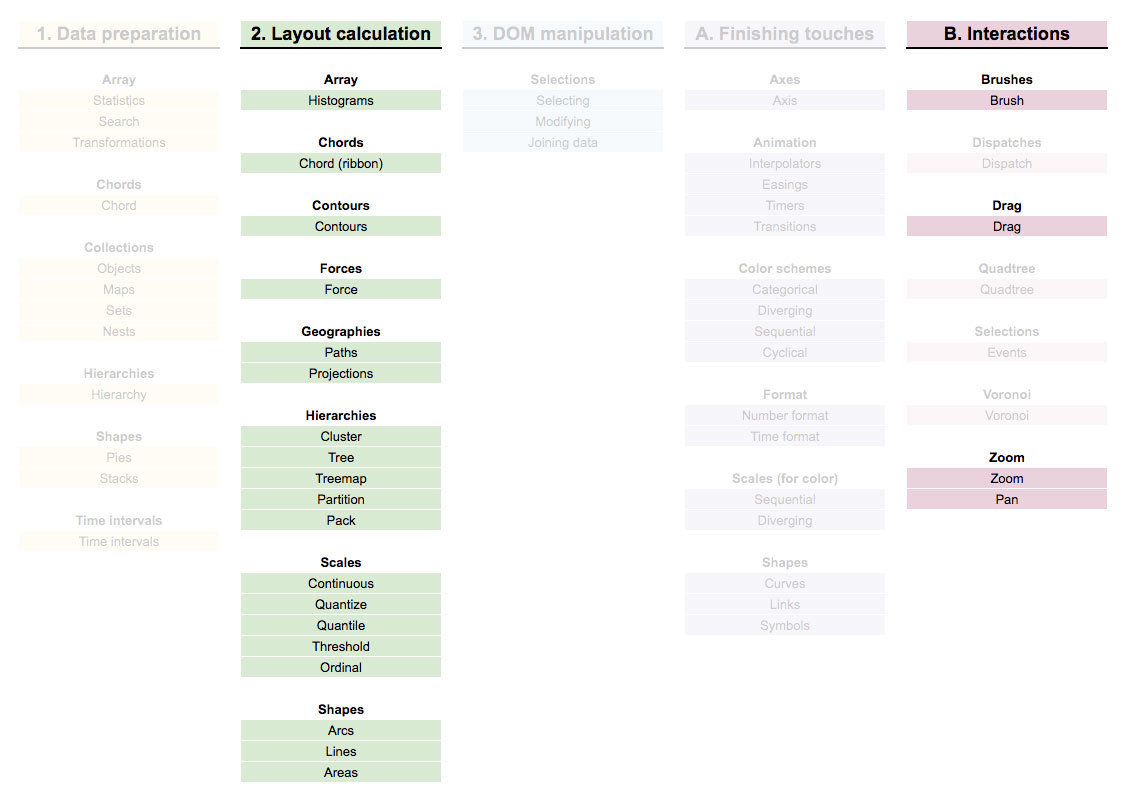
the D3 library is really big
and has a lot of functionality
| raw data | → | scales | → | x / y width / height angle / radius color |
| raw data | → | forces hierarchies |
→ | x / y positions |
| raw data | → | geographies | → | x / y positions |
| raw data | → | chords shapes |
→ | svg path commands |
brush
drag
zoom + pan
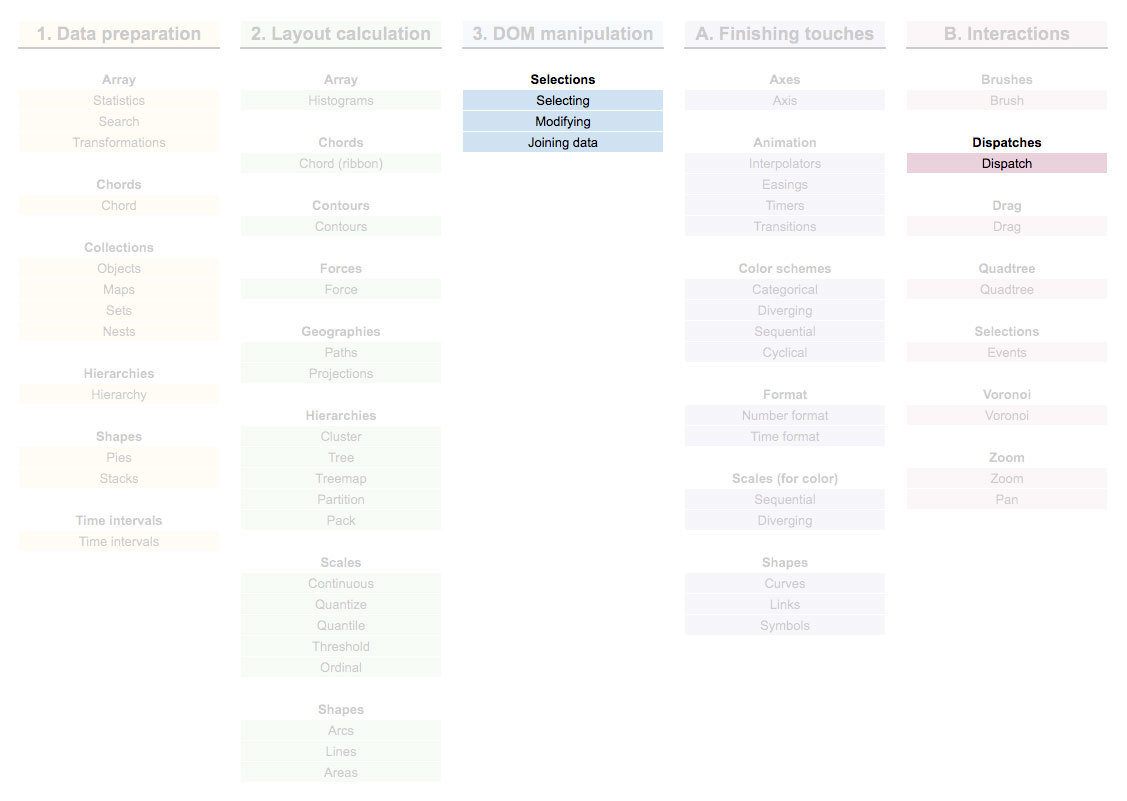
Vue's declarative rendering and reactivity system are great replacements for
D3's enter-update-exit and dispatch system
declarative rendering
<svg>
  <path v-for='d in arcs' :key='d.id' :d='d.path' :fill='d.fill' stroke='#fff' />
</svg>
const svg = d3.select('svg')
const path = svg.selectAll('path')
.data(arcs, d => d.id)
.join('path')
.attr('stroke', '#fff')
.merge(path)
.attr('d', d => d.path)
.attr('fill', d => d.fill)reactivity system
<template>
  <svg :width='width' :height='height'>
    <path v-for='d in arcs' :d='d.path' />
  </svg>
</template>

<script>
export default {
  name: 'areachart',
  data() {
    return {
      width: 1000, height: 300,
      movies: [],
      arcs: [],
    }
  },
  watch: {
    movies() { ... }
  },
}
</script>
tells Vue to track changes for datum
when datum changes, do something
v-bind: (or :) tells Vue to automatically update if datum changes
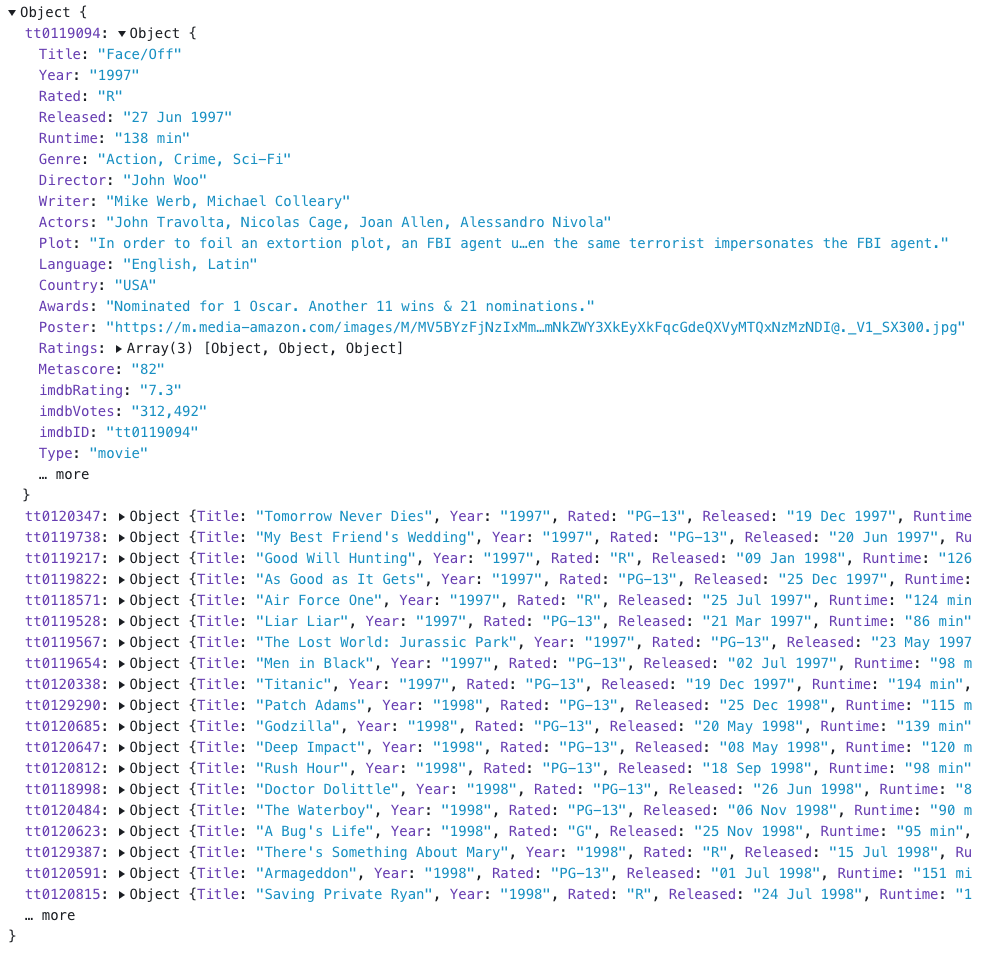
1. translate raw data into screen space
- release date → x-position
- box office → y-position
- metascore → color
2. calculate svg paths for drawing shapes
3. render to DOM
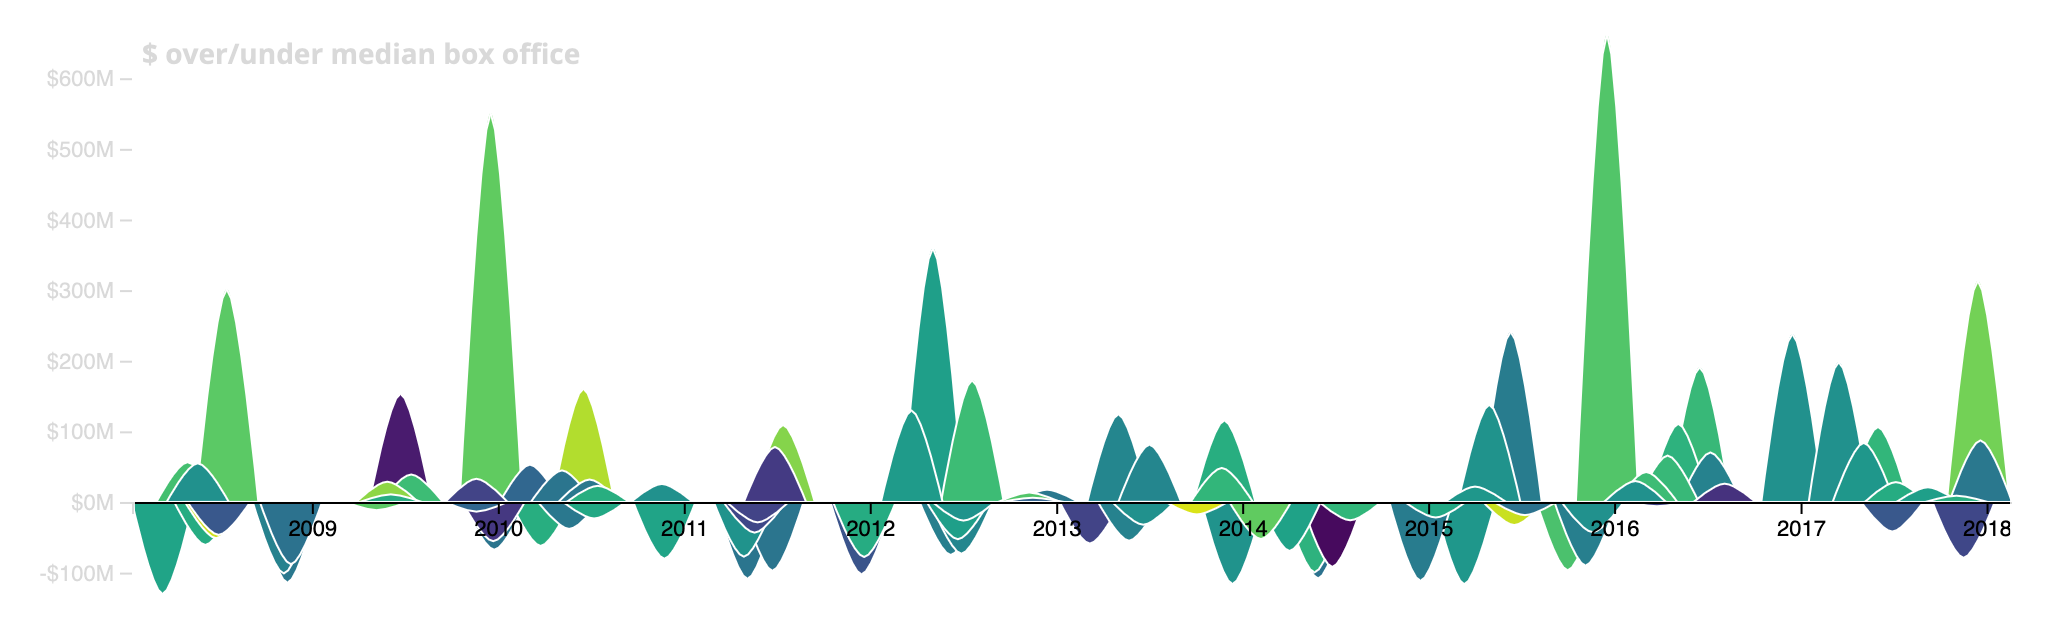
our custom visualization
1. translate raw data into screen space
- release date → x-position
- box office → y-position
- metascore → color
2. calculate svg paths for drawing shapes
3. render to DOM
our custom visualization
1. d3 scales
2. d3 shapes
3. declarative rendering
scales
map from raw data (domain)
to display (range)
const width = 800
const height = 600
const data = [
  {date: new Date('01-01-2015'), boxOffice: 2349800},
  {date: new Date('01-01-2017'), boxOffice: 32487652},
  ...
]

const min = d3.min(data, d => d.date)
const max = d3.max(data, d => d.date)
const xScale = d3.scaleTime()
  .domain([min, max])
  .range([0, width])

// d3.extent returns [min, max]
const extent = d3.extent(data, d => d.boxOffice)
const yScale = d3.scaleLinear()
  .domain(extent)
.range([height, 0])- get min/max of date
- initialize time scale
- pass date min/max to domain
- map to min/max width in range
shapes
const data = [
  {date: new Date('01-01-2015'), boxOffice: 2349800},
  {date: new Date('01-01-2017'), boxOffice: 32487652},
  …
]

const area = d3.area()
  .x(d => xScale(d.date))
  .y1(d => yScale(d.boxOffice))
  .y0(yScale(0))

area(data)
generates SVG or Canvas path commands to draw shape
- initialize
- specify x/y accessor
- specify baseline
- generate SVG path string
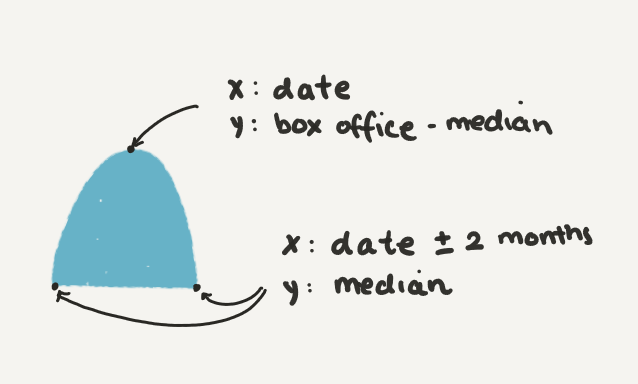
d3.area()
pass in array of points, draws line through points and fills area underneath
exercise time!
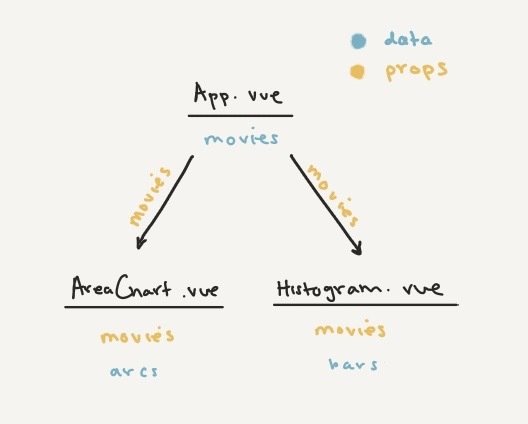
Set up AreaChart.vue
- in App.vue, pass movies into AreaChart.vue
- in AreaChart.vue, receive movies as props
- Watch for changes on movies
release date → scaleTime → x-position
box office → scaleLinear → y-position
metascore → scaleSequential → color
use d3.area() to create an array of objects
each object has id, path, fill
exercise time!
Draw SVG paths with Vue
exercise time!
Interactions
Set up D3 brush in Histogram.vue
- Create empty <g> element
- Initialize d3.brushX() with bounds
- Pass <g> element to D3 brush
exercise time!
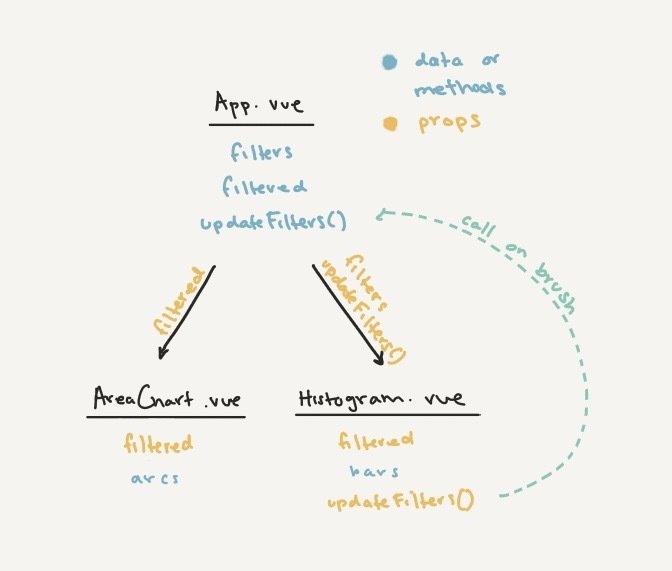
In Histogram.vue
- On brush, calculate bounds
In App.vue
- Filter for movies within bounds
- Set filtered movies in data()
- Update AreaChart.vue and Histogram.vue with filtered movies
exercise time!
Add animation in AreaChart.vue
- Create transition-group around SVG paths, set @enter and @leave
- Use Greensock to vertically scale SVG paths on enter and leave
exercise time!

thank you!
Frontend Masters: Vue & D3
By Shirley Wu