Big Data
What is behind the Big Word?
Impactory
October 8th, 2014
Data Analytics at A-Syst SA
All opinions my own
Who am I?
- I work as a Data Analytics Consultant for an IT Consultancy.
- Masters in Mathematics
- Specialized in Statistics and Machine Learning
- Expert on Big Data and Data Analytics
- Past work experience has included Amazon and Import.io
What is Big Data?
-I use the functional definition I prefer a flexible but functional definition of big data. Big data is
when your business wants to use data to solve a problem, answer a
question, produce a product, etc., but the standard, simple methods
(maybe it’s SQL, maybe it’s k-means, maybe it’s a single server with a
cron job) break down on the size of the data set, causing time, effort,
creativity, and money to be spent crafting a solution to the problem
that leverages the data without simply sampling or tossing out records.
Descriptions
Where do distributions come from?
- Many are empirically derived
- Someone recorded many observations
- Derived the function that
best fit the observed frequencies
Student's t distribution
William Sealy Gosset
(working with Karl Pearson)
Yields of barley
while brewing at Guinness
Approximates Gaussian
distribution with small samples
Functions
PDF in its generic form:
f(x) = P(X = x)
(probability of observing a value
of x for a random variable X)
Functions
That f(x) takes a different form
depending on the distribution.
Gaussian distribution:

Note there are three non-constants:
sigma, x, and mu
Functions
f(x) = P(X = x)
Output of the function is a probability
(i.e., a positive real number between
0 and 1, inclusive)
Integral over the entire
sample space must equal 1.
(Or, for a PMF, the area must equal 1)
Probability
Really, the P(X = x) is infinitesimally small, ~ 0
for continuous PDFs
Often give probabilities by integrating
over an interval
i.e., what's the probability
of the interval
10.01 <= x <= 10.02
Parameters
Distributions have one or more parameters
Given the parameters, you can output
a probability for any value of x.
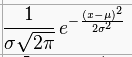
Gaussian distribution (aka "normal distribution"):
parameters are mean (mu) and variance (sigma^2)
Why?
Why even bother using a PDF?
Why not just use data?
(aka empirical PDFs/CDFs)
Parametric PDFs map
probabilities to all
outcomes, not just
observed outcomes
OK, so which one to use?
Things to consider
1) Do you already have data?
2) Do you have substantive knowledge
that suggests your data will follow
a (family of) distribution(s)?
3) Can you reasonably fit a
distribution to your data?
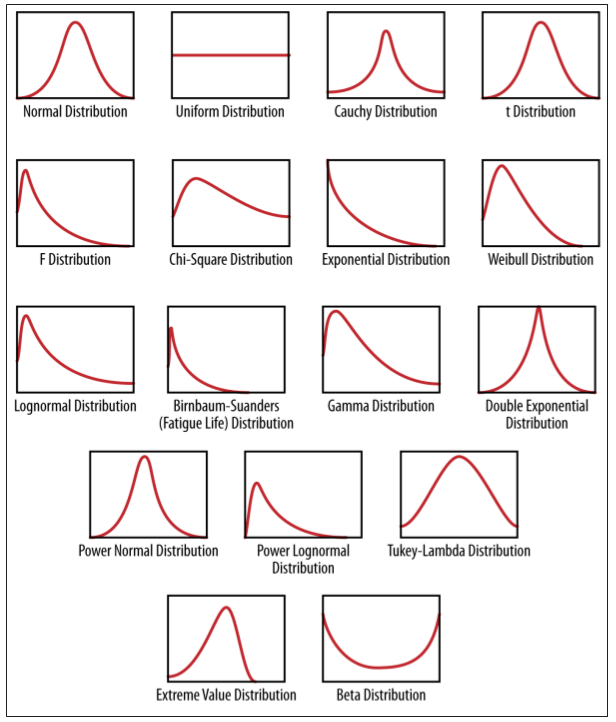
Questions to ask yourself
- Do my data approximate some
known physical process?
- Are most of the data in the
middle of the possible values,
trailing off evenly as values get smaller/bigger?
- Is there some kind of exponential decay process?
- Can my data take on any value?
Can my data be non-negative?
That graphic again

Fitting a distribution to data
- Two (classes of) question(s) to answer
- What family of distribution do my data approximate?
- What parameters describe that distribution?
Maximum likelihood estimation
Asked another way, what are the
parameters that maximize the likelihood
of observing the data I have in front of me?

The product of the probabilities
produced by a PDF with a given
(set of) parameter(s) theta
Prob X1 and X2 and X3 ... and Xn
Maximum likelihood estimation
The set of parameters theta-hat
that maximize the likelihood of
the data are called the
maximum likelihood estimator (MLE)

Requires calculating product
of many small floating point values,
so usually maximize the log likelihood
(or minimize the negative log likelihood)
Common distributions
Uniform
Bernoulli
Gaussian ('normal')
Beta-binomial
Exponential
Weibull
Uniform distribution
Dice rolls.
All outcomes are equally likely.
PMF: f(x) = 1/n
Has only one parameter,
the number of discrete outcomes.
PDF: f(x) = 1/(b - a)
Where all outcomes are on the interval [a, b]
Often used as a 'non-informative prior'
Gaussian ('normal')
Often a good first stop.

Two parameters, mu and sigma.

Bernoulli
Coin flips.
PDF:

Has only one parameter,
p (P(k = 1))
Binomial distribution
Series of independent Bernoulli trials
PMF:

Probability of k successes
Parameters are n (number of trials)
and p (probability of a success)
Used when you have a dichotomous
discrete outcome
Beta distribution
Distribution over probabilities

where B is the Beta function

Two parameters, alpha and beta (we all know and love them)
Note how parameters change shape and allow for increased/decreased uncertainty
around expectation
Exponential
PDF: λ e^(−λx)

Rate parameter lambda
Events that follow a Poisson process
Half-lives and radioactive decay
Weibull

Survival analysis
Demography
Industrial engineering (mechanical failure times)
When k = 1, it's the exponential distribution
Multivariate distributions
Joint probability of two or more outcomes
PDF where Sigma is the covariance matrix


Dimensionality becomes an issue
Can treat as univariate distribution while holding
constant other variables
Other common distributions
Gamma
Multivariate normal
Beta-binomial
Wishart
Fun one:
Cauchy (mean & variance are undefined)
Used in particle physics
Another fun thing to do
Cumulative density function (CDF)
First integral of the PDF
Rather than P(X = x), P(X <= x)
Gaussian CDF:

They all look the same.
Bayesian methods
Treat all parameters as random variables
with associated probability distributions
rather than known quantities.
Distributions allow us to
quantify our uncertainty about
parameter estimates
e.g., in regressions
Copy of Probability distributions
By springcoil


