Making sense of geospatial data with CartoDB maps
Raquel Alegre
Research Software Development Group
University College London
UCL, 14th March 2016
ShipViz
ShipViz
- UCL Energy Institute
- Tools for visualization and analysis of shipping data
- Objective:
- Research on the behaviour of the maritime transport sector
- Response to policy changes
- Identification of transport routes
- Environmental impact (GHG emission)
- ...
- Research on the behaviour of the maritime transport sector
ShipViz - Sample use case
- The International Maritime Organisation introduced in 2012 a regulation for Emission Control Areas

- Identify the number of ships affected by these regulations and their effectiveness by analysing the speed, movement and type of ships sailing through them.
ShipViz + RSDG
-
Develop a visualisation tool for ingestion, manipulation and analysis of geo-temporal data
- Time slider / animation capabilities
- Filtering options (type of vessel, type of fuel, area, ...)
- Interactive and responsive
- Import / Export data (CSV, KML, ...)
- Secure (data provider restrictions)
- Easy for the Shipping Group to mantain and build on top
- Produces nice visualisations to inform their community
- Input SQL queries
- ... All these to be completed in around 30 days of work
- Very large dataset in a PostgreSQL DB
-
Messages sent by ships all around the world containing:
- MMSI, position, time, speed, fuel type, etc.
-
Messages sent by ships all around the world containing:
ShipViz status before work
- Some Python and MATLAB tools for data analysis and visualisation
- Didn't deal with temporal data
- Only worked with a small amount of points of data
- Time consuming: ingest + extract + process + plot
- Required some software development skills
RSDG work on ShipViz
- Research of different GIS tools available that met the requirements
- Best option: CartoDB
RSDG summary of work
- Custom installation and configuration
- Analysis of current status of project
- Improvement on data storage
- Training on usage as well as maintenance and improvements
RSDG work - Database
-
PostgreSQL
- Open Source relational database
- >1 year worth of data, clean and hourly sampled
- 15 million data points, 5000 vessels
- Treats latitudes and longitudes as doubles
- A standard Shipviz query took around 60 minutes to complete
- Considering moving to Neo4j to speed up
RSDG work - Database
-
PostGIS
- Spatial database extension for PostgreSQL
- Adds spatial indexing
- R-trees
- Adds support for spatial data types
- Point, Line, Polygon...
- Adds support for reprojections
- Extends PostgreSQL with geo-queries

- A standard Shipviz query takes around 5 minutes to complete

-
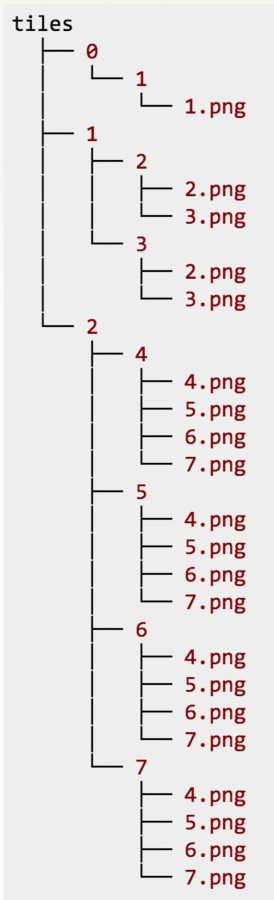
PostGIS - Indexing with R-trees
- Group nearby objects and represent them with their minimum bounding rectangle
RSDG work - GIS tools
- PostGIS + QGIS

- Open Source
- Plugins can be developed in Python to add functionality
- Good performance with large dataset
- But: very limited temporal visualisation
RSDG work - GIS tools
- PostGIS + GeoServer/Mapserver + OpenLayers/Leaflet
- Traditional solution, but:

- Tricky to make it performant with so much data
- ... All the Javascript
- Not enough time to develop all requirements
RSDG work - GIS tools
-
ESRI GIS / ArcGIS
-
Non-Open Source
- Next!
-
Non-Open Source
RSDG work - GIS tools
- PostGIS + MapBox + TileMill
- Good performance with large amounts of data
- Out of the box solution
- Ticks some requirements with no extra work

- However:
- Unstable release at the time
- Focus on tiling design, not so much interaction with data
- No temporal data animation at the time
RSDG work - GIS tools
- PostGIS + GeoServer + WebGL
RSDG work - GIS tools
-
CartoDB
- Out of the box solution that ticked most requirements
- However:
- Data security requirements not met since data would be save in the cloud
- Standard online version only allows up to 250MB of data for free
- Luckily:
- Since it's Open Source, you can install the full stack of CartoDB locally as well!
RSDG work - CartoDB

- DB + Server + Client traditional GIS application architecture
- Can be used:
- Online with limitations
- Local full stack - (almost) no limitations
- Can be used as a unit or in bits:
- CartoDB python/R/Java libraries to connect with CartoDB PostGIS
- D3/Plotly/ChartJS can visualise CartoDB data
RSDG work - CartoDB

RSDG work - CartoDB
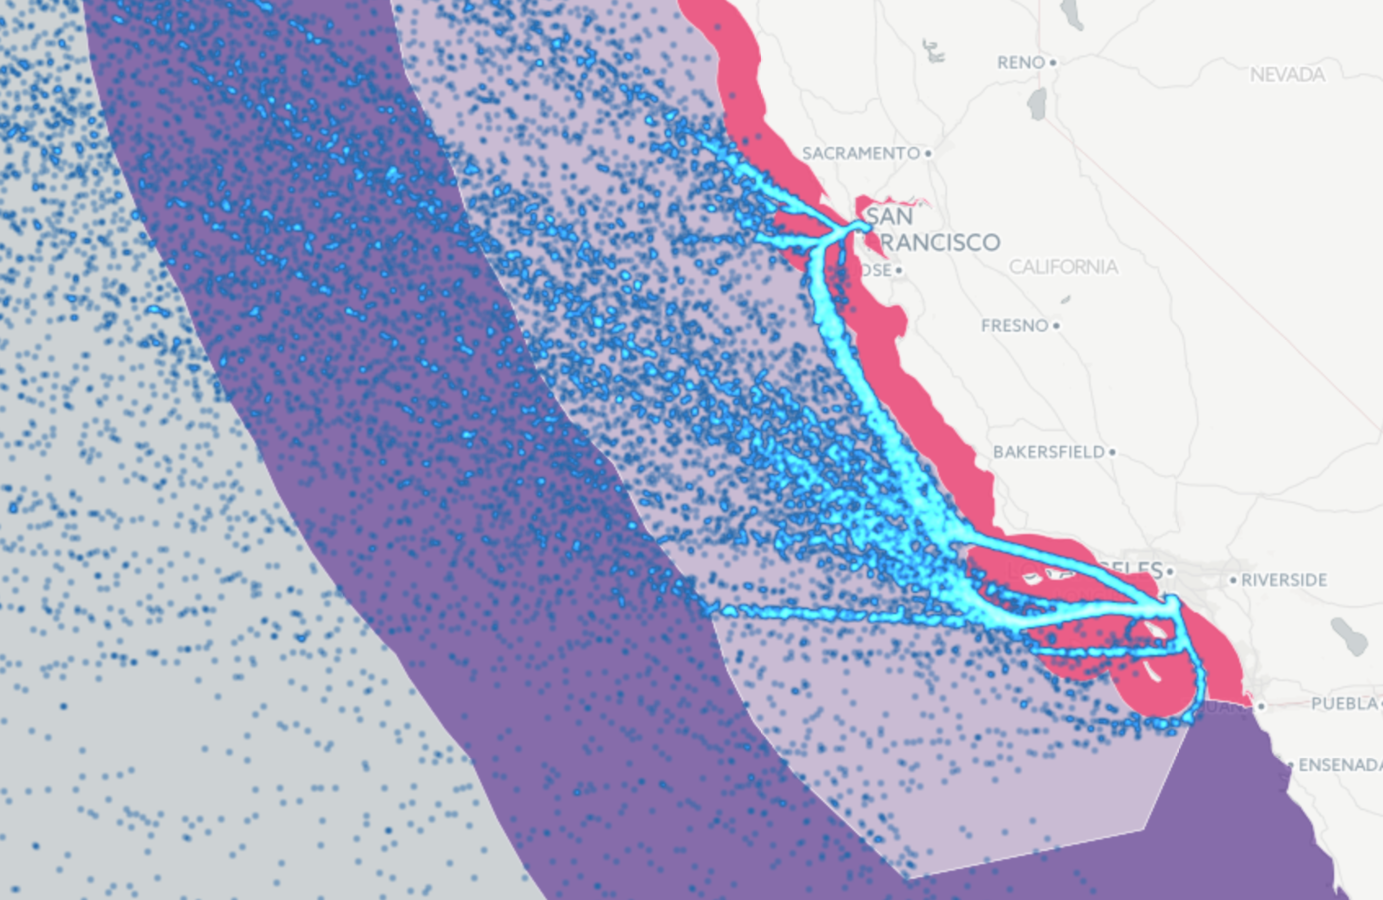
20% data points in CartoDB

RSDG work - CartoDB

400K points: ~3% of the data points in CartoDB
Demo!
Were Emission Control Areas effective?


Future of ShipViz
- The CartoDB stack is currently up and running at a server installed at the Energy Institute
- It is being used by several ShipViz team members for their research and other use cases
- Paper under preparation about the work with CartoDB and the ECAs findings
CartoDB and Python
pip install cartodbfrom cartodb import CartoDBAPIKey
API_KEY ='YOUR_CARTODB_API_KEY'
cartodb_domain = 'YOUR_CARTODB_DOMAIN'
cl = CartoDBAPIKey(API_KEY, cartodb_domain)- Connect to CartoDB using your API keys or OAuth
- Install:
CartoDB-Python
- Python Client for CartoDB SQL API and Import API
from cartodb import FileImport

fi = FileImport("test.csv", cl)
fi.run()
from cartodb import URLImport
fi = URLImport("http://acdmy.org/d/counties.zip", cl)
fi.run()CartoDB-Python
- Import local or remote datasets:
- Send SQL query
from cartodb import CartoDBAPIKey, CartoDBException

API_KEY ='YOUR_CARTODB_API_KEY'
cartodb_domain = 'YOUR_CARTODB_DOMAIN'
cl = CartoDBAPIKey(API_KEY, cartodb_domain)
try:
   print(cl.sql('select * from mytable'))
except CartoDBException as e:
   print("some error ocurred", e)
CartoDB and Javascript
CartoDB
Cool maps