Making sense of geospatial data with CartoDB maps
Raquel Alegre
Research Software Development Group
University College London
UCL, 14th March 2016
ShipViz
ShipViz
- UCL Energy Institute
- Tools for visualization and analysis of shipping data
- Objective:
- Research on the behaviour of the maritime transport sector
- Response to policy changes
- Identification of transport routes
- Environmental impact (GHG emission)
- ...
- Research on the behaviour of the maritime transport sector
ShipViz - Sample use case
- The International Maritime Organisation introduced in 2012 a regulation for Emission Control Areas

- Identify the number of ships affected by these regulations and their effectiveness by analysing the speed, movement and type of ships sailing through them.
ShipViz + RSDG
-
Develop a visualisation tool for ingestion, manipulation and analysis of geo-temporal data
- Time slider / animation capabilities
- Filtering options (type of vessel, type of fuel, area, ...)
- Interactive and responsive
- Import / Export data (CSV, KML, ...)
- Secure (data provider restrictions)
- Easy for the Shipping Group to mantain and build on top
- Produces nice visualisations to inform their community
- Input SQL queries
- ... All these to be completed in around 30 days of work
- Very large dataset in a PostgreSQL DB
-
Messages sent by ships all around the world containing:
- MMSI, position, time, speed, fuel type, etc.
-
Messages sent by ships all around the world containing:
ShipViz status before work
- Some Python and MATLAB tools for data analysis and visualisation
- Didn't deal with temporal data
- Only worked with a small amount of points of data
- Time consuming: ingest + extract + process + plot
- Required some software development skills
RSDG work on ShipViz
- Research of different GIS tools available that met the requirements
- Best option: CartoDB
RSDG summary of work
- Custom installation and configuration
- Analysis of current status of project
- Improvement on data storage
- Training on usage as well as maintenance and improvements
RSDG work - Database
-
PostgreSQL
- Open Source relational database
- >1 year worth of data, clean and hourly sampled
- 15 million data points, 5000 vessels
- Treats latitudes and longitudes as doubles
- A standard Shipviz query took around 60 minutes to complete
- Considering moving to Neo4j to speed up
RSDG work - Database
-
PostGIS
- Spatial database extension for PostgreSQL
- Adds spatial indexing
- R-trees
- Adds support for spatial data types
- Point, Line, Polygon...
- Adds support for reprojections
- Extends PostgreSQL with geo-queries

- A standard Shipviz query takes around 5 minutes to complete

-
PostGIS - Indexing with R-trees
- Group nearby objects and represent them with their minimum bounding rectangle
RSDG work - GIS tools
- PostGIS + QGIS

- Open Source
- Plugins can be developed in Python to add functionality
- Good performance with large dataset
- But: very limited temporal visualisation
RSDG work - GIS tools
- PostGIS + GeoServer/Mapserver + OpenLayers/Leaflet
- Traditional solution, but:

- Tricky to make it performant with so much data
- ... All the Javascript
- Not enough time to develop all requirements
RSDG work - GIS tools
-
ESRI GIS / ArcGIS
-
Non-Open Source
- Next!
-
Non-Open Source
RSDG work - GIS tools
- PostGIS + MapBox + TileMill
- Good performance with large amounts of data
- Out of the box solution
- Ticks some requirements with no extra work

- However:
- Unstable release at the time
- Focus on tiling design, not so much interaction with data
- No temporal data animation at the time
RSDG work - GIS tools
- PostGIS + GeoServer + WebGL
RSDG work - GIS tools
-
CartoDB
- Out of the box solution that ticked most requirements
- However:
- Data security requirements not met since data would be save in the cloud
- Standard online version only allows up to 250MB of data for free
- Luckily:
- Since it's Open Source, you can install the full stack of CartoDB locally as well!
RSDG work - CartoDB

- DB + Server + Client traditional GIS application architecture
- Can be used:
- Online with limitations
- Local full stack - (almost) no limitations
- Can be used as a unit or in bits:
- CartoDB python/R/Java libraries to connect with CartoDB PostGIS
- D3/Plotly/ChartJS can visualise CartoDB data
RSDG work - CartoDB

RSDG work - CartoDB
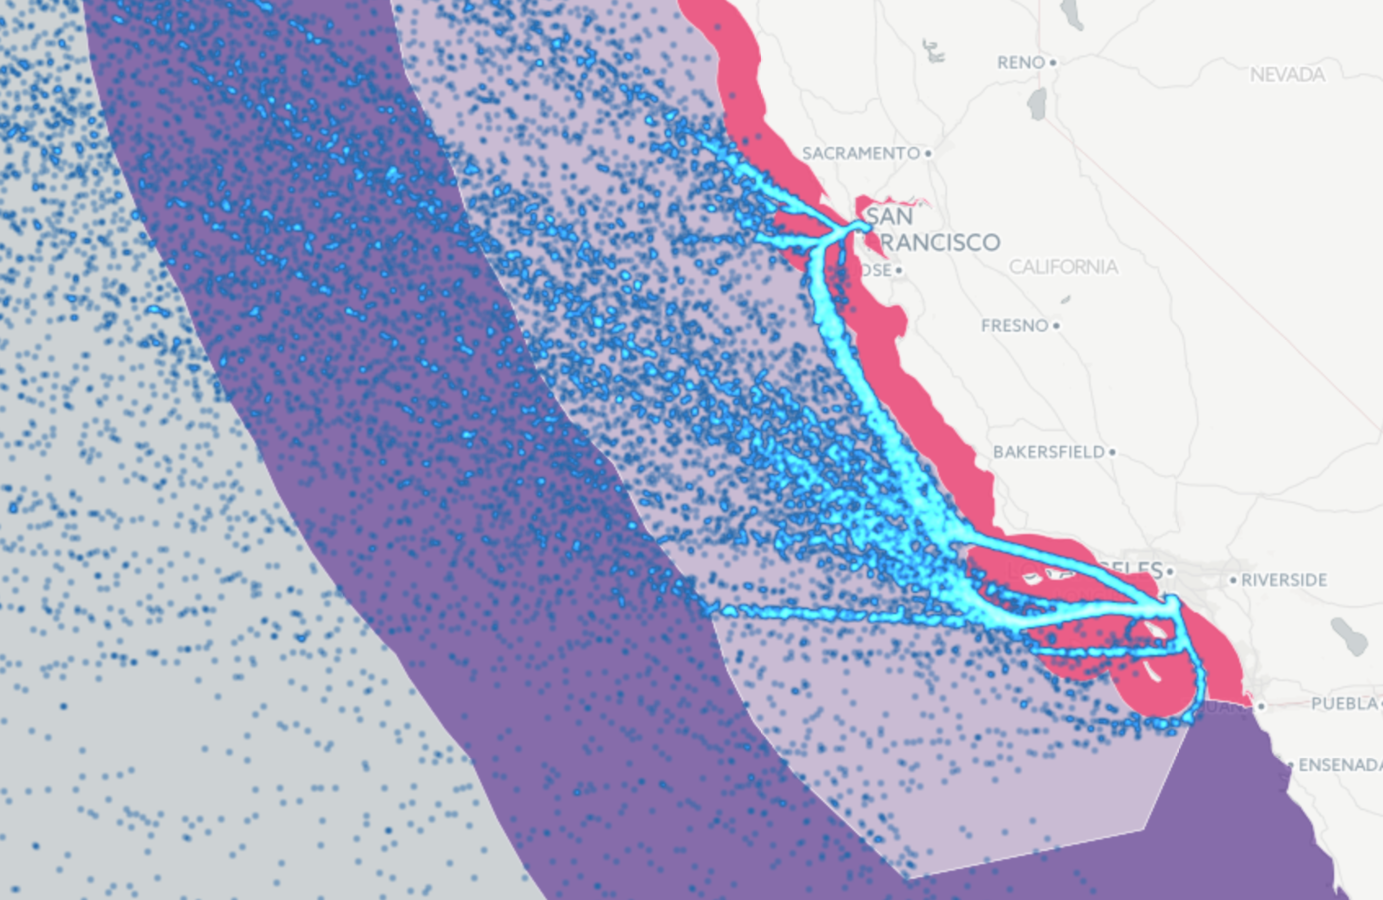
20% data points in CartoDB

RSDG work - CartoDB

400K points: ~3% of the data points in CartoDB
Demo!
Were Emission Control Areas effective?


Future of ShipViz
- The CartoDB stack is currently up and running at a server installed at the Energy Institute
- It is being used by several ShipViz team members for their research and other use cases
- Paper under preparation about the work with CartoDB and the ECAs findings
CartoDB and Python
pip install cartodbfrom cartodb import CartoDBAPIKey
API_KEY ='YOUR_CARTODB_API_KEY'
cartodb_domain = 'YOUR_CARTODB_DOMAIN'
cl = CartoDBAPIKey(API_KEY, cartodb_domain)- Connect to CartoDB using your API keys or OAuth
- Install:
CartoDB-Python
- Python Client for CartoDB SQL API and Import API
from cartodb import FileImport

fi = FileImport("test.csv", cl)
fi.run()
from cartodb import URLImport
fi = URLImport("http://acdmy.org/d/counties.zip", cl)
fi.run()CartoDB-Python
- Import local or remote datasets:
- Send SQL query
from cartodb import CartoDBAPIKey, CartoDBException
API_KEY ='YOUR_CARTODB_API_KEY'
cartodb_domain = 'YOUR_CARTODB_DOMAIN'
cl = CartoDBAPIKey(API_KEY, cartodb_domain)
try:
print(cl.sql('select * from mytable'))
except CartoDBException as e:
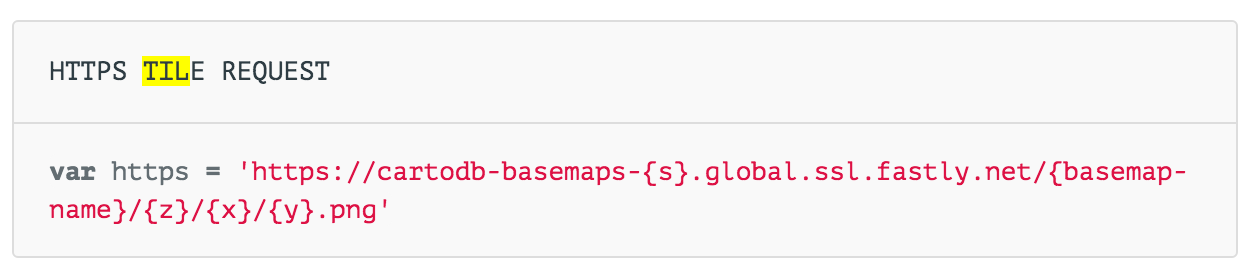
print("some error ocurred", e)CartoDB and Javascript
CartoDB
Cool maps
The End
ShipViz and RSDG
By Raquel Alegre
ShipViz and RSDG
Presentation about work done on ShipViz (Energy Institute) by Raquel Alegre for one of the events at the series of UCL's Technical Socials - March 2016


