Wikimedia Analytics
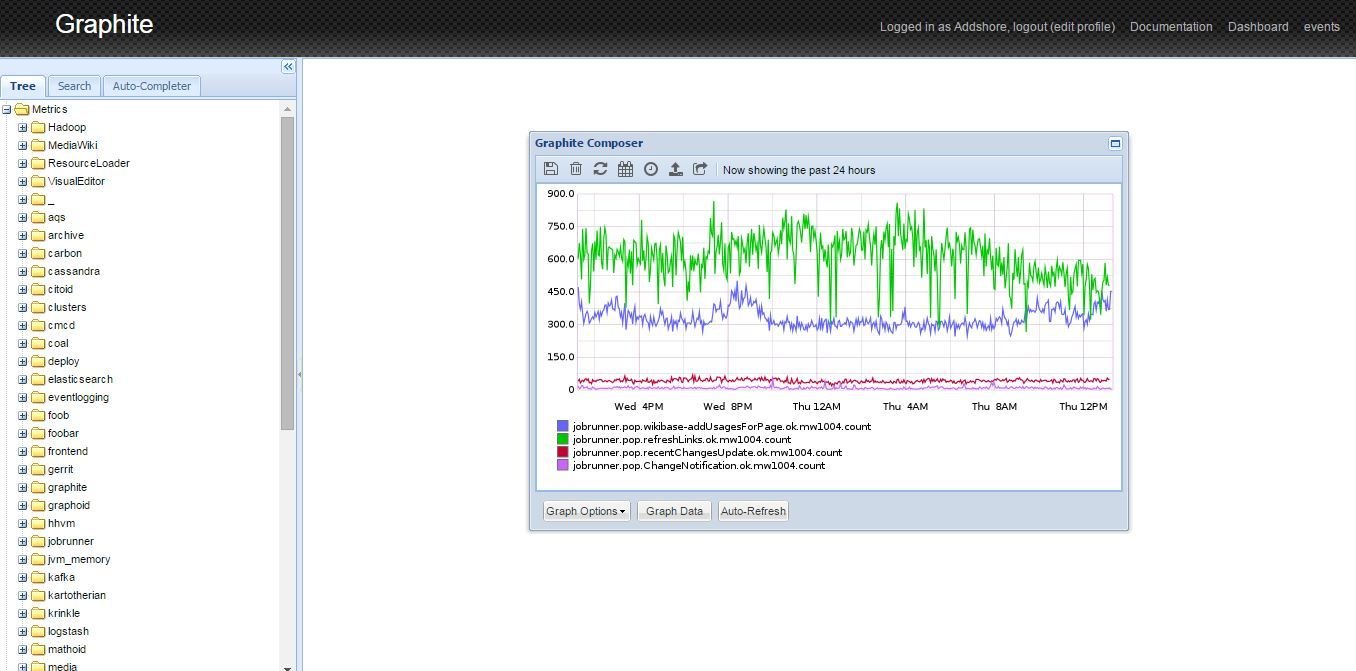
Graphite

access with NDA
Graphite
- PHP Profiling
- Server / Machine stats
- JobQueue / JobRunner
- ResourceLoader
- Gerrit
- EventLogging
- etc...
- Simple metrics... Just numbers
- Added to using statsd
- Normally retained for 1 year
- Resolution decreases with time
- 1m:7d,5m:14d,15m:30d,1h:1y
echo "metricname:10|c" | nc -w 1 -u statsd.eqiad.wmnet 8125$statsd = RequestContext::getMain()->getStats();
$service->timing('usageTime', 100);
$service->increment('visitor');
$service->decrement('click');
$service->gauge('gaugor', 333);
$service->set('uniques', 765);Graphite
- metrics agregator
- It flushes data to graphite every 60 seconds
- statsd adds .lower .upper .p95 etc. to the data
statsd
Supports
- Counting
- Sampling
- Timing
- Gauges
- Sets
See: github.com/etsy/statsd/blob/master/docs/metric_types.md
Graphite
Render api graphite.wikimedia.org/render
api
-
target - match 1 or more metrics
- jobrunner.pop.wikibase-addUsagesForPage.ok.*.count
-
from/until - specify a time scale (relative or absolute)
- from=-8d until=-7d
-
format - specify a format!
- raw / csv / json
Other graphy stuff too.... (width etc)
Hadoop, Hive & Kafka
- Kafka gets sent all of the logs (Distributed logging buffer)
-
Hadoop processes and stores much data (all of the logs).
- Also has a scratch space!
- Stores data for roughly 1 month
- Hive lets you query all of the things!
access from stat1002
What is stored?
- Webrequests (raw & refined)
- Pageviews
- Projectviews
- pagecounts_all_sites
- mediacounts

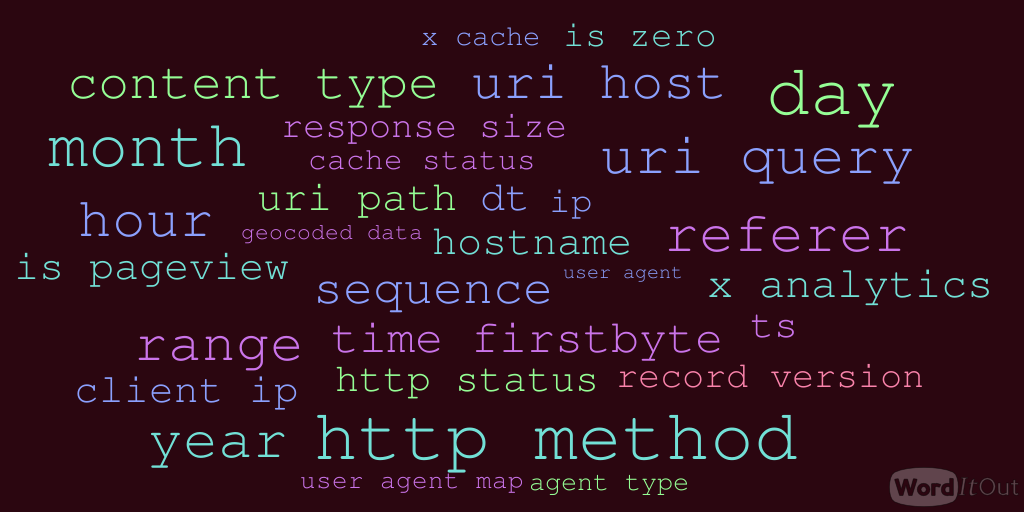
Web request fields
Sample query
SELECT
  count(*) as count, user_agent
FROM
  webrequest
WHERE
  year = 2015
  AND month = 10
  AND day = 12
  AND hour = 1
  AND uri_host = "www.wikidata.org"
  AND http_status = 200
  AND http_method = "GET"
  AND uri_path LIKE "/wiki/Special:EntityData%"
GROUP BY user_agent
ORDER BY count
LIMIT 999999;
See how many times each user agent accesses Special:EntityData and subpages in a given hour
More data!
Structured api logging soon
API Logs
Generated by mediawiki (rather than from request logs)
2014-08-19 10:12:33 mw1198 wikidatawiki api
INFO:
API GET 2.1.0.0 2.1.0.0 T=52ms
action=opensearch
format=json
search=some%20search%20string
limit=50
namespace=0
suggest=true
Long json strings are truncated with [...]
30 days of archives are kept on the analytics cluster
/a/mw-log/archive/api.log-$dateStamp.gz
access from fluorine or stat1002
Slave dbs
- All of the things
- Scratch space
analytics-store from stat1002
Graphing & Dashing
| Name | State | Data From |
|---|---|---|
| Limn | Dieing | TSV files |
| Grafana | Alive | Graphite |
| Dashiki | Alive | Who knows? |
| Shiny | Own | All of the places? |
| The other one.... | Alive | Graphite |
| Graphite | Alive | Graphite |