Chromatin openness
and motifs search
Aleksandra Galitsyna
“Analysis of omics data” course
Skoltech Term 4
23 April 2020

This presentation can be found at https://slides.com/agalicina/epigenetics-practice2-2020
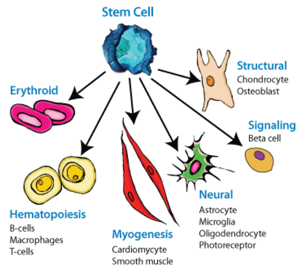
In a previous lesson
- Epigenetics as the source of variability
between cell phenotypes
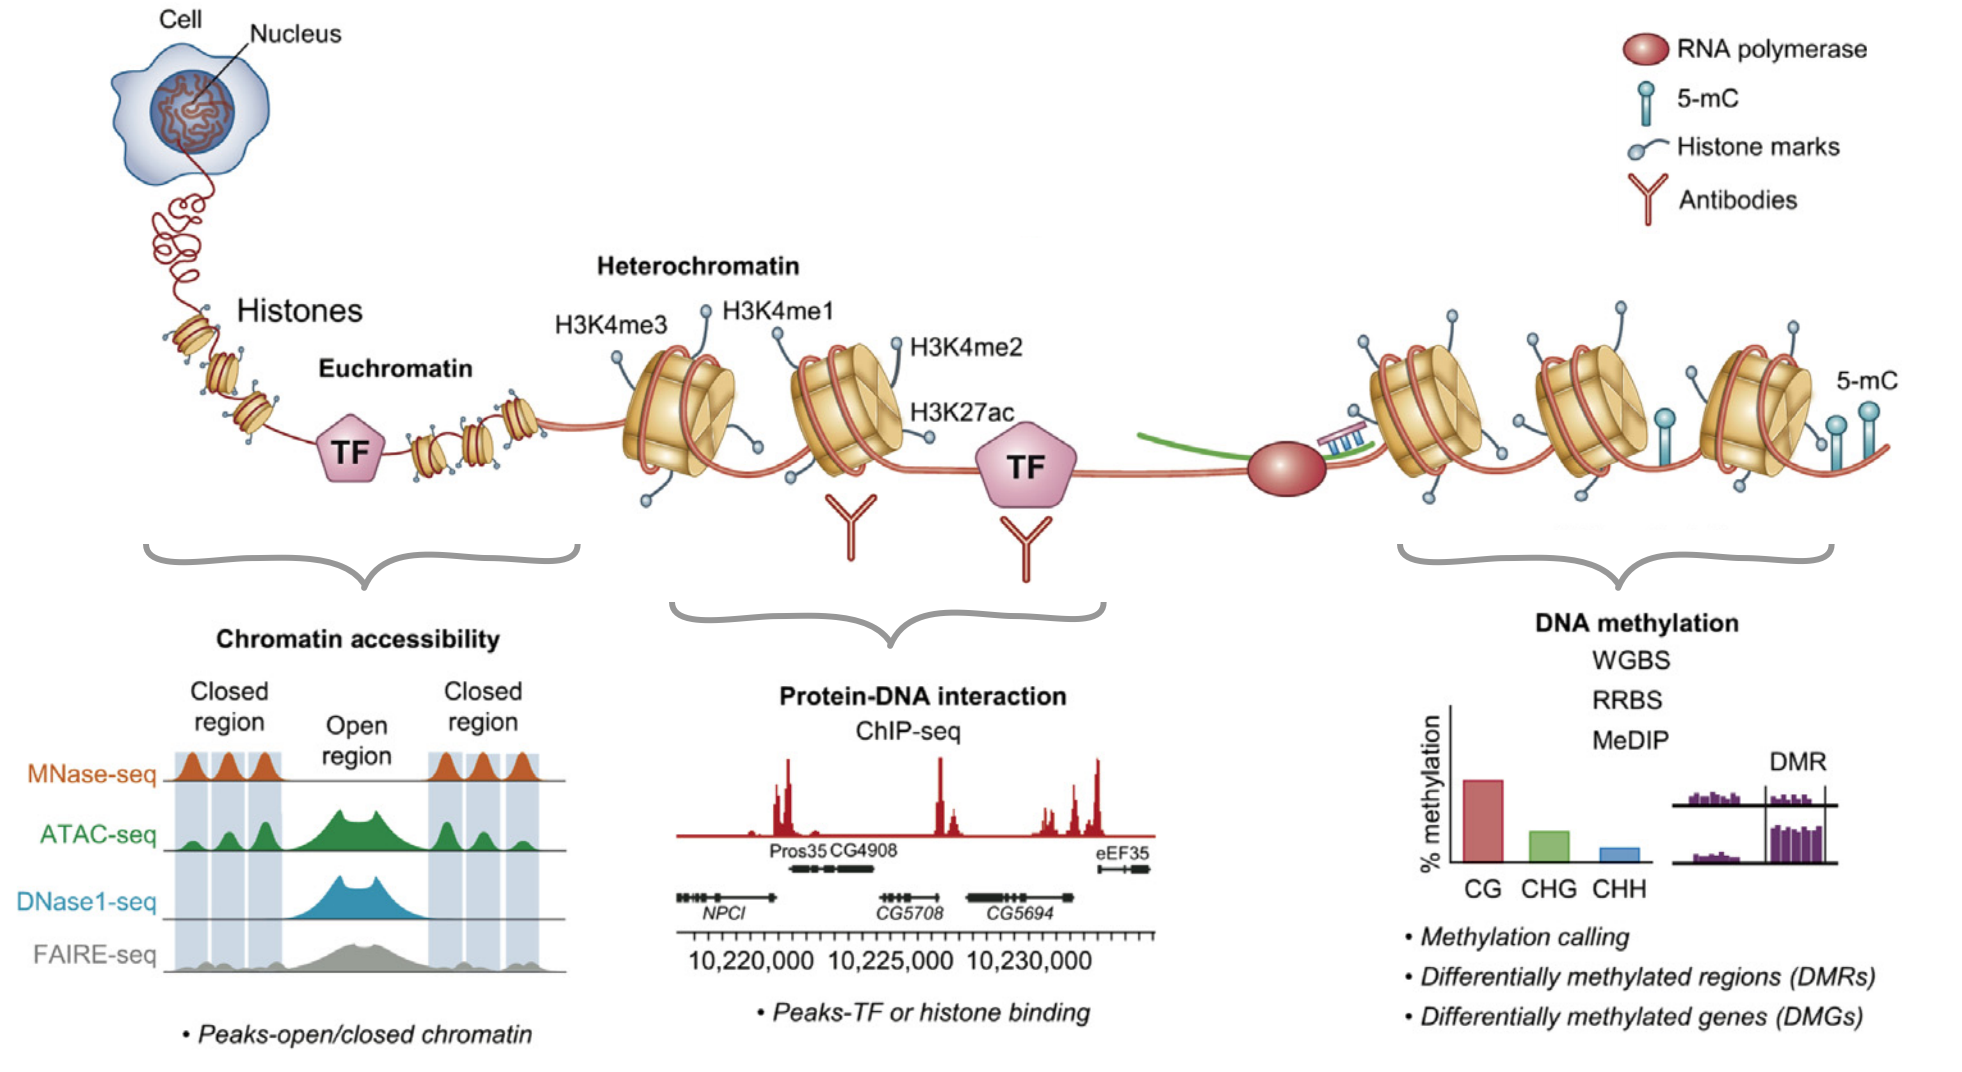
- Diversity of NGS techniques to assay
epigenetic information:
- Processing the data for one the simplest epigenetics NGS methods: DNase-Seq
Types of binding events in the cell
Proteins and nucleic acids are the most important components of the cell. Their interactions are necessary for functioning and regulation. Types of interactions:
-
DNA-protein interactions, examples:
- replication/reparation/recombination
- transcription
- chromatin modification and folding
-
RNA-protein:
- RNA metabolism regulation
- processing
- translation
- degradation: microRNA, NMD
-
RNA-DNA interactions:
- expression regulation
- chromatin structure maintenance
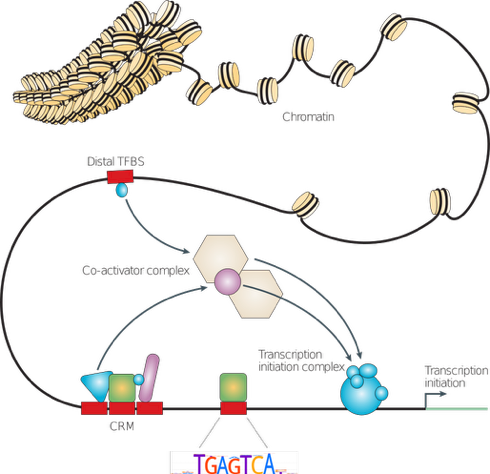
Wasserman & Sandelin, 2004
Types of molecular interactions
-
Direct:
- protein-protein
- RNA-protein
- DNA-protein
- RNA-DNA (R-loops)
-
Indirect:
- Protein-mediated
- RNA-mediated
-
Colocalization:
- Compartments
- Hubs
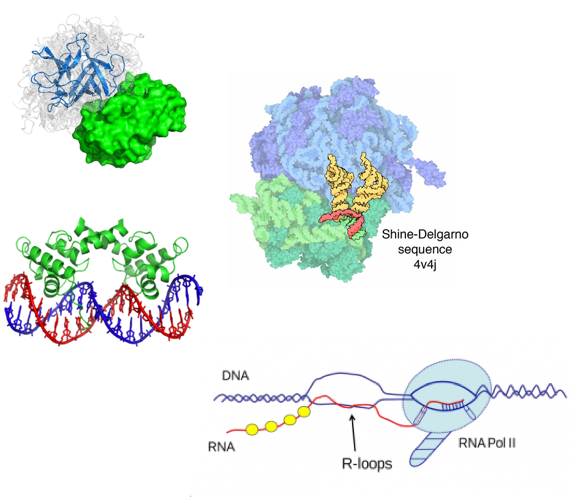
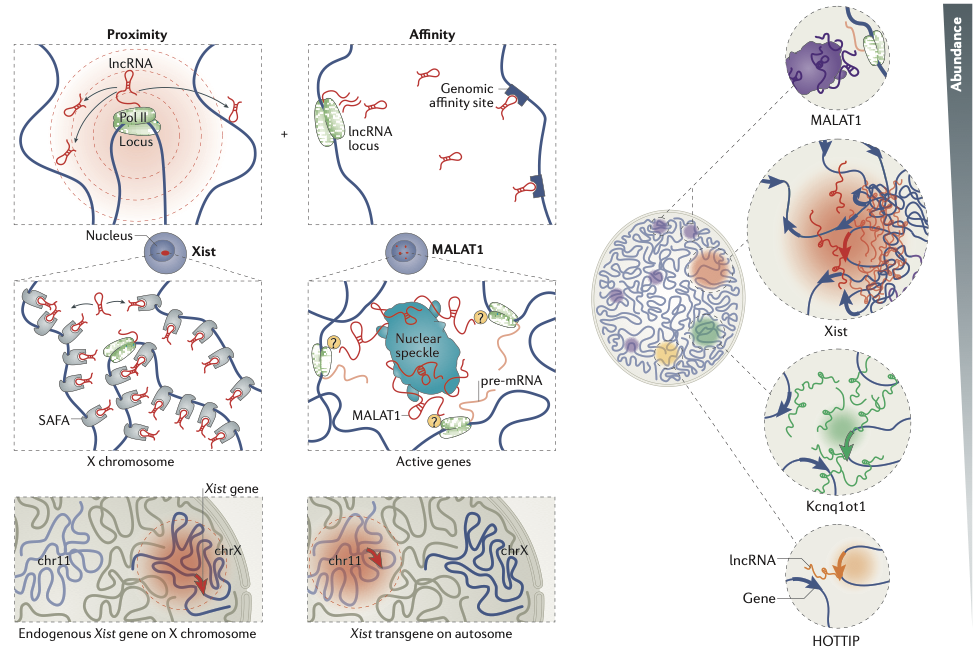
RNA-DNA interactions
Engreitz et al. 2016
ChIP-Seq
Binding of protein is typically specific to DNA sequence:
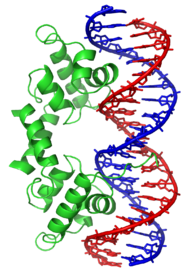
Binding pattern
DNA-protein binding
List of DNAs
with binding events
courtesy of Ivan Kulakovsky, Pavel Mazin
ChIP-Seq
Chromatin-immunoprecipitation followed by sequencing:
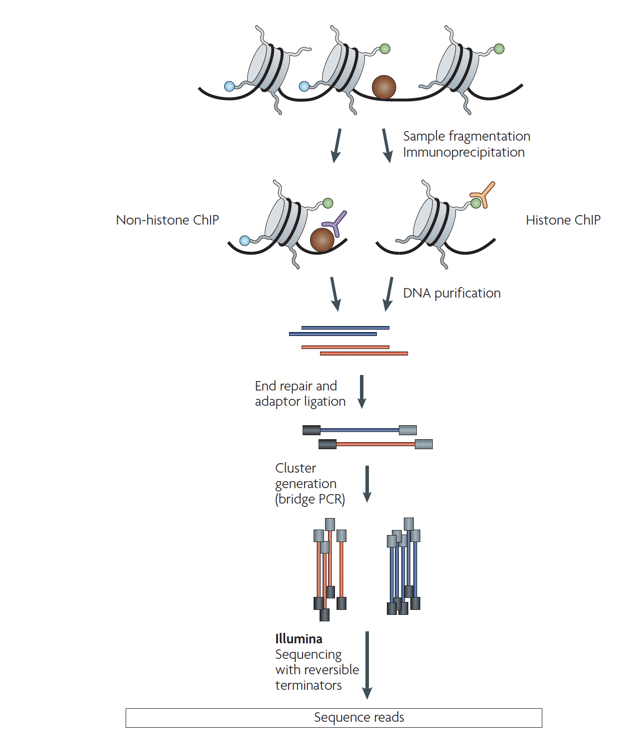
ChIP-Seq: input experiment
Unwanted factors contributing to sequencing & processing output:
- DNA accessibility
- DNA amplification efficiency
- Mappability
"Input" experiment is a ChIP-Seq control without precipitation step. It is used for normalisation of ChIP-Seq.
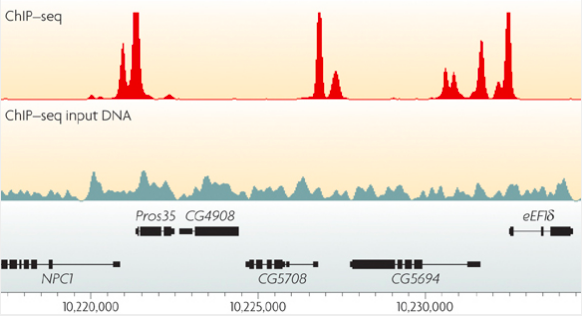
Park, Nat Reviews Genetics, 2009
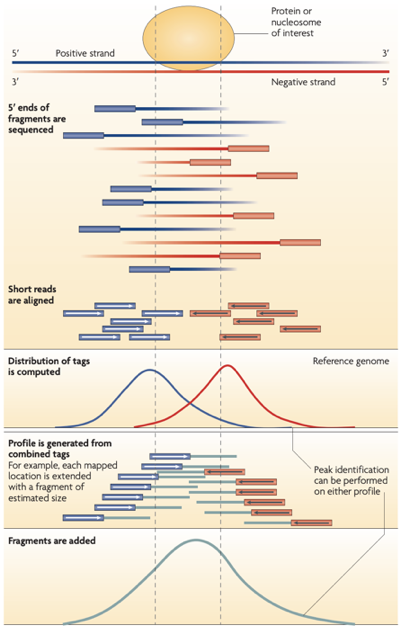
ChIP-Seq: peak calling
In order to predict binging events we need to call peaks in ChIP-Seq data:
Mahony & Pugh 2015
ChIP-Seq: peak calling
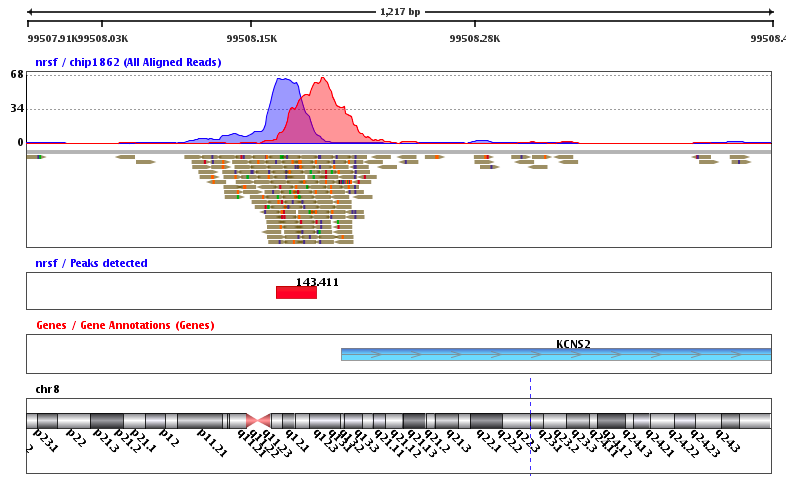
Example output of the procedure:
What is the next step?
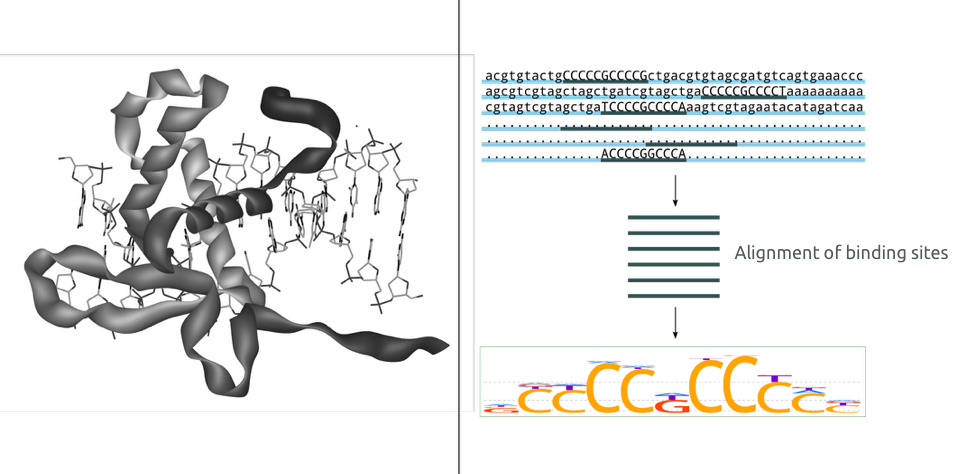
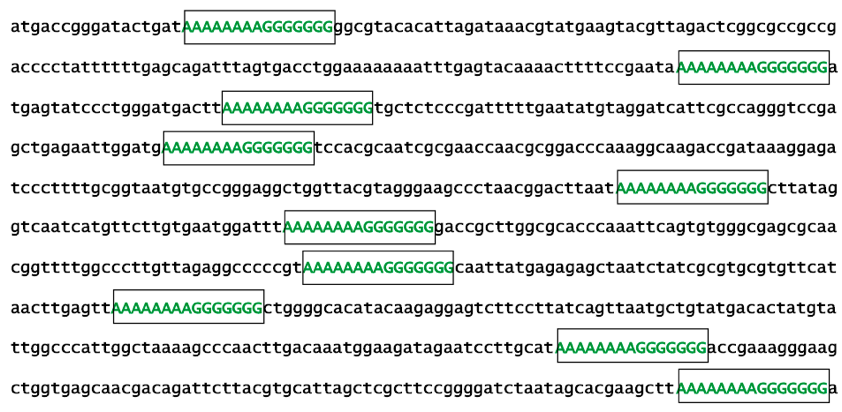
ChIP-Seq: binding pattern
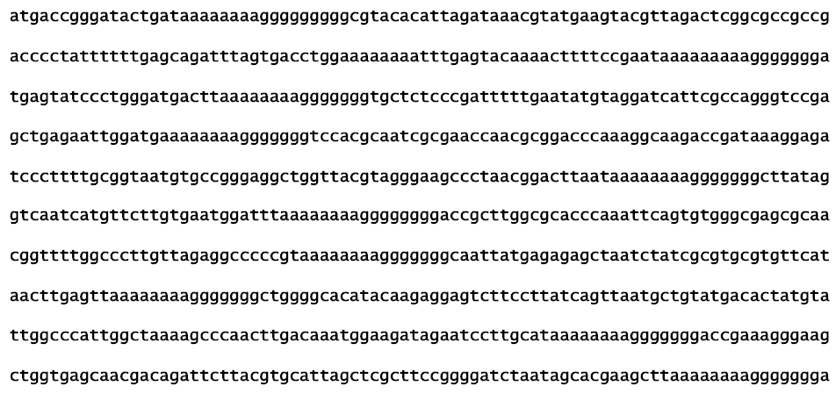
- As an output from ChIP-Seq we have a list of peaks.
- In theory, each peak should have a binding event.
- Imagine you have the peaks with the following sequences:
- What is the binding pattern?
courtesy of Ivan Kulakovsky, Pavel Mazin
ChIP-Seq: binding pattern
- Seems to be easy to find the binding pettern:
Question: Can you propose a computational approach to find it?
courtesy of Ivan Kulakovsky, Pavel Mazin
ChIP-Seq: motifs search
-
Let's introduce some variety, which can arise as:
- Suboptimal binding of the protein
- Genome variability
- Errors during the sequencing
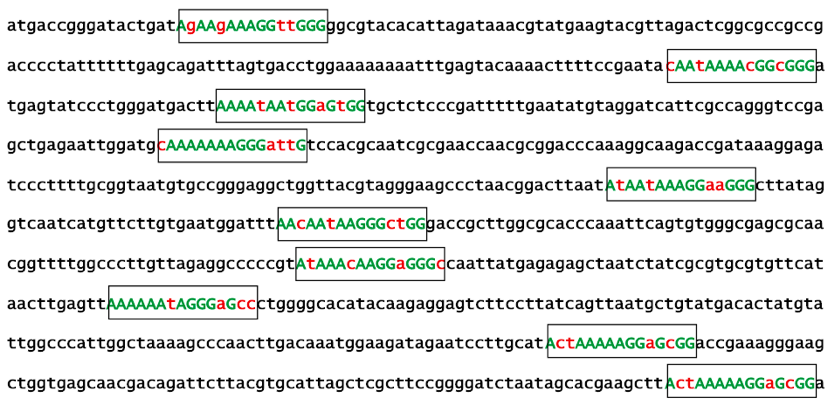
courtesy of Ivan Kulakovsky, Pavel Mazin
ChIP-Seq: motifs search
- With possible substitutions, finding the correct pattern is not easy anymore:
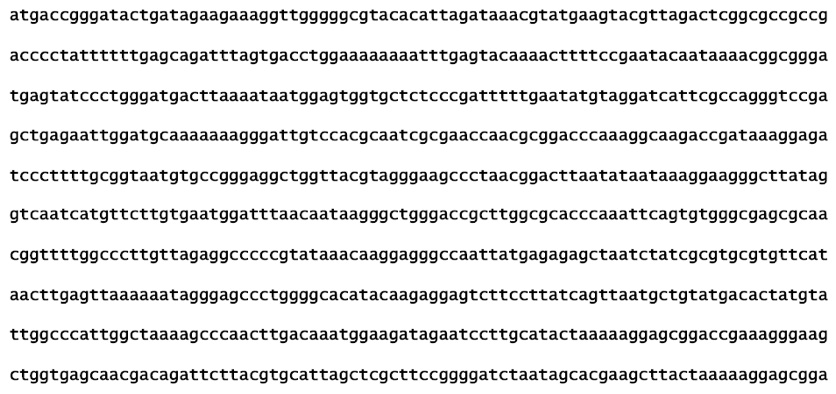
We need some advanced algorithms to find binding patterns.
courtesy of Ivan Kulakovsky, Pavel Mazin
Binding pattern representation
- Binding motif is a DNA sequence pattern that has biological significance (e.g. it is a target for protein binding).
- Consider following pattern of sequences:
TATAAT
TAAAAT
TAATAT
TGTAAT
TATACT
Consensus is the sequence of the most frequent letters:
T[AG][AT][AT][AC]T
With the consensus sequence, we lose the information:
- about suboptimal binding,
- of background nucleotides frequencies.
courtesy of Pavel Mazin
Binding motif representation
Other representations:
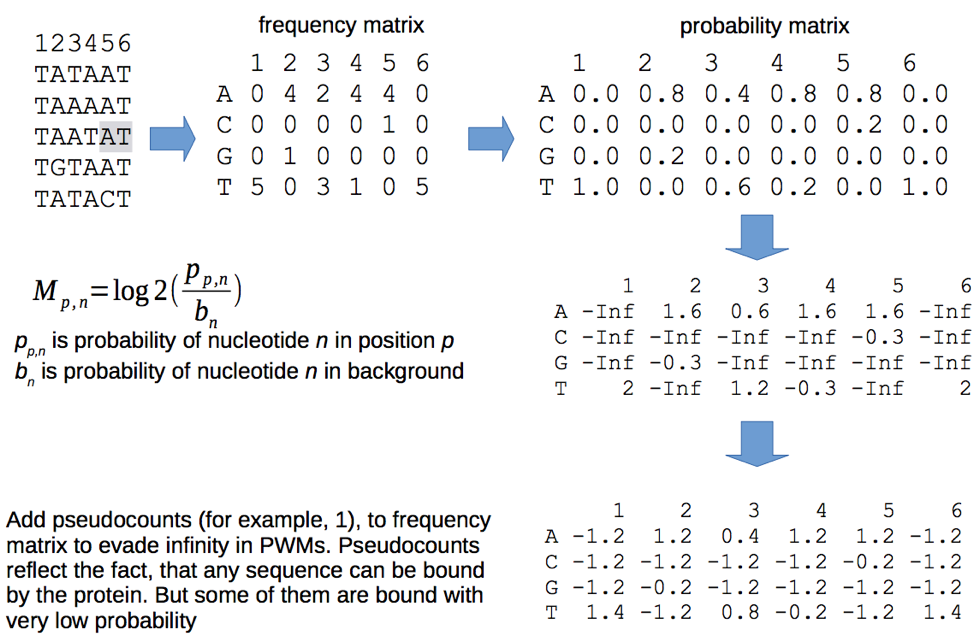
Frequency matrix
Probability matrix
Matrix normalized by background
Position Weight Matrix (PWM)
courtesy of Pavel Mazin
Position Weight Matrix (PWM)
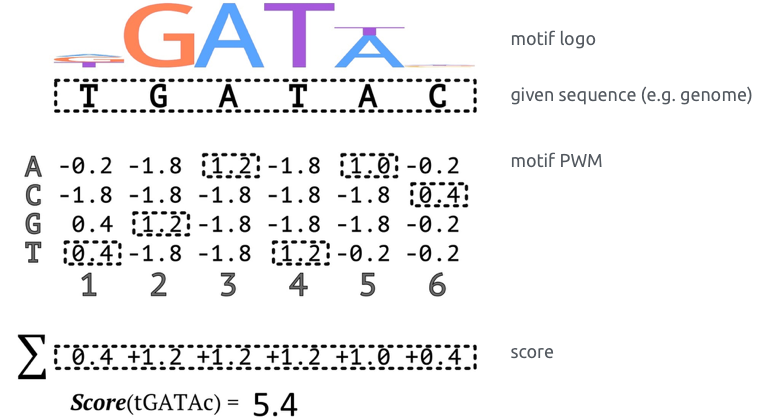
courtesy of Pavel Mazin
Binding motifs search
Approaches:
- Scanning of the motifs from the database
(e.g. JASPAR http://jaspar.genereg.net/ )
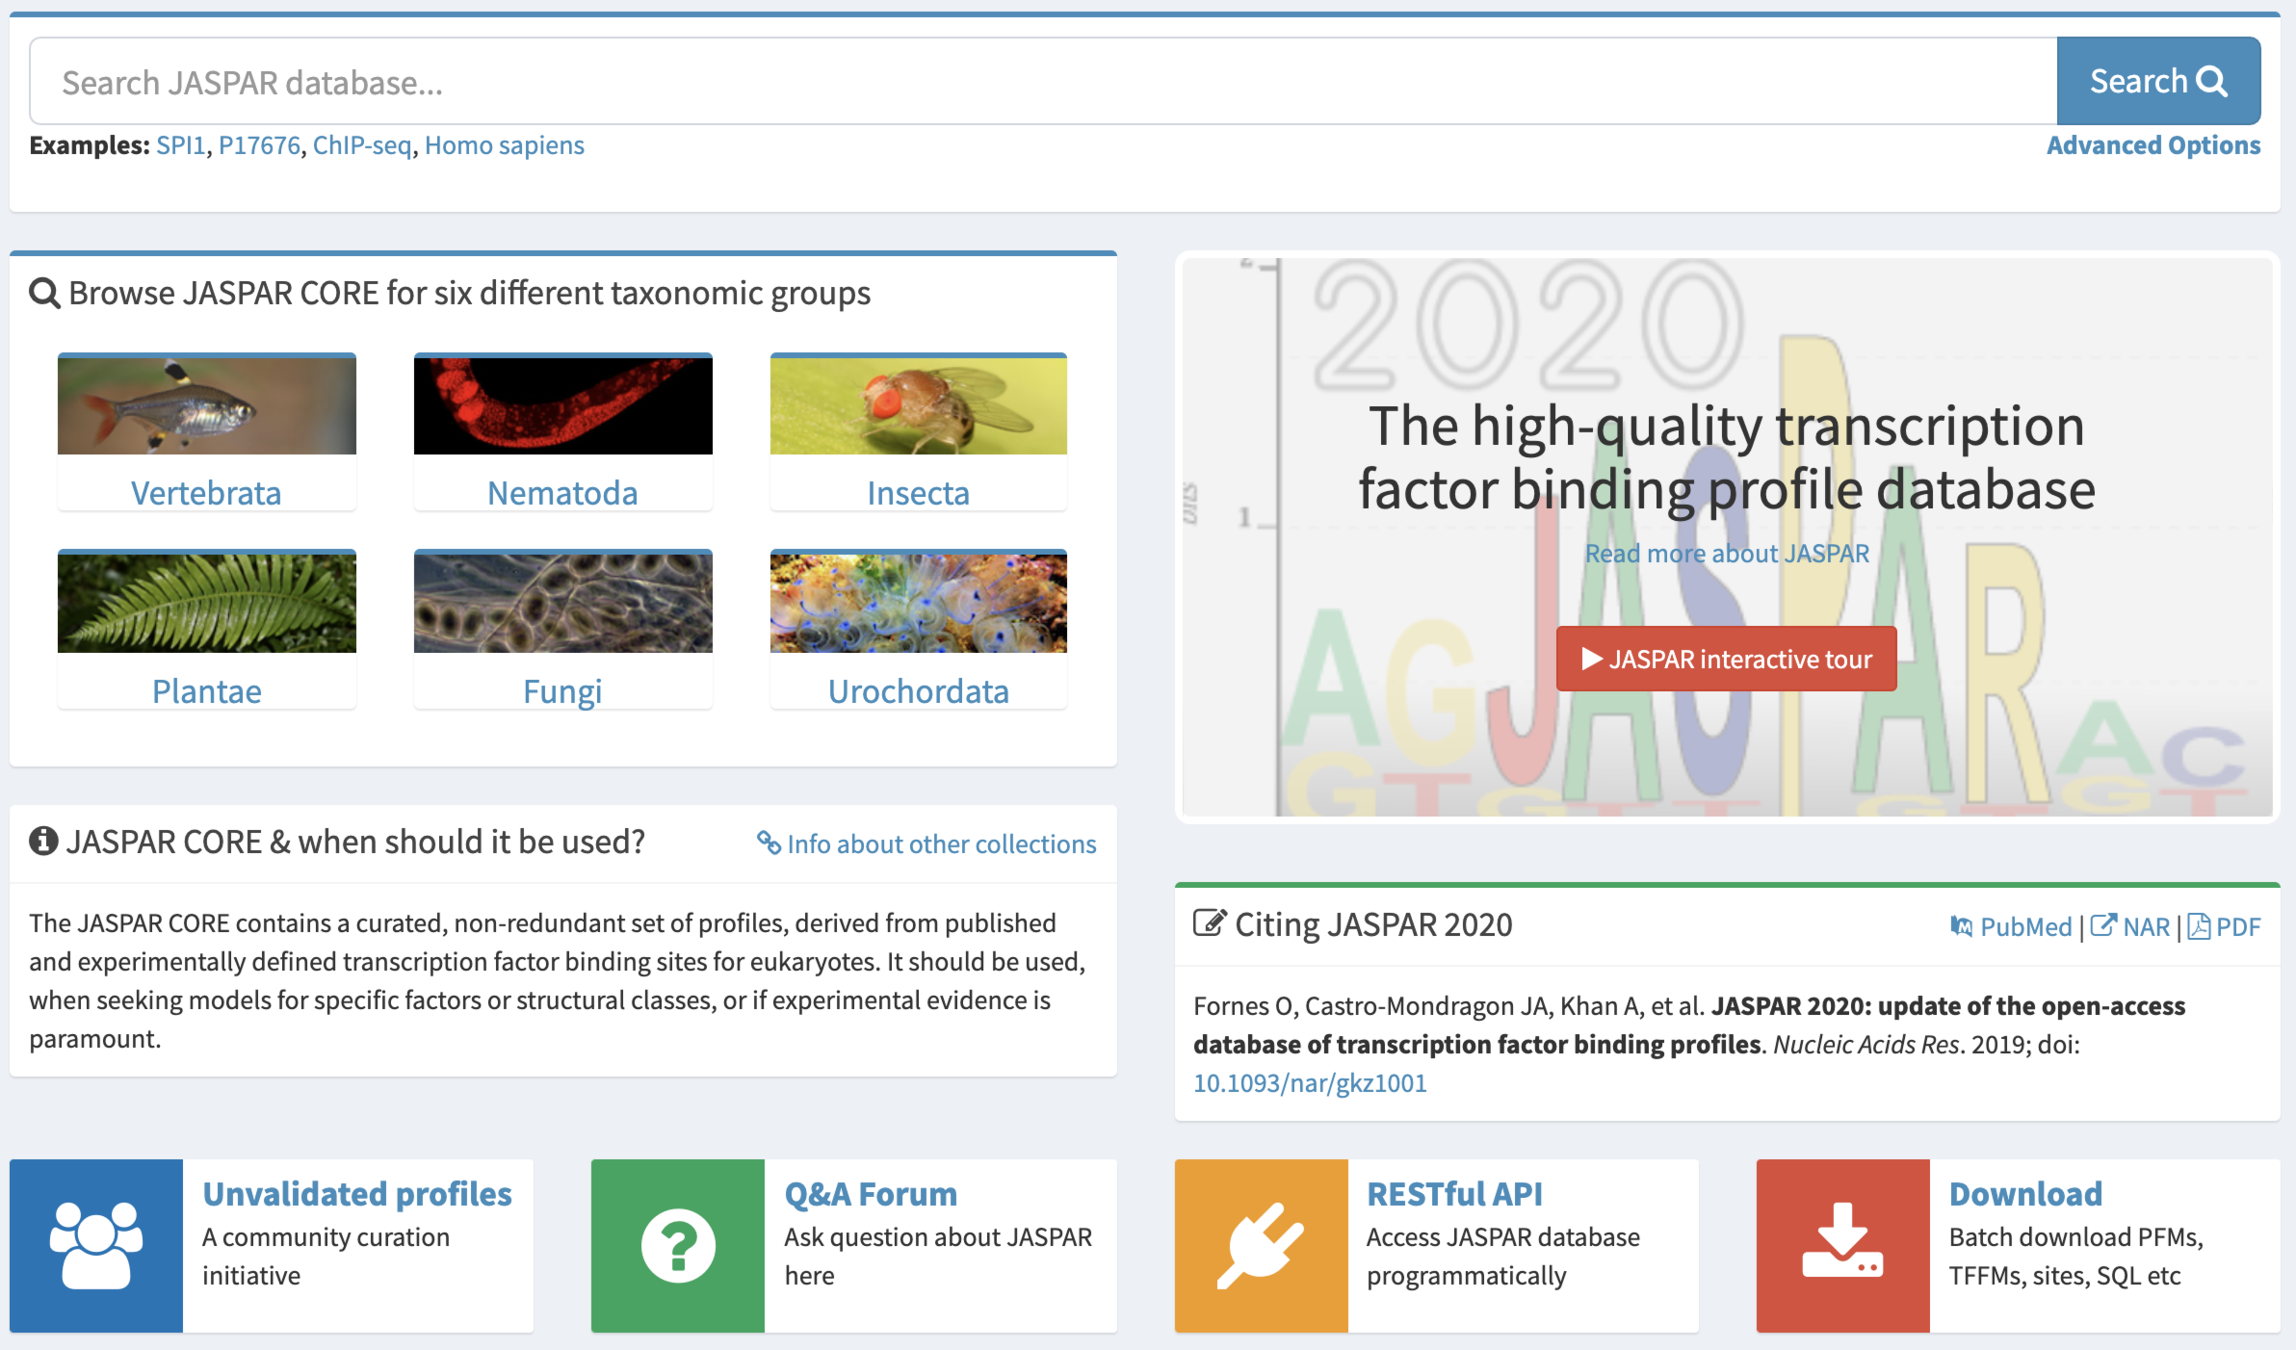
Binding motifs search
Approaches:
- Scanning of the motifs from the database
(e.g. JASPAR http://jaspar.genereg.net/ ) - Motifs discovery (de novo search)
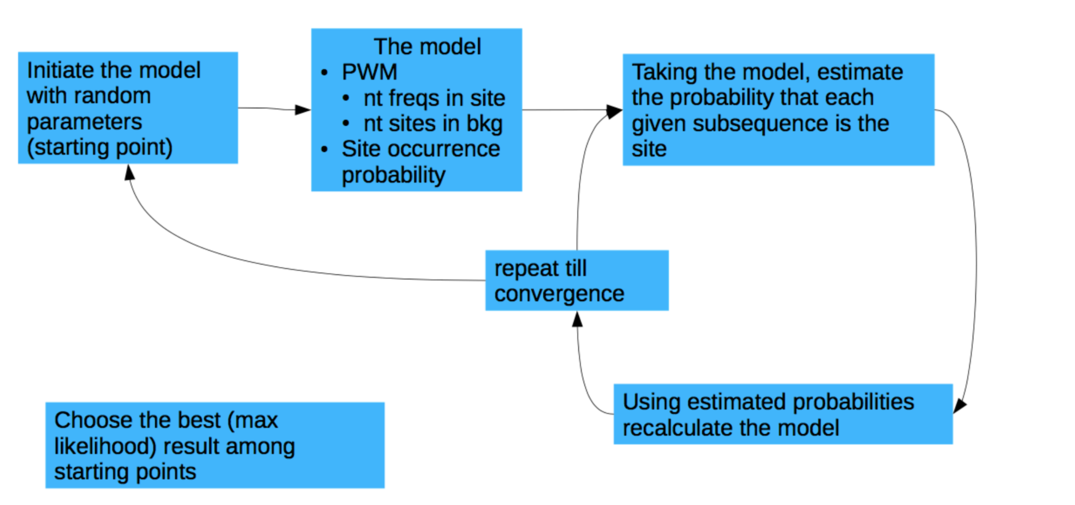
courtesy of Pavel Mazin
ChIP-Seq: motifs search tools
- Web server tools:
-
Command line interface tools (CLI):
- MEME
- HOMER
- Autosome
- ...
-
GimmeMotifs https://gimmemotifs.readthedocs.io/en/master/
- Simple CLI
- Can run multiple other tools
- Databases included
Binding events and DNA motifs
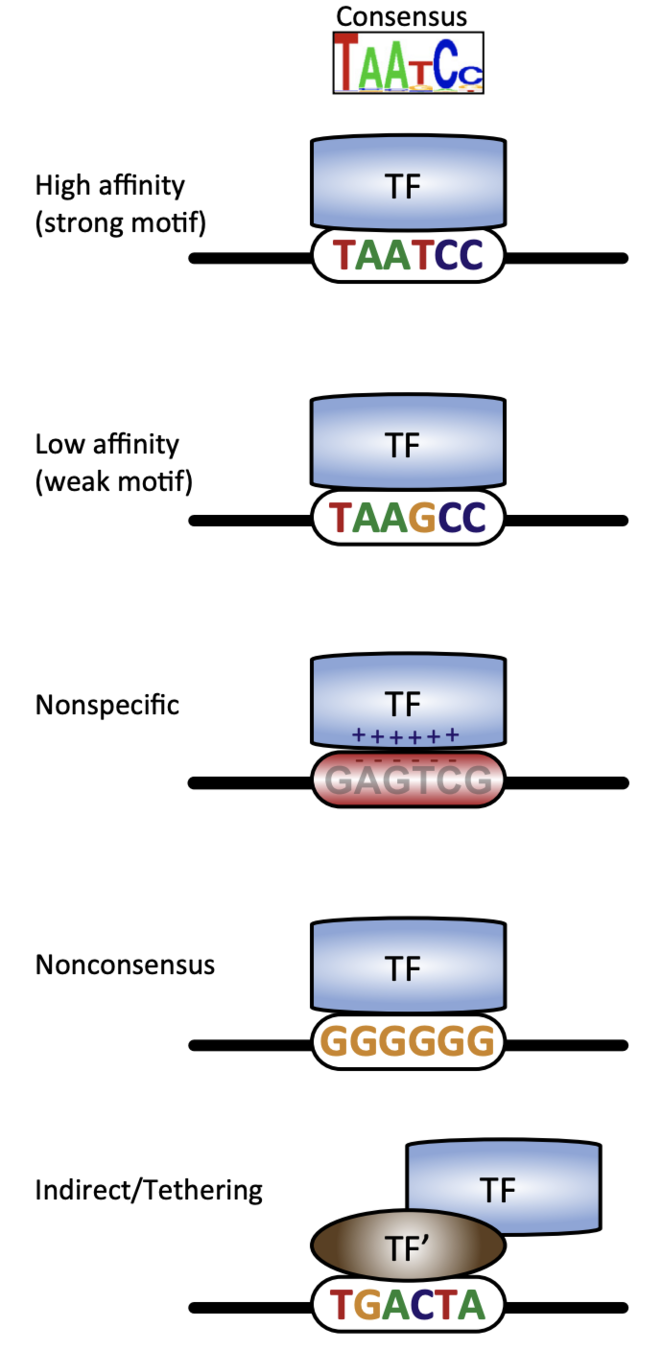
Specific and non-specific binding:
Slattery et al. 2014
Chromatin openness (accessibility)
Hsu et al. 2018, Slattery et al. 2014

We can also do motifs search in open chromatin regions
Epigenetics Practice 2:
ATAC-Seq data processing and motifs search
Practice results
- As a result of this practice I expect a small report on the results (free form, PDF format).
- The questions that should be covered in the report are highlighted in red.
- Your mark for the report cannot exceed 10 points.
- The deadline is in a week (next Thursday).
ATAC-Seq data processing
- ENCODE data processing standards:
https://www.encodeproject.org/data-standards/
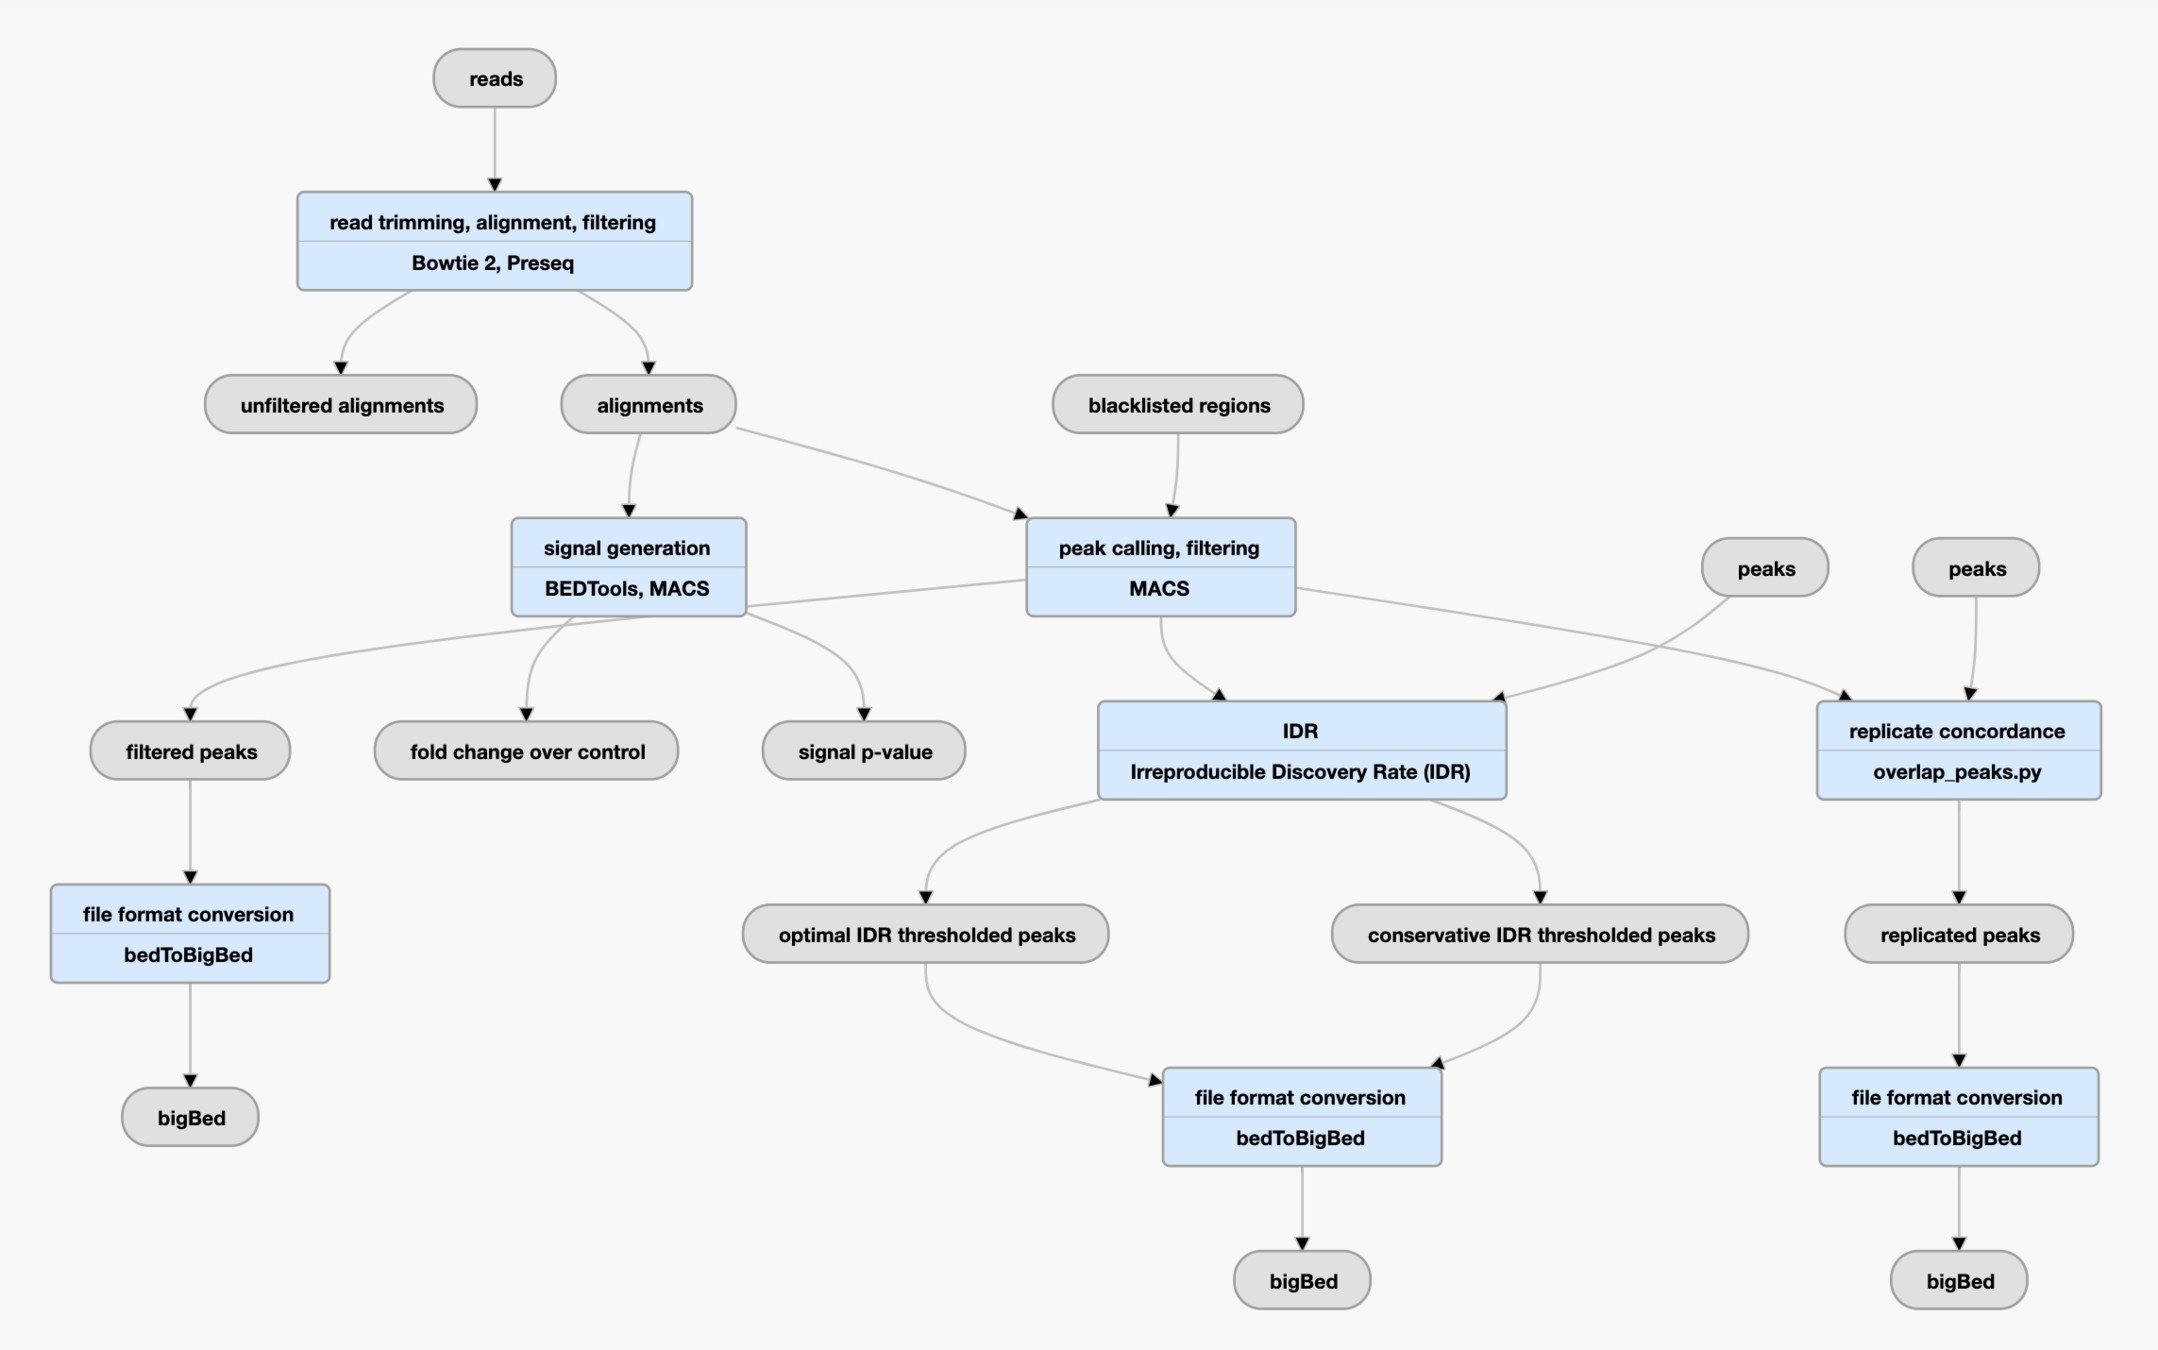
Bioinformatics pipelines for ATAC-Seq data processing
Pipeline is a set of processing steps, usually wrapped in a single script, container or tool.
Pipelines aim to be:
- High-performance
- Reproducible
- Scalable
Some web-server based pipelines:
- GALAXY
- DNA Nexus
Some command-line-based pipelines:
- ENCODE ATAC-Seq pipeline based on Caper/Cromwell
- Nextflow-core ATAC-Seq pipeline
- Snakemake ATAC-Seq pipelines (e.g., pyflow-ATACseq etc.)

Let's run our first pipeline
- Log in to the cluster
- Activate the environment:
- Setup the working directory:
Task 1 (no points, but if absent, the practice won't be counted as done):
Please, store all the obtained files and results in your home folder under EpiPract2 path. I will collect them in a week and check it.
$ ssh username@servername# Create the working directory and enter it:
$ mkdir EpiPract2
$ cd EpiPract2
# Copy the public ATAC-Seq nextflow-core repository and enter the directory with it:
$ git clone https://github.com/nf-core/atacseq.git
$ cd atacseq$ export PATH="/home/galitsyna/anaconda3/bin:$PATH"
$ printf "envs_dirs:\n - /home/galitsyna/anaconda3/envs/" > .condarc
$ conda activate atacseq-nfRunning the pipeline example
- Go to ATAC-Seq nextflow-core GitHub repository:
https://github.com/nf-core/atacseq
- Learn how to run a test on a minimal dataset with a single command (suggested by the authors in the manual).
Task 2 (1 point): What is the command that you use for running the pipeline? Add it to the report. - Check if nextflow is accessible in your environment on the cluster. Try to run the command from p. 2. What's changed?
Task 3 (0.5 point): List the content of the directory with results. - Nextflow names each run by a unique and catchy name (e.g. berserk_crick). What is the name of your run?
Task 4 (0.5 point): Add unique name of your run to the report. - Copy the folder ./results/multiQC to your local computer. Open the .html from there in your browser. Inspect.
Inspecting the data
The test dataset that authors provide is ATAC-Seq on Saccharomyces cerevisiae cells (yeast) from the Shep et al. paper.
You can find the details on it in GEO database: GSE66386
Open the link and read about it.
Inspecting
| Name | File Prefix for EpiPract2 |
|---|---|
| Anastasia Pivnyuk | OSMOTIC_STRESS_T0_R1_T1_1 |
| Nikita Sharaev | OSMOTIC_STRESS_T0_R1_T1_2 |
| Artemy Shumskiy | OSMOTIC_STRESS_T0_R2_T1_1 |
| Dmitrii Kriukov | OSMOTIC_STRESS_T0_R2_T1_2 |
| Pletenev Ilya | OSMOTIC_STRESS_T15_R1_T1_1 |
| Konstantin Chernyshov | OSMOTIC_STRESS_T15_R1_T1_2 |
| Ivan Kuznetsov | OSMOTIC_STRESS_T15_R2_T1_1 |
| Anna Kalinina | OSMOTIC_STRESS_T15_R2_T1_2 |
| Sofya Kasatskaya | OSMOTIC_STRESS_T0_R1_T1_1 |
| Julia Bocharkina | OSMOTIC_STRESS_T0_R1_T1_2 |
| Vasily Borodin | OSMOTIC_STRESS_T0_R2_T1_1 |
| Sofia Kamalyan | OSMOTIC_STRESS_T0_R2_T1_2 |
| Anna Krasivskaya | OSMOTIC_STRESS_T15_R1_T1_1 |
| Aleksandra Ozerova | OSMOTIC_STRESS_T15_R1_T1_2 |
| Victoria Kobets | OSMOTIC_STRESS_T15_R2_T1_1 |
| Slesareva Anastasiia | OSMOTIC_STRESS_T15_R2_T1_2 |
| Mikhail Moldovan | OSMOTIC_STRESS_T0_R1_T1_1 |
| Viktor Mamontov | OSMOTIC_STRESS_T0_R1_T1_2 |
| Evgeniia Alekseeva | OSMOTIC_STRESS_T0_R2_T1_1 |
| Trofimova Anna | OSMOTIC_STRESS_T0_R2_T1_2 |
- Your FASTQ file is listed in a table. Is it a forward or reverse part of the library? To what experiment and library does it correspond?
- Is the corresponding experiment merged during the run of the pipeline with other replicates? At what steps?
Task 5 (0.5 points): Describe the details of your experiment and answer the questions above. Is it similar to others or is it outlier? By what criteria? (List at least one)
Parameters tuning
We aim to study the binding of transcription factors in them. Thus we should explicitly state that we need the narrow peaks originating from TF binding.
- Set the parameter --narrow_peak and run the pipeline again (on a cluster).
- Copy the folder ./results/multiQC to your local computer.
- Open multiQC reports for both narrow and broad peaks mode on your browser. Inspect.
Task 6 (1.5 point): What is the Fraction of Reads in Peaks for your experiment with and without --narow_peak option?
Why?
Is it consistent with the number of peaks for your experiment?
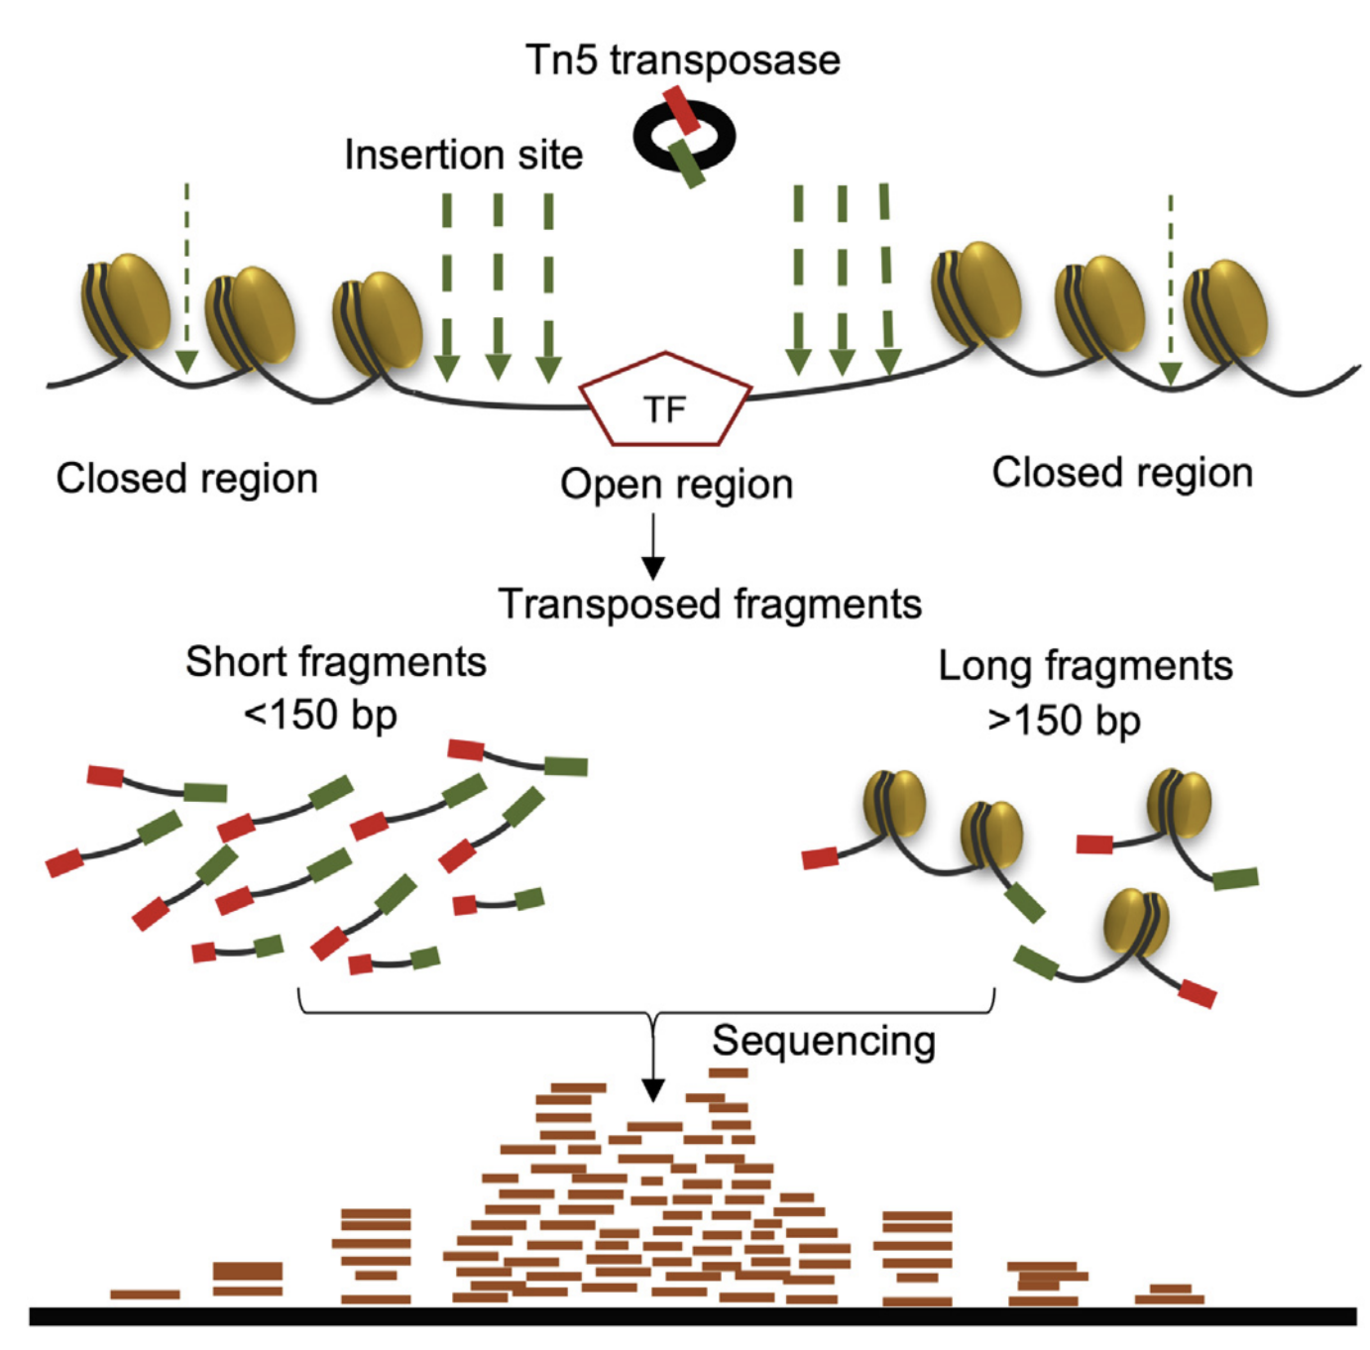
ATAC-Seq
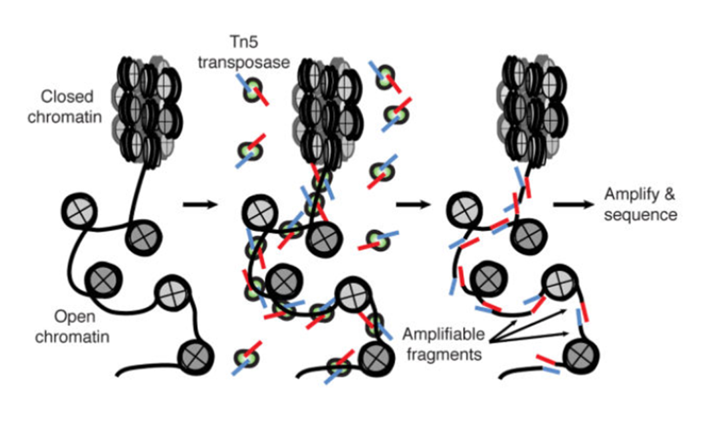
Buenrostro et al., 2013
- A memo from the last lesson:
ATAC-Seq
Hsu et al. 2018
paired-end sequencing and mapping
ATAC-Seq: insertion size distribution
Buenrostro et al., 2013
- Distance between forward and reverse mapping positions:

ATAC-Seq: insertion size distribution
Buenrostro et al., 2013
- Distance between forward and reverse mapping positions:
ATAC-Seq: insertion size distribution
Buenrostro et al., 2013
- Distance between forward and reverse mapping positions:
Nucleosome-free fraction
Nucleosome-bound fraction
ATAC-Seq around gene starts
Buenrostro et al., 2013
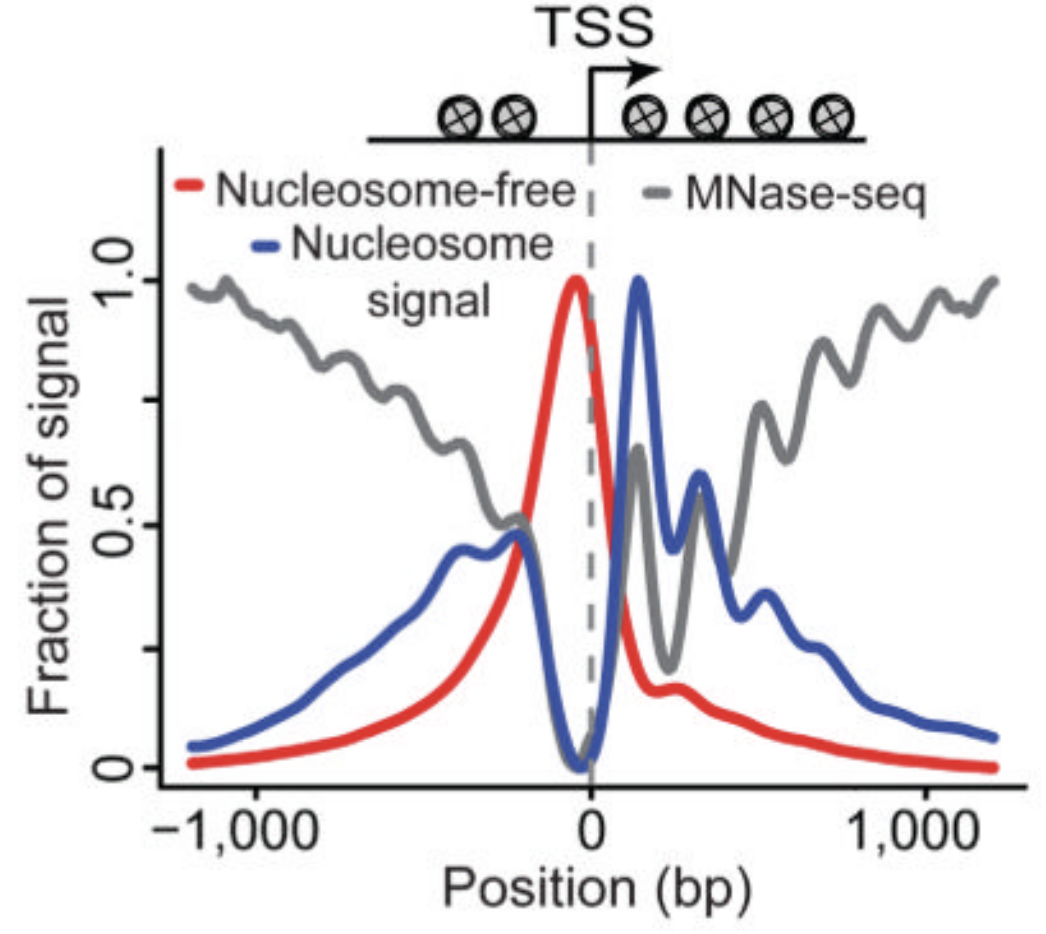
Nucleosome-free fraction
Nucleosome-bound fraction
- Average plot around
Transcription Start Sites (TSS):
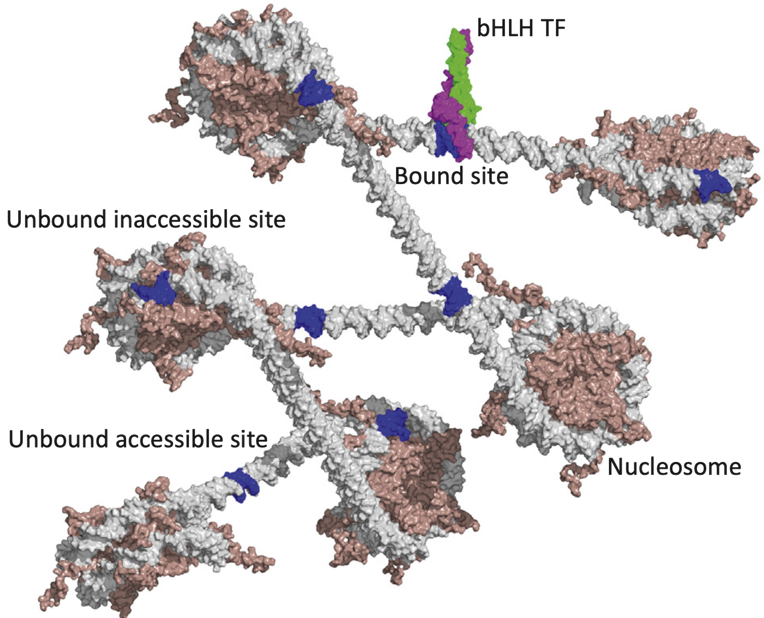
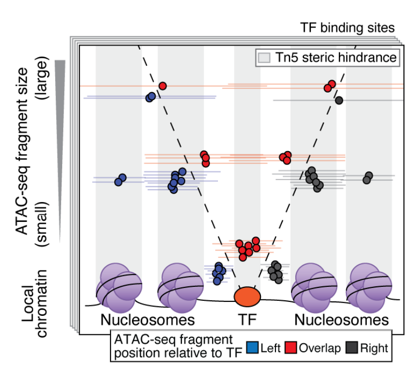
ATAC-Seq around TF binding sites
Albanus et al., 2019
We can plot V-plot around positions of factors binding sites:
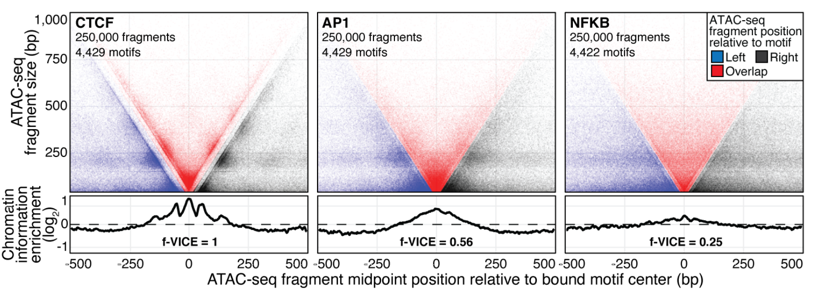
ATAC-Seq around TF binding sites
Albanus et al., 2019
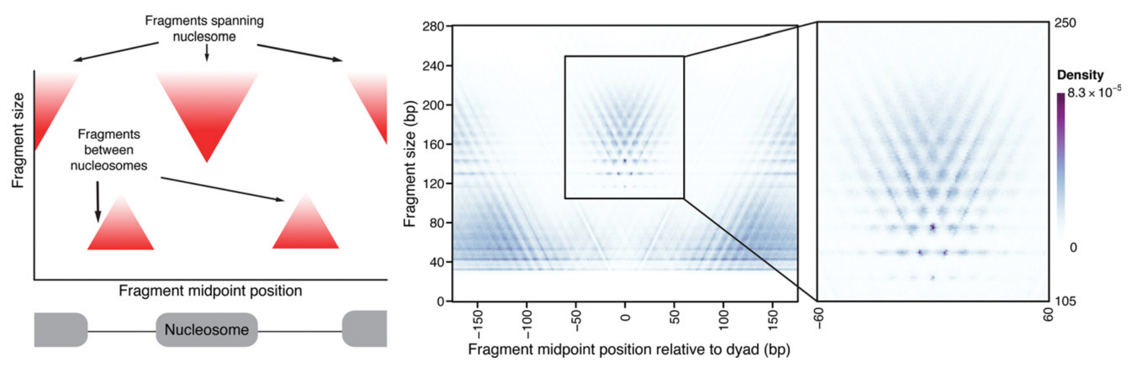
ATAC-Seq around nucleosomes
Schep et al., 2015
We can also plot V-plot around positions of nucleosomes:
Back to your ATAC-Seq report
Find the distribution of insert size in your report.
Highlight your ATAC-Seq experiment.
Task 7 (1 points): What is the approximate spacing between sequential nucleosomes in your ATAC-Seq? Highlight it on a plot and add to the report
Task 8 (1 points): Can you see dimers of nucleosomes? Trimers? Tetramers? Report and speculate, why.
Additional slides
(skip if not requested)
Motifs de novo search
- Activate the environment for motifs search:
- Download the annotation and the genome:
- Run the motifs search in your narrowPeak file:
(follow the manual, if needed)
- Download the resulting HTML report.
Task 9 (2 points): What are the found motifs? Report the logo of the best hit. What is the significance of the hit? What might be the factor that binds this motif (given the experimental setup and analysis)?
$ genomepy install sacCer3 UCSC --annotation$ conda activate gimme$ gimme motifs <your-narrowPeakFile> gimme.denovo.output -g sacCer3 --denovoMotifs scanning
- Run motifs scanning against CIS-BP database:
- Download tehre resulting report. Inspect.
Task 10 (2 points): What are the found motifs? Report the logo of the best hit. What is the significance of the hit? Is it similar to the one that was found de novo?
$ gimme motifs <yourfile> -p HOMER --known -g sacCer3