How AgilityVisual Works
Performance Management Software
One platform that gives leaders clarity, alignment, and real-time control over performance from KPIs to goals to daily execution.
- Situational Awareness
- Goal Tracking
- Team Alignment
- Connected Boards
Three problems quietly undermine performance
Dashboard & information overflow Data lives scattered across tools and dashboards, forcing leaders to hunt for what actually matters.
Leadership disconnect Teams and leaders lose a shared understanding of goals, priorities, and what "good" looks like.
Intransparency & loss of control Without a real-time view, deviations go unnoticed until they've already become a problem.
AgilityVisual replaces all three with a single, connected performance management platform.
One platform. All information.
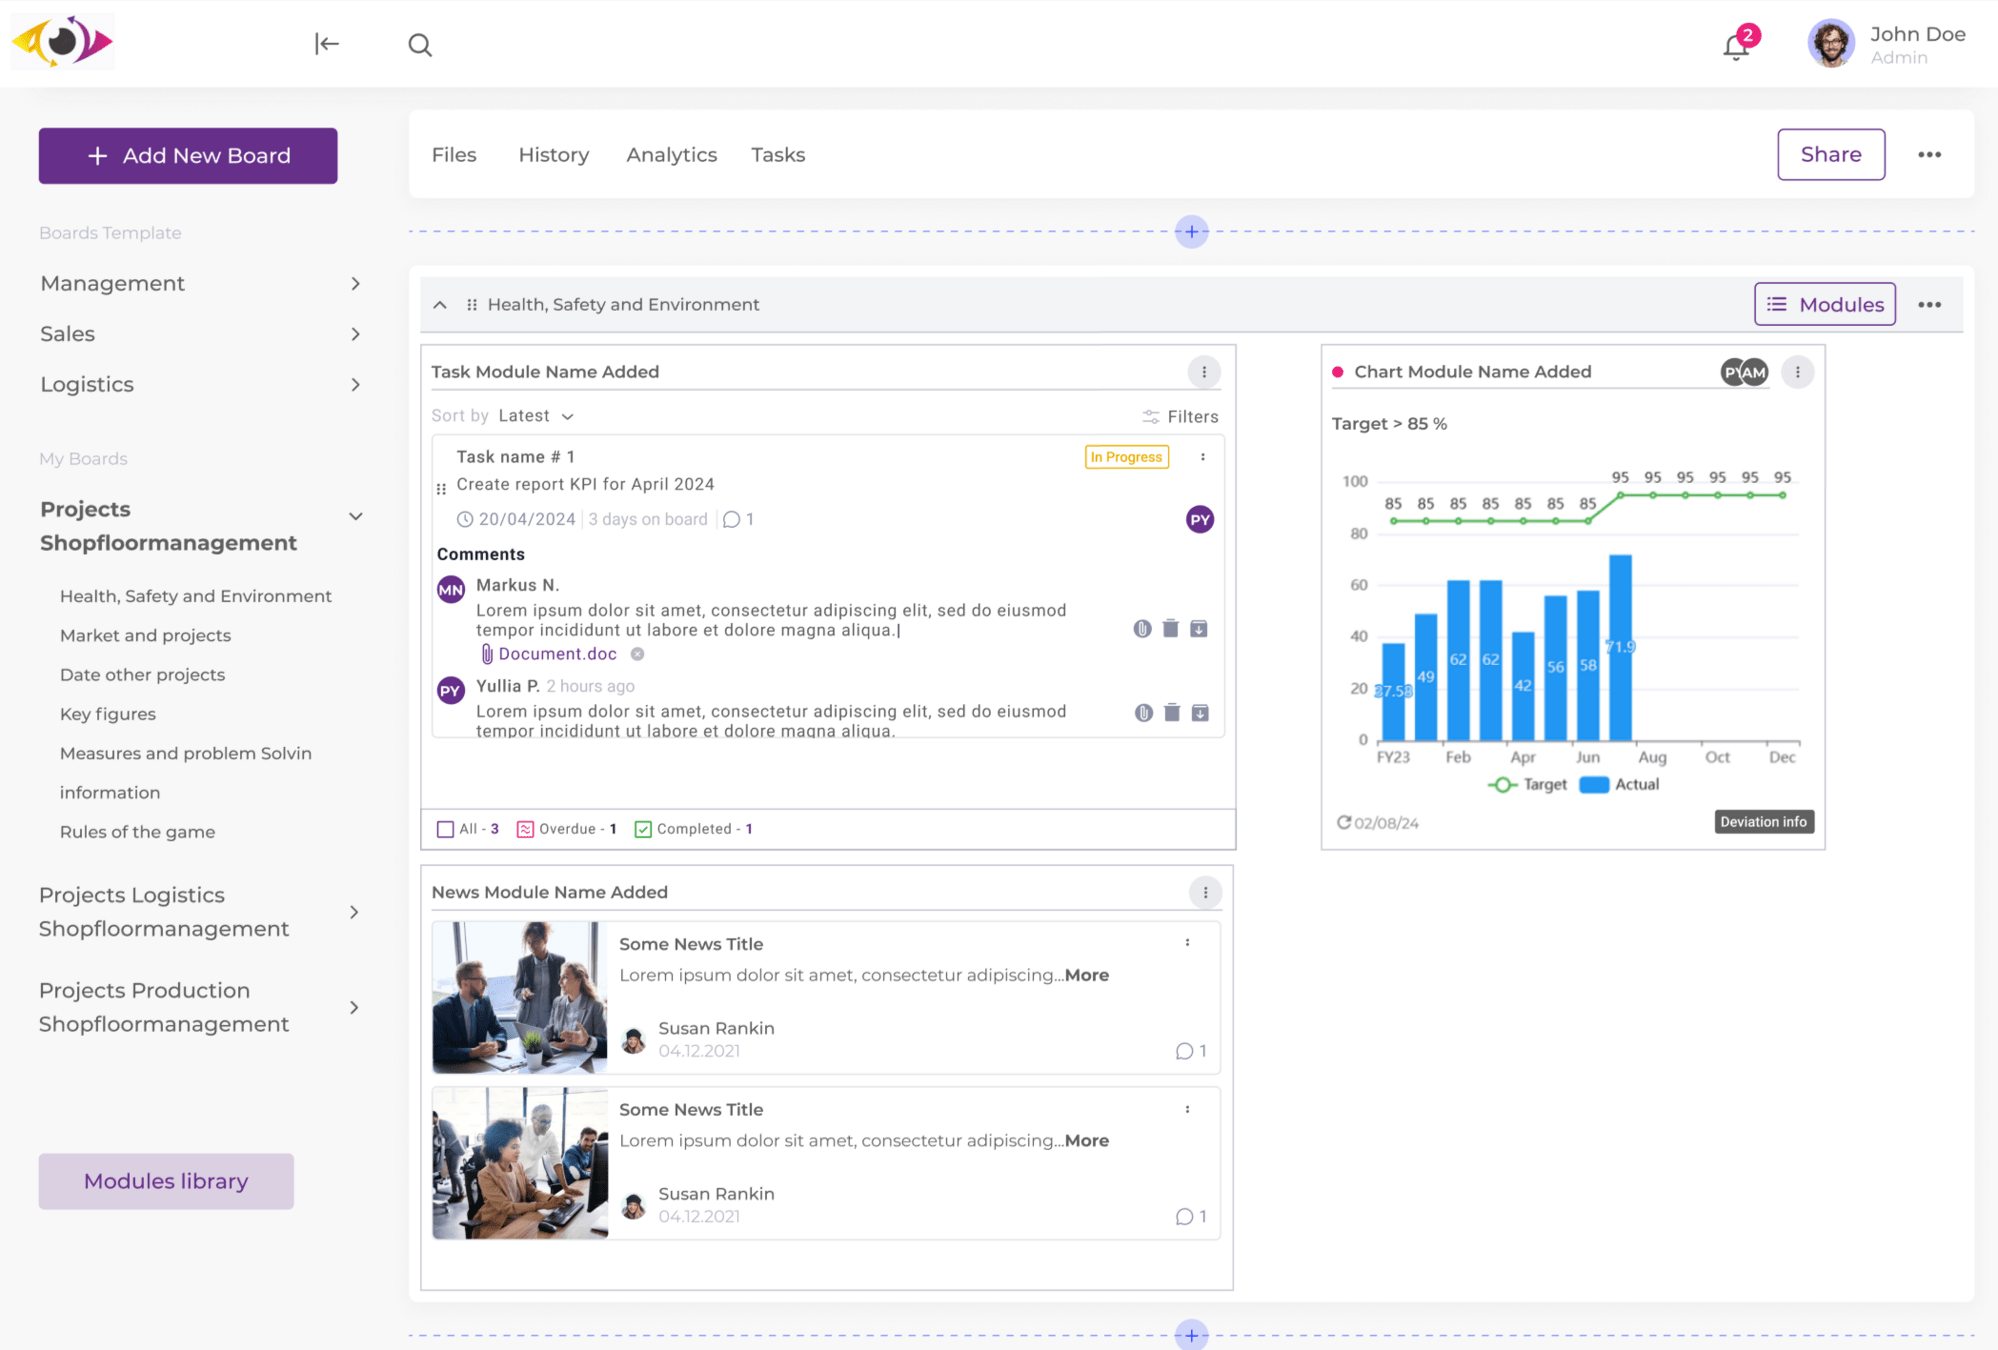
AgilityVisual is built around a simple structure: flexible Boards made up of Modules. Together they give every team and leader one connected place to see, track, and act on performance.
- Boards: Custom boards for each team, department, or workflow.
- Modules: Drop in KPIs, tasks, charts, and news — no coding needed.
- Real-time view: Everyone sees the same live data, always up to date.
BOARD: Leadership Overview
- KPI Module — Revenue vs. target: 94%
- Task Module — 12 open · 3 due today
- Deviation Alert — Churn +2.1% this week
- Team Update — Erika posted a countermeasure
How It Works — Step 1
Build boards that mirror how your teams work
Create a board for any department, project, or workflow. Then add flexible modules tasks, charts, KPIs, or text to build a dashboard tailored exactly to that team's needs. No coding, no IT ticket, no waiting.
- Set up in minutes, adjust anytime
- Mix and match module types freely
- Share boards across teams instantly
Marketing Team Board: Campaign KPIs · Content Tasks · Team News · Quarterly Goals
How It Works — Step 2
See what's happening, in real time
Every board updates live, so leaders and teams proactively spot important events not react to them days later. Everyone works from the same shared picture of reality, which keeps teams aligned on what matters right now.
- Proactive alerts : Get notified the moment a metric moves outside its expected range.
- Shared mental models : Everyone sees the same live data — no more conflicting reports.
- Built-in communication : Discuss, comment, and update information directly on the board.
How It Works — Step 3
Track goals and catch deviations early
Built-in KPI visualization keeps every goal visible and reviewed — so gaps get closed before they become quarter-end surprises.
- Set the target: Define KPIs and goals for each team or board.
- Visualize progress: Track performance against target automatically.
- Spot the deviation: Get flagged the moment results drift off track.
- Act on it: Assign countermeasures and escalate tasks as needed.
How It Works — Step 4
Boards connect into one digital infrastructure
Modules and items tasks, news, KPIs can be shared and linked across boards. Update it once at the source, and it stays current everywhere it's connected, so leaders and teams stay aligned at speed.
- One update, everywhere it matters
- Real-time sync across every board
- Faster decisions, less duplicate work
Connected boards: Executive Board · Sales Board · Ops Board · HR Board — all linked through AgilityVisual Core
What leaders gain with AgilityVisual
- Situational Awareness: Proactively spot events that impact the business.
- Team Mental Models: A shared understanding across every team.
- Goal Achievement: Goals reviewed, deviations caught, action taken.
- Effective Communication: Share and update what matters, in one place.
- Flexibility & Agility: Adapt boards to new needs, no coding required.
- Organizational Performance: Measurable gains in productivity and results.
Ready to see it in action?
Book a demo and see how AgilityVisual brings clarity, alignment, and results to your organization.
Request a Demo www.agilityvisual.ai