Tracking the Development of Brain Connectivity in Adolescence through a Fast Bayesian Integrative Method
Aiying Zhang, Bochao Jia, Yu-Ping Wang
Feb 14th, 2018
Adolescence
- "Impulsive", "Vulnerable", "Rebellious"
- Second dramatic brain growth
- Evolution of modular functional organization
- sub-network communities
- the expansion of cognitive and behavioral capabilities
@ Katrina Schwartz, 2015

@ Marisa Silveri, 2016
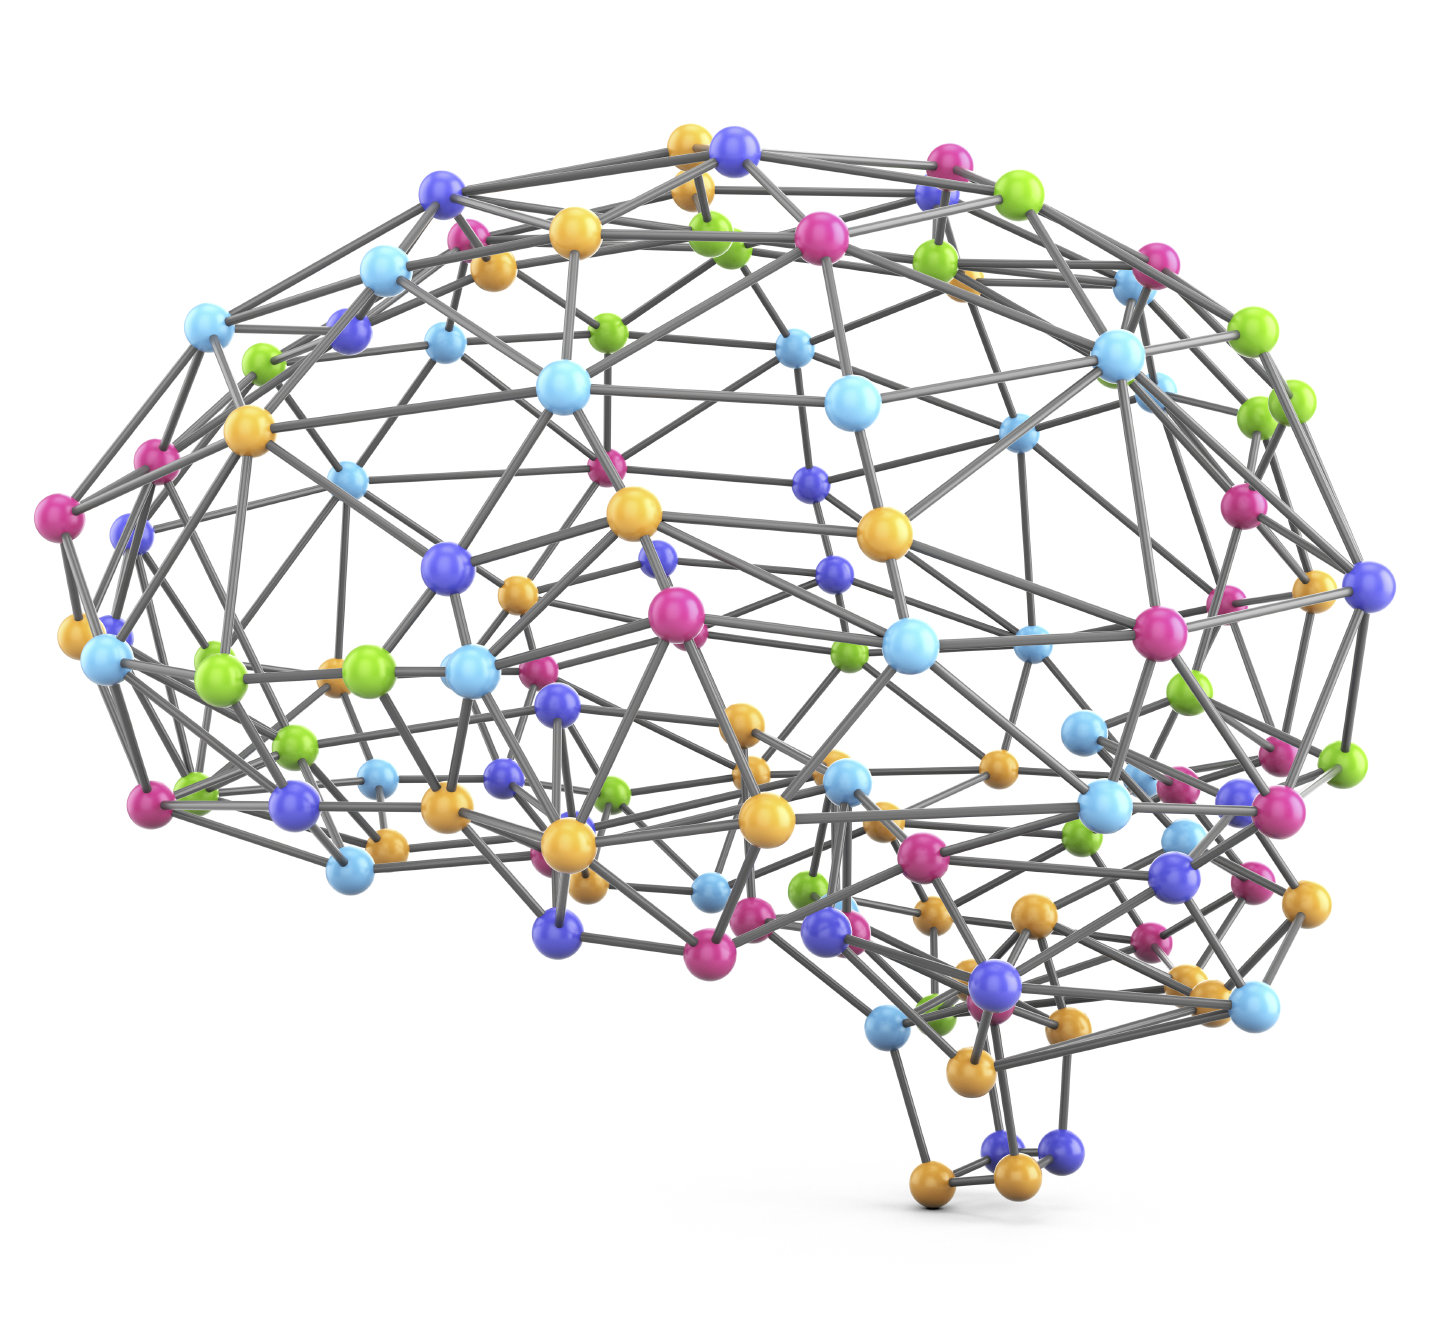
Graphical Model
Node: Brain region
Edge: Connectivity/ Association
Method: Gaussian Graphical Model
- Partial correlation:
- Measure of direct connectivity
- The absolute value indicates the strength of the connectivity
@ istockphoto/mbortolino
Motivations
- Clinically:
Track functional brain connectivity development
- Mathematically:
Jointly estimate multiple graphical models under distinct but related conditions
Material
Data description:
- Source:
Philadelphia Neurodevelopmental Cohort (PNC)
- Sample size:
861 individuals, age from 8-22
- Image type:
Resting- state fMRI
Data acquisition & prepossessing:
- All data were aquired on the same scanner with the same imaging sequences.
-
Standard preprocessing steps were applied using SPM12
- Parcellated the rs-fMRI into 264 functionally defined regions using the power atlas
| Group | Stage | Age | Number of subjects |
|---|---|---|---|
| 1 | Pre-adolescence | 8-11 | 131 |
| 2 | Early adolescence | 11-14 | 199 |
| 3 | Middle adolescence | 14-17 | 244 |
| 4 | Late adolescence | 17-20 | 236 |
| 5 | Post-adolescence | 20-22 | 51 |
Table 1. Group division information
Material
Due to physical and cognitive changes, we divided the subjects into five distinct stages related to adolescence.
Method
Joint estimation of multiple graphs
- Based on GGM
- Take into consideration of time influence
- Maximize the similarities
- Keep distinguished differences
- Notations:
- K = 5 conditions, = 264 nodes
- ---- the status of the l-th edge under condition k
- ---- the score that indicates
Fast Bayesian integrative analysis
--- FBIA
Assumption:
- ’s are mutually independent
- Follow a mixed Gaussian distribution given :
Fast Bayesian integrative analysis
--- FBIA
Introduce Bayesian Inference:
Fast Bayesian integrative analysis
--- FBIA
In total, possible configurations of with posterior probability
Fast Bayesian integrative analysis
--- FBIA
Introduce Stouffer's meta-analysis for integration
Bayesian integrated
Results
Figure 1. The visualization of brain connectivity patterns (sagittal views) from pre-adolescence to post adolescence
| Stage 1 | Stage 2 | Stage 3 | Stage 4 | Stage 5 | |
|---|---|---|---|---|---|
| Characteristic path length | 0.0055 | 0.0056 | 0.0059 | 0.0055 | 0.0039 |
| Clustering coefficient | 0.0835 | 0.0593 | 0.0857 | 0.0735 | 0.0170 |
| Transitivity | 0.1834 | 0.1592 | 0.1680 | 0.1494 | 0.0583 |
Table 2. Global network measures for different stages in adolescence
Clustering coefficient & transitivity
- Clustering strength of a network
- Maximum: middle adolescence (14-17)
Characteristic path length
- Ability to rapidly combine specialized information from distributed brain regions
- Remains steady in adolescence and then drops rapidly
Results
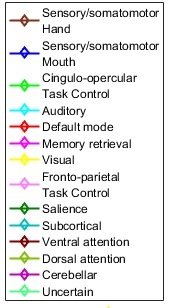
Figure 2. Brain connectivity development in different functional modules over various adolescence stages. The x-axis stands for each stage and the y-axis is the number of the total connectivity’s in each module.
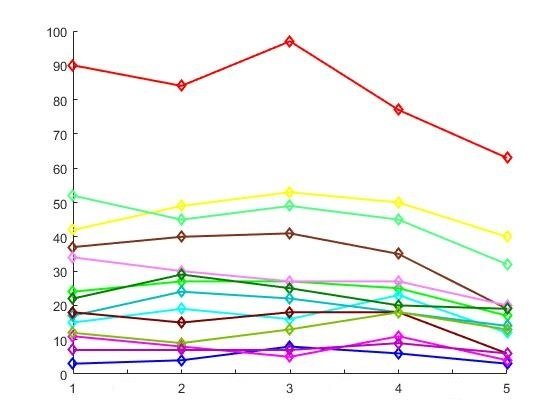
- Significant changes:
Default mode
Sensory/somatomotor hand
Fronto-parietal
- Steady performance:
Ventral attention
Dorsal attention
Cerebellar
- Late puberty:
Cingulo-opercular Task Control
Auditory
Fronto-parietal Task Control
Acknowledgement
The work is funded by
- NIH R01GM109068, R01MH104680, R01MH107354
- NSF #1539067
Main References
1. Power, J. D., Fair, D. A., Schlaggar, B. L., & Petersen, S. E. (2010). The development of Human Functional Brain Networks. Neuron, 67(5), 735–748.
2. Satterthwaite TD, Elliott MA, Ruparel K, Loughead J, Prabhakaran K, Calkins ME, Hopson R, Jackson C, Keefe J, Riley M, Mentch FD, Sleiman P, Verma R, Davatzikos C, Hakonarson H, Gur RC,Gur RE (2014a): Neuroimaging of the Philadelphia neurodevelopmental cohort. Neuroimage 86:544–553.
3. Jia, B., Tseng,G., Liang, F. (2017). Fast Bayesian Integrative Analysis for Joint Estimation of Multiple Gaussian Graphical Models.
4. Kim, J., Wozniak, J. R., Mueller, B. A., Shen, X., & Pan, W. (2014). Comparison of Statistical Tests for Group Differences in Brain Functional Networks. NeuroImage, 101, 681–694.