Barcelona's Urban Environment
Barcelona's Urban Environment

Jordi Bayer
Alejandro Casamajor
Main Challenges
Our main challenge was the database cleaning. We needed to calculate the mean of the different pollution values, so we had to remove all the NaN values from the tables.
Also, there were many columns with '--' which we had to remove as well.
Finally, we changed their types from object to int.
Our main challenge was the database cleaning. We needed to calculate the mean of the different pollution values, so we had to remove all the NaN values from the tables.
Also, there were many columns with '--' which we had to remove as well.
Finally, we changed their types from object to int.

Data Cleaning


DB name: Arbolitos

Table name: Bcn_trees
Table name: Bcn_pollution
Table name: Avg rent per neighborhood
How is our data saved
Data sources
-Bcn City Hall webpage for the trees database and the air pollution database
-Europa Press for the rent per capita average for each neighborhood
-World Health Organization (OMS in spanish) webpage for the maximum allowed levels of pollution
Insights
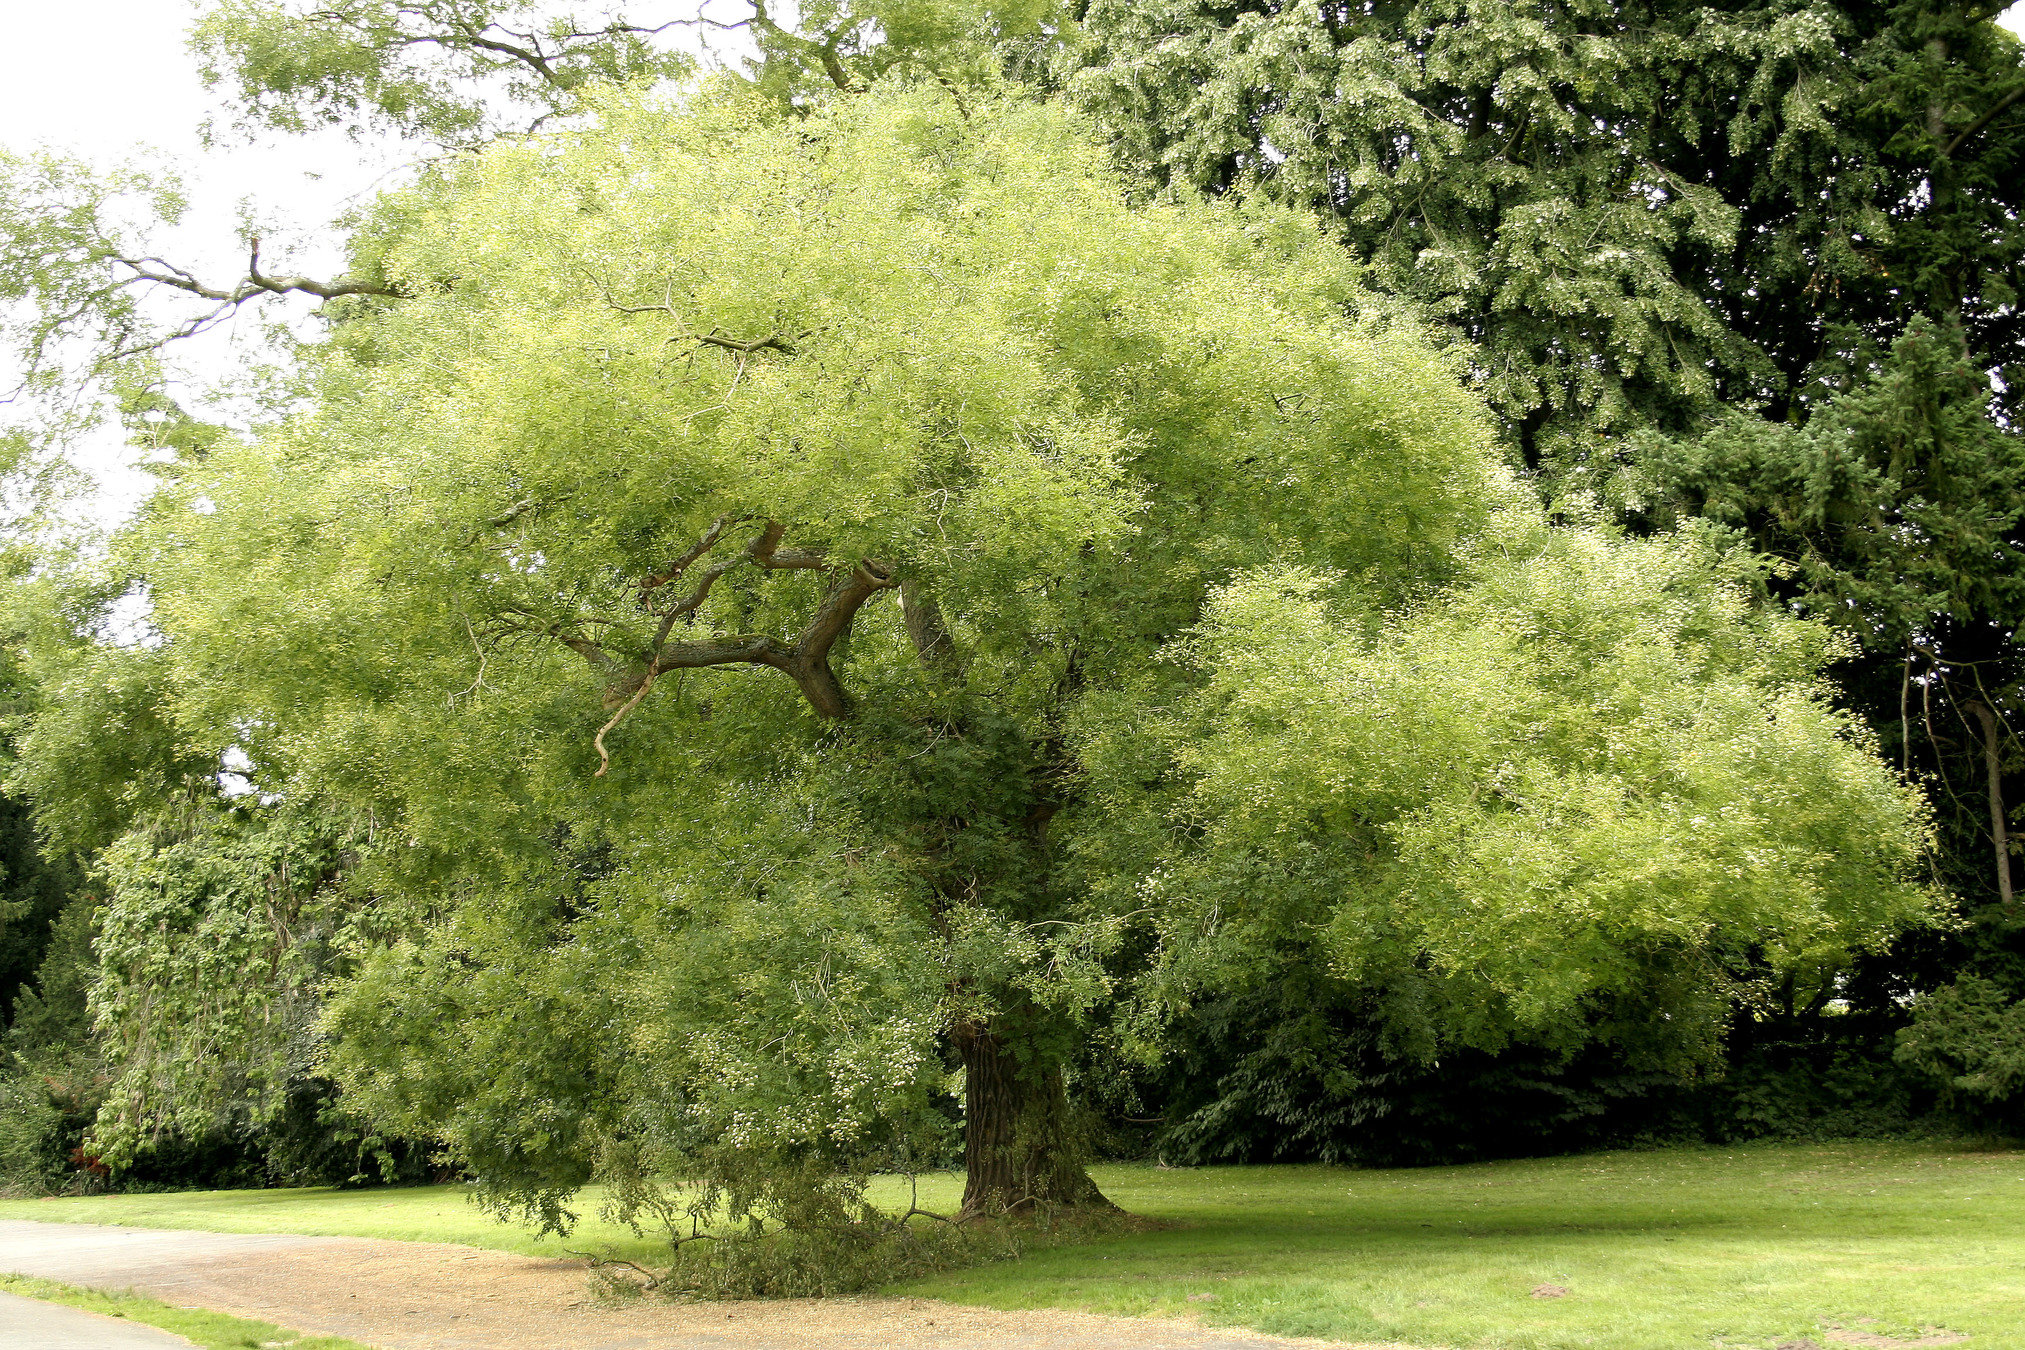
Most common trees in Bcn (scientific name)
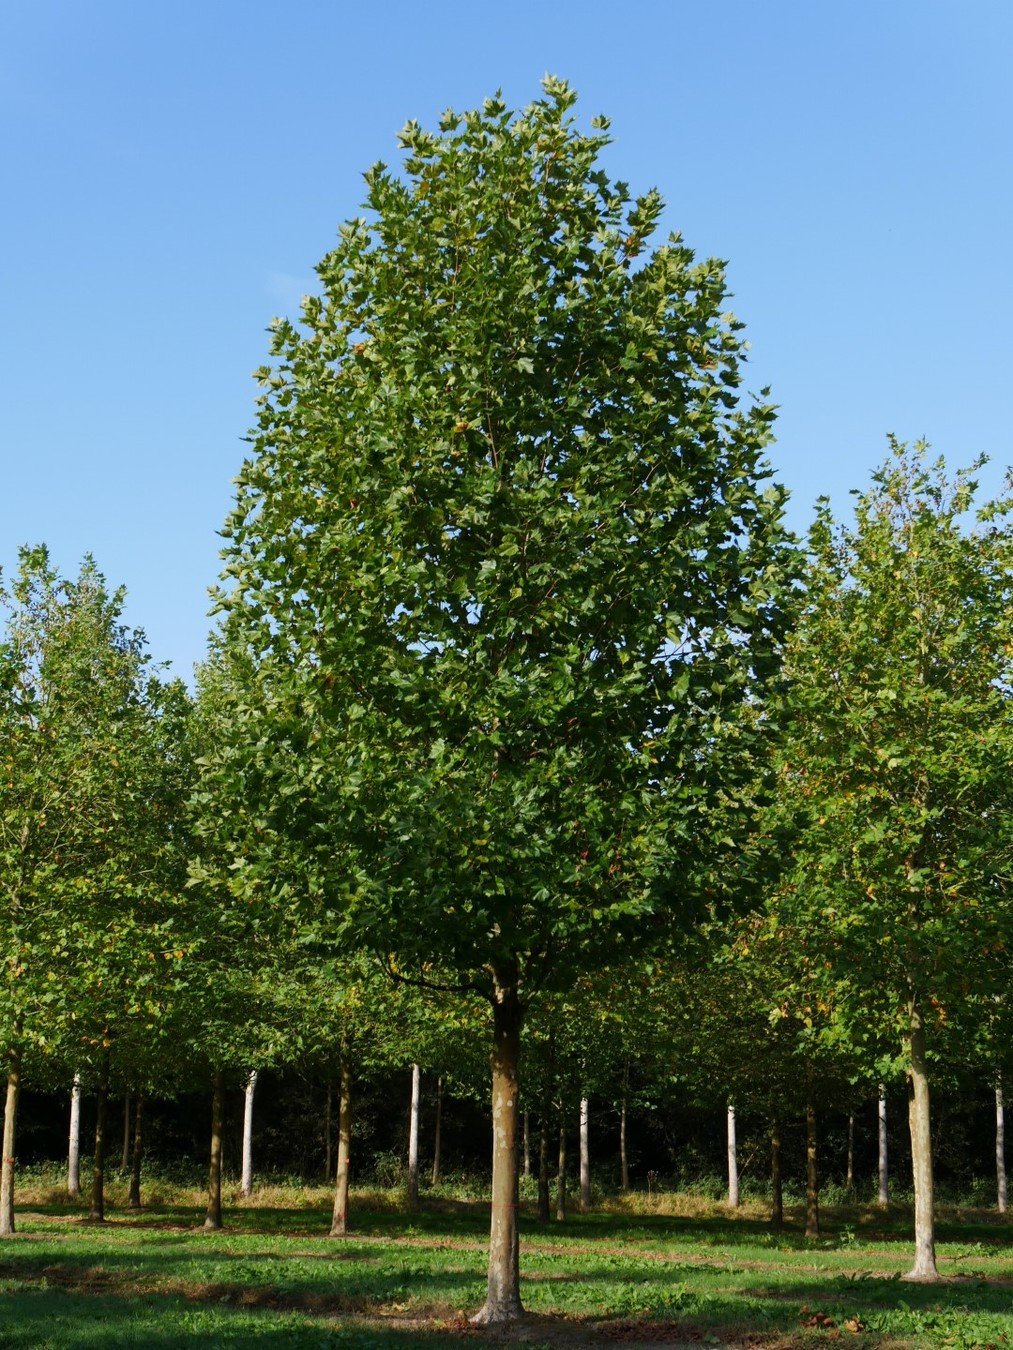
platanus hispanica
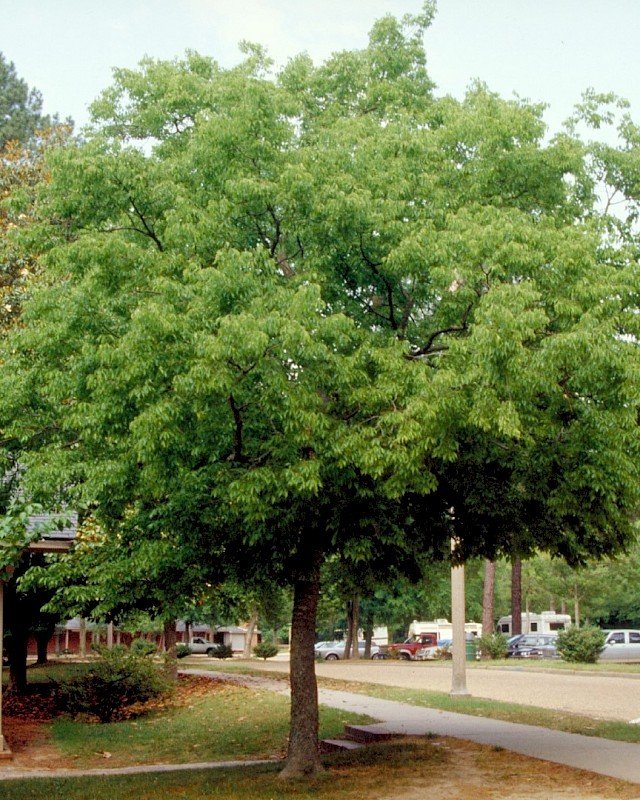
styphnolobium japonicum
celis australis


Average pollution values

Average rent per capita and trees per neighborhood
Sarria and Les Corts have the highest rent per capita. Nou Barris, Ciutat Vella and Sants-Montjuic the lowest one.
Sant Martí, l'Eixample and Sants-Montjuic are the neighborhoods with the biggest amount of trees. Ciutat Vella and Gràcia are the ones with the smallest one.
L'Eixample and Gràcia have a huge amount of pollution whilst Sarrià-Sant Gervasi is the less polluted neighborhood.

Maximum recommended level of Ozone (O3): 100 μg/m3
Maximum recommended level of Nitrogen Dioxide (NO2): 200 μg/m3

Maximum recommended level of Particulate Matter (PM10): 50 μg/m3


If we take a close look to all the data we have, we are not able to set a relation between the amount of trees, the levels of pollution and the rent per capita of each neighborhood. The reason for that might be other factors we have not data from, such as the size of the neighborhood or it's traffic volume.
We also wanted to compare each neighborhood's happiness with its amount of trees, but we could not do it as we didn't find any data.
Text
Questions we couldn't answer