Impact of Baryonic Feedback on Cosmological Constraints from Weak Lensing
Andreas Tersenov
Deep CosmoStat Days, Feb 12, 2026


For which we have/assume an analytical likelihood function
How to constrain cosmological parameters?
Likelihood → connects our compressed observations to the cosmological parameters
Credit: Justine Zeghal
2pt vs higher-order statistics
Using Power Spectra for constraining cosmological parameters misses the non-Gaussian information in the field.


DES Y3 Results
Credit: Justine Zeghal
Higher Order Statistics: Peak Counts
=
+
+
+
+
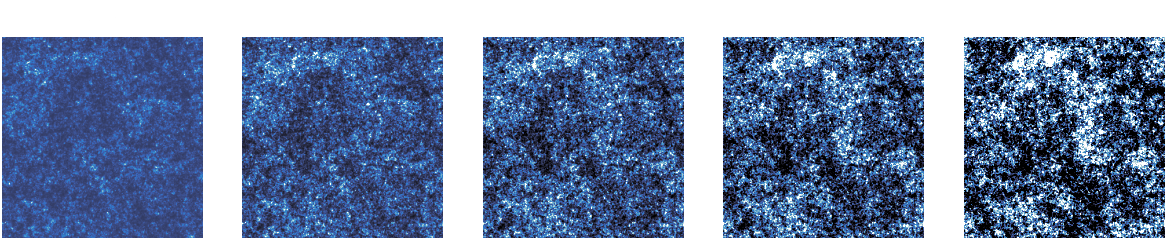
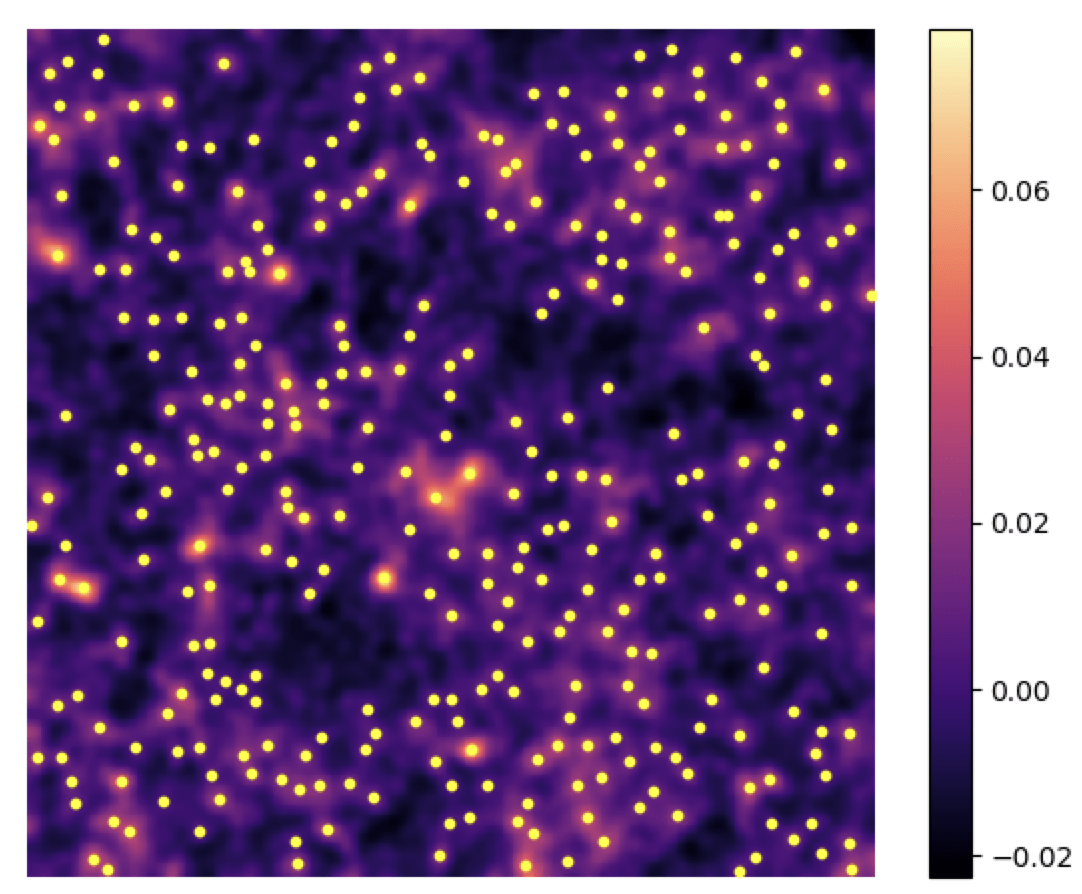
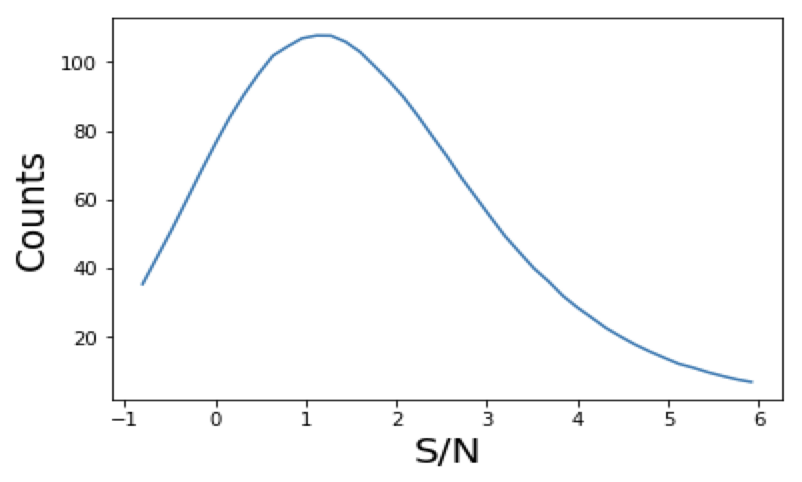
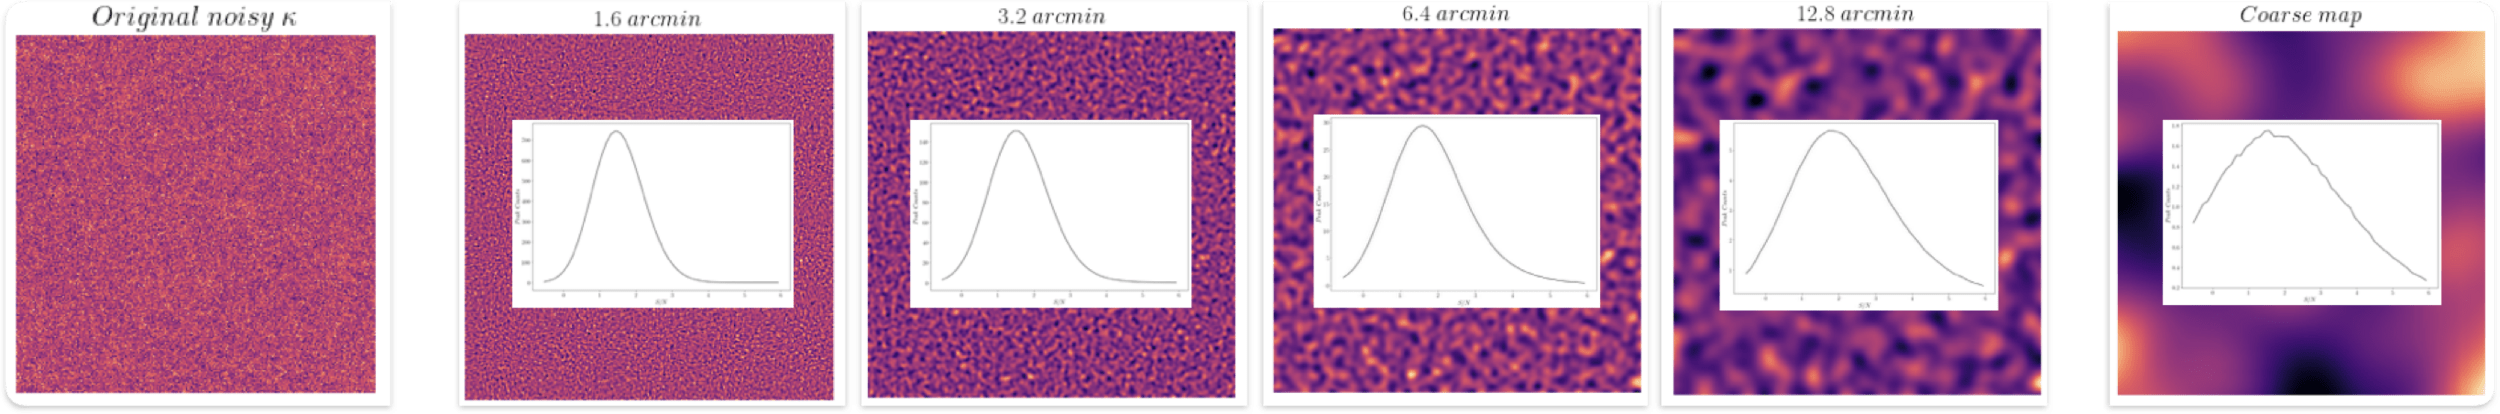
- Peaks: local maxima of the SNR field
- Peaks trace regions where the value of 𝜅 is high → they are associated to massive structures
Multi-scale (wavelet) peak counts
Baryonic effects
- Effects that stem from astrophysical processes involving ordinary matter (gas cooling, star formation, AGN feedback)
-
They modify the matter distribution by redistributing gas and stars within halos.
-
Suppress matter clustering on small scales
- Depend on the cosmic baryon fraction and cosmological parameters.
-
Must be cut/modeled/marginalized over to avoid biases in cosmological inferences from WL.
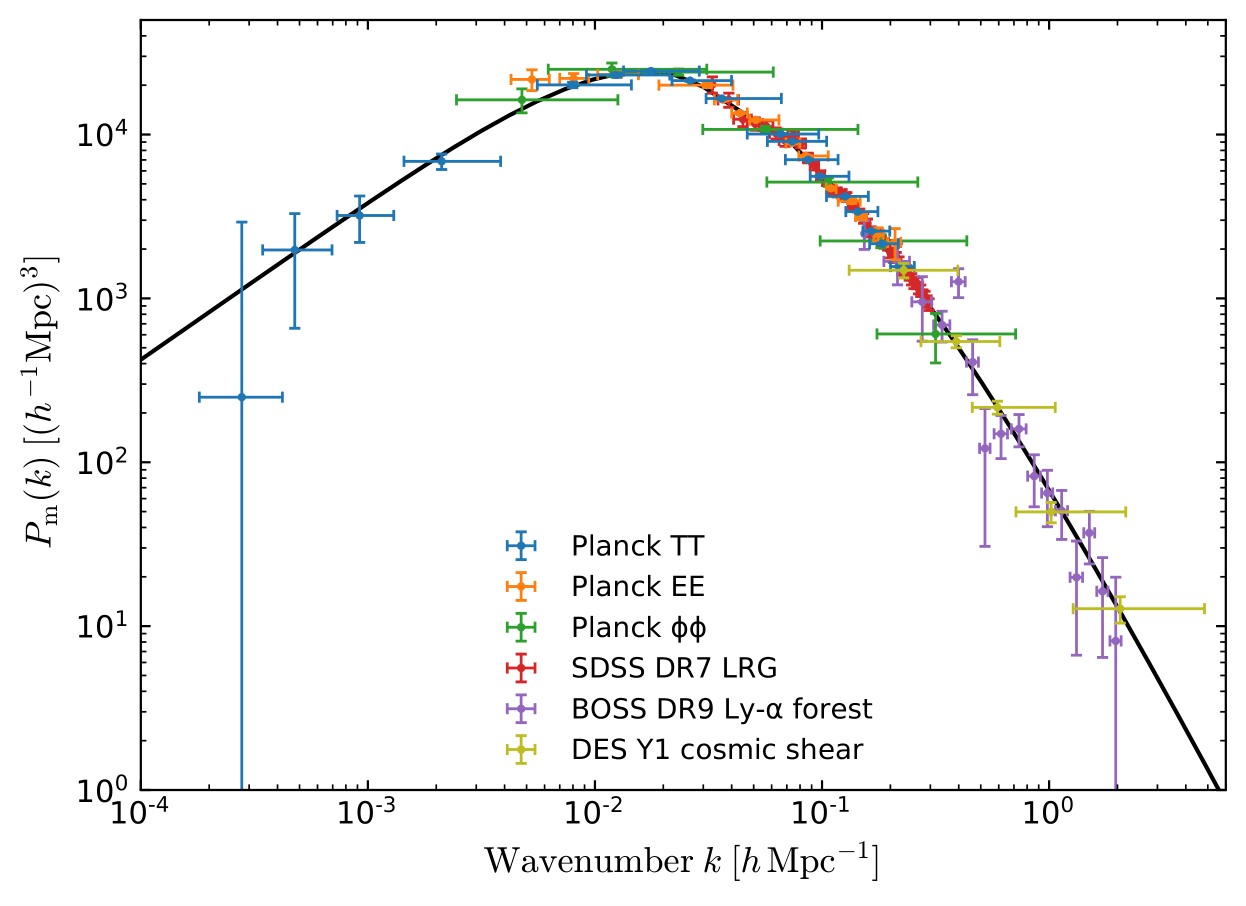
Baryonic impact on LSS statistics
baryonic effects in P(k)
Credit: Giovanni Aricò
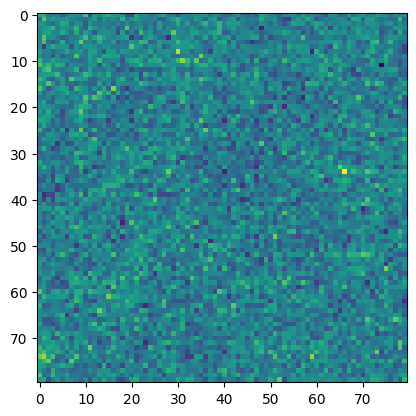
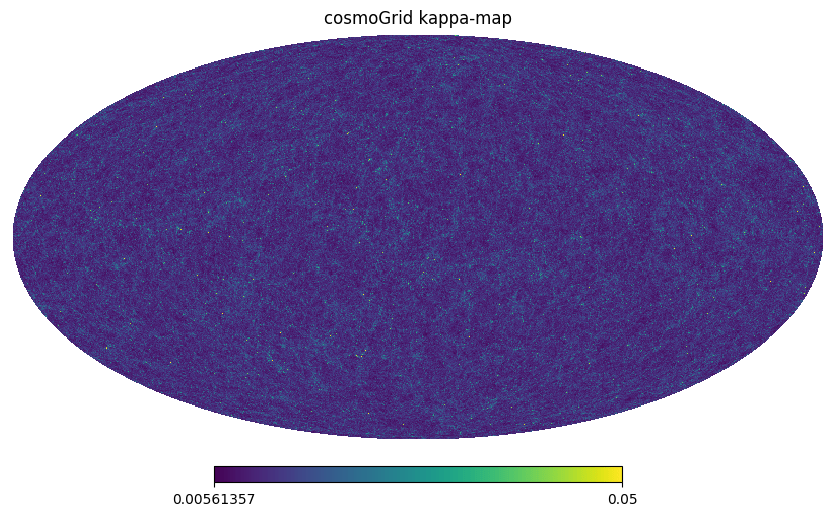
cosmoGRID:
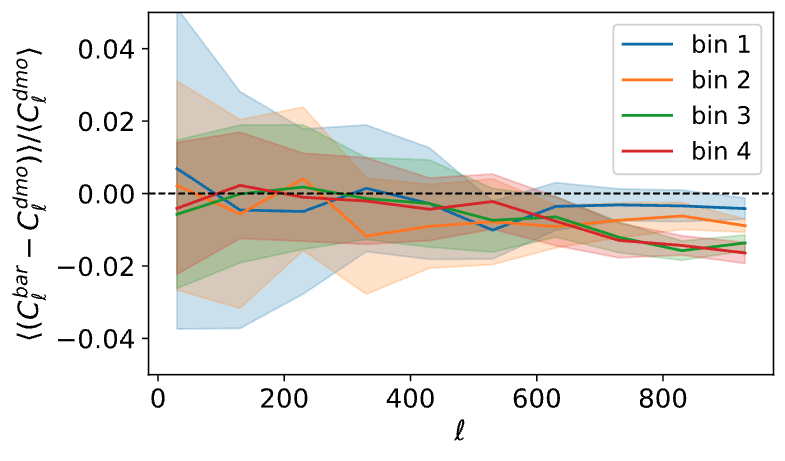
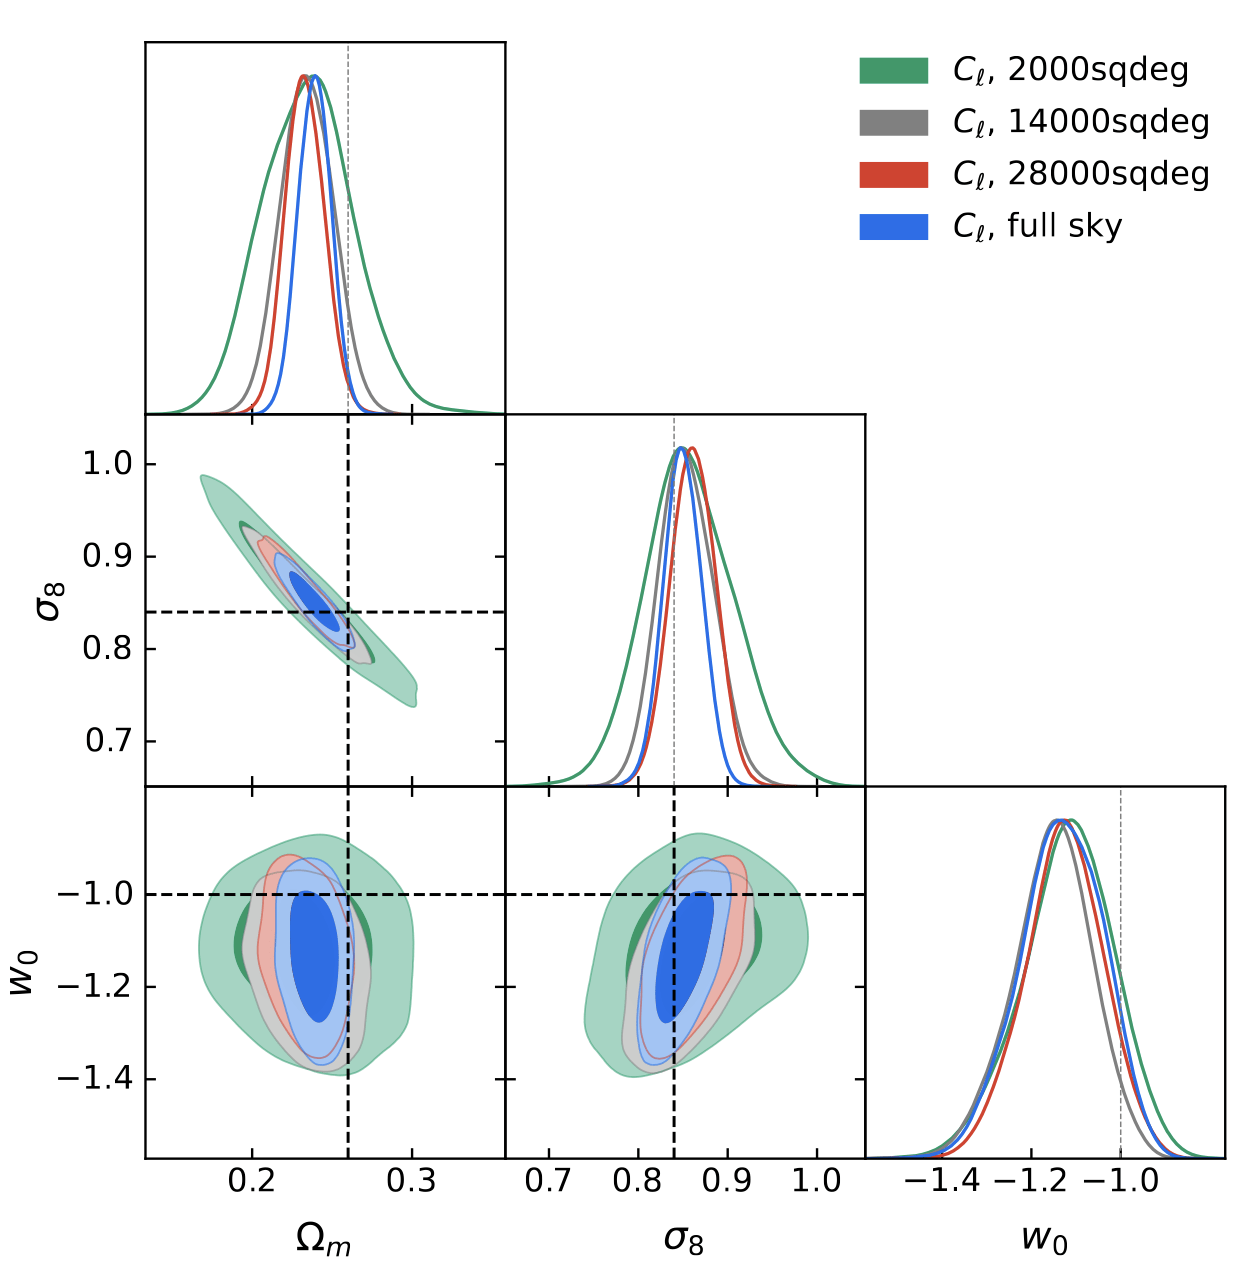
Power Spectrum
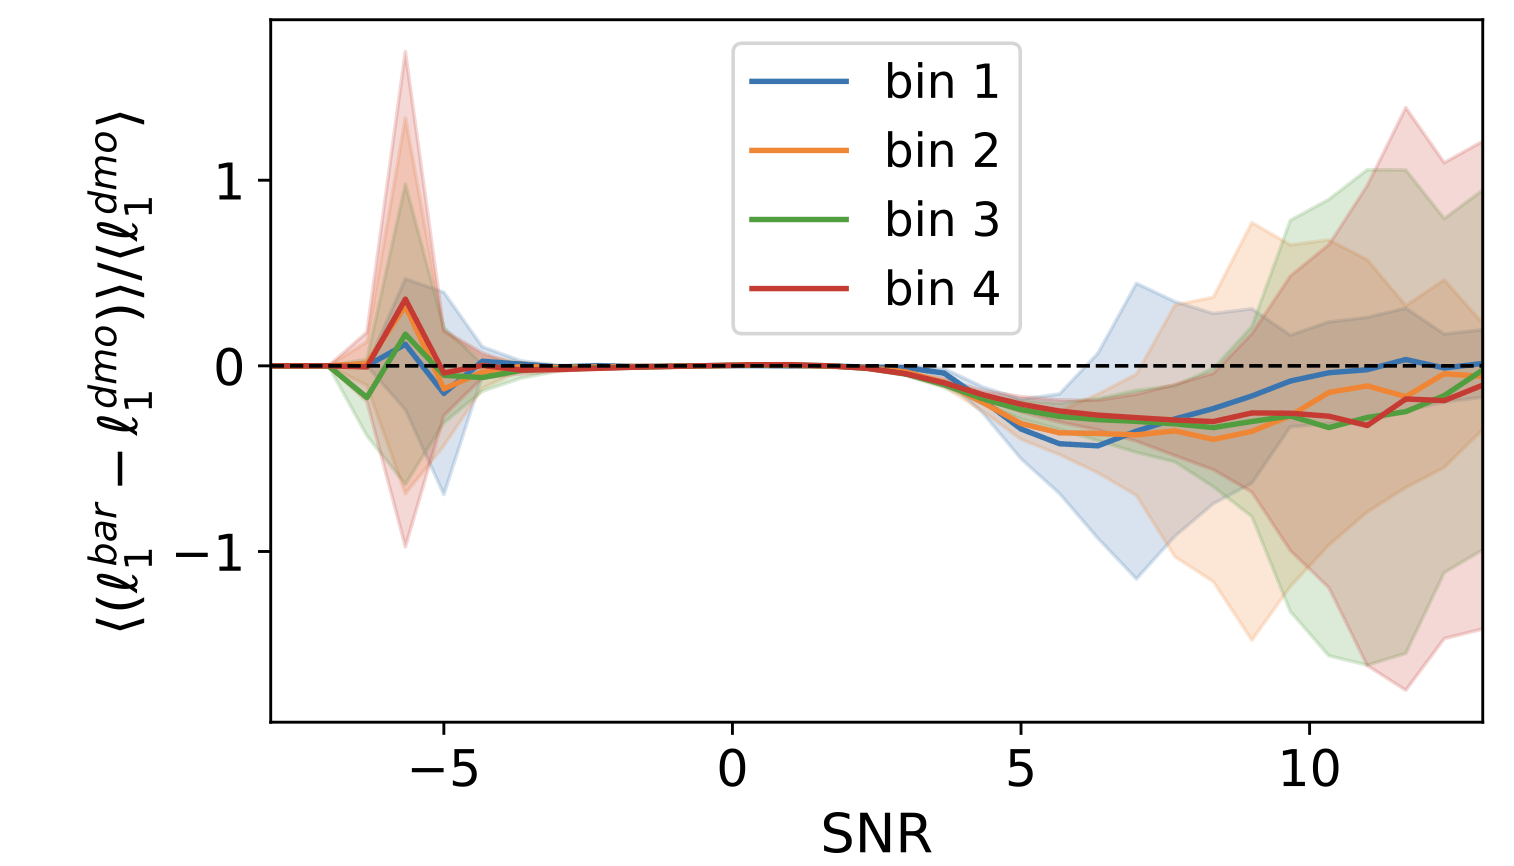
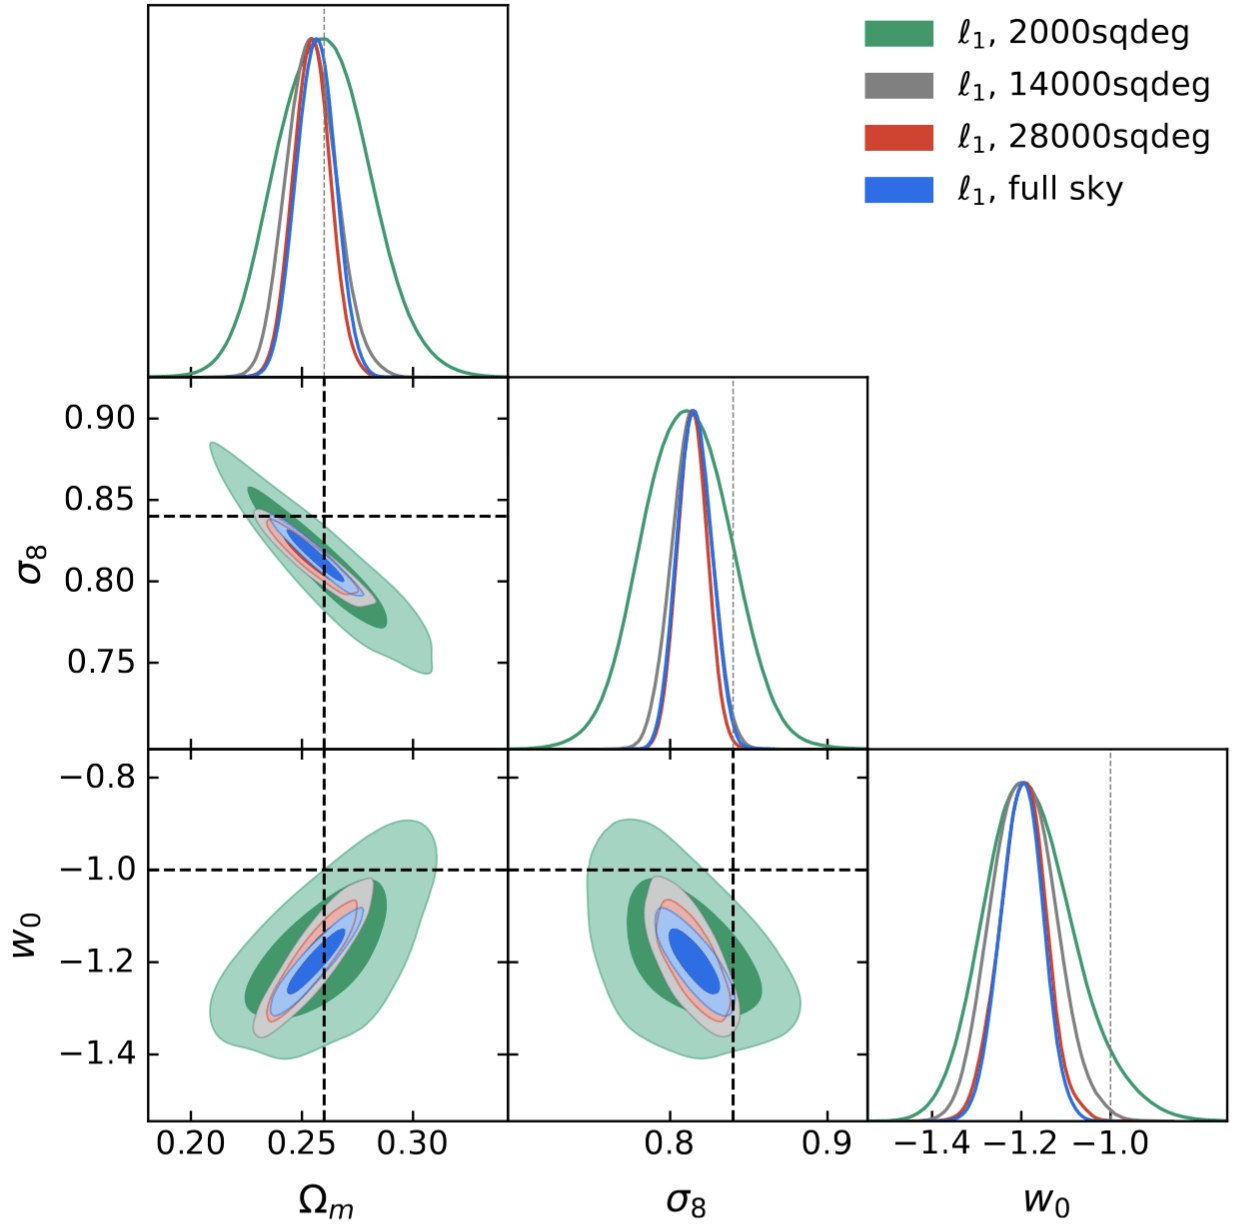
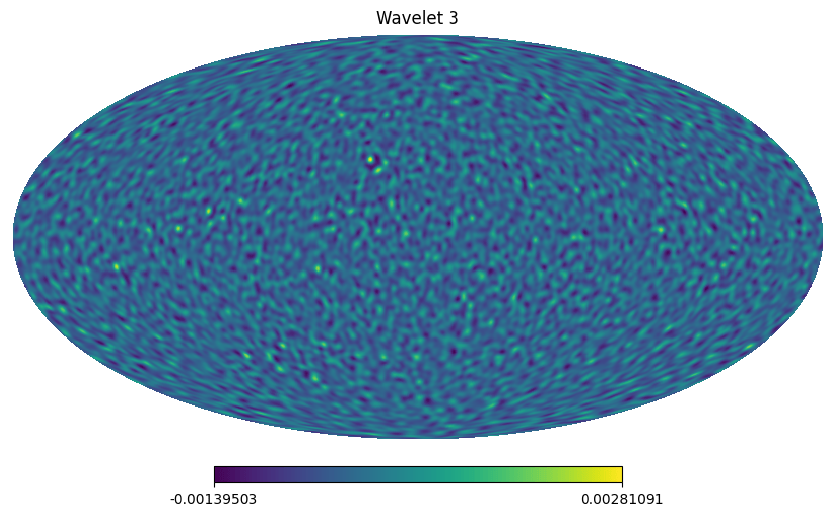
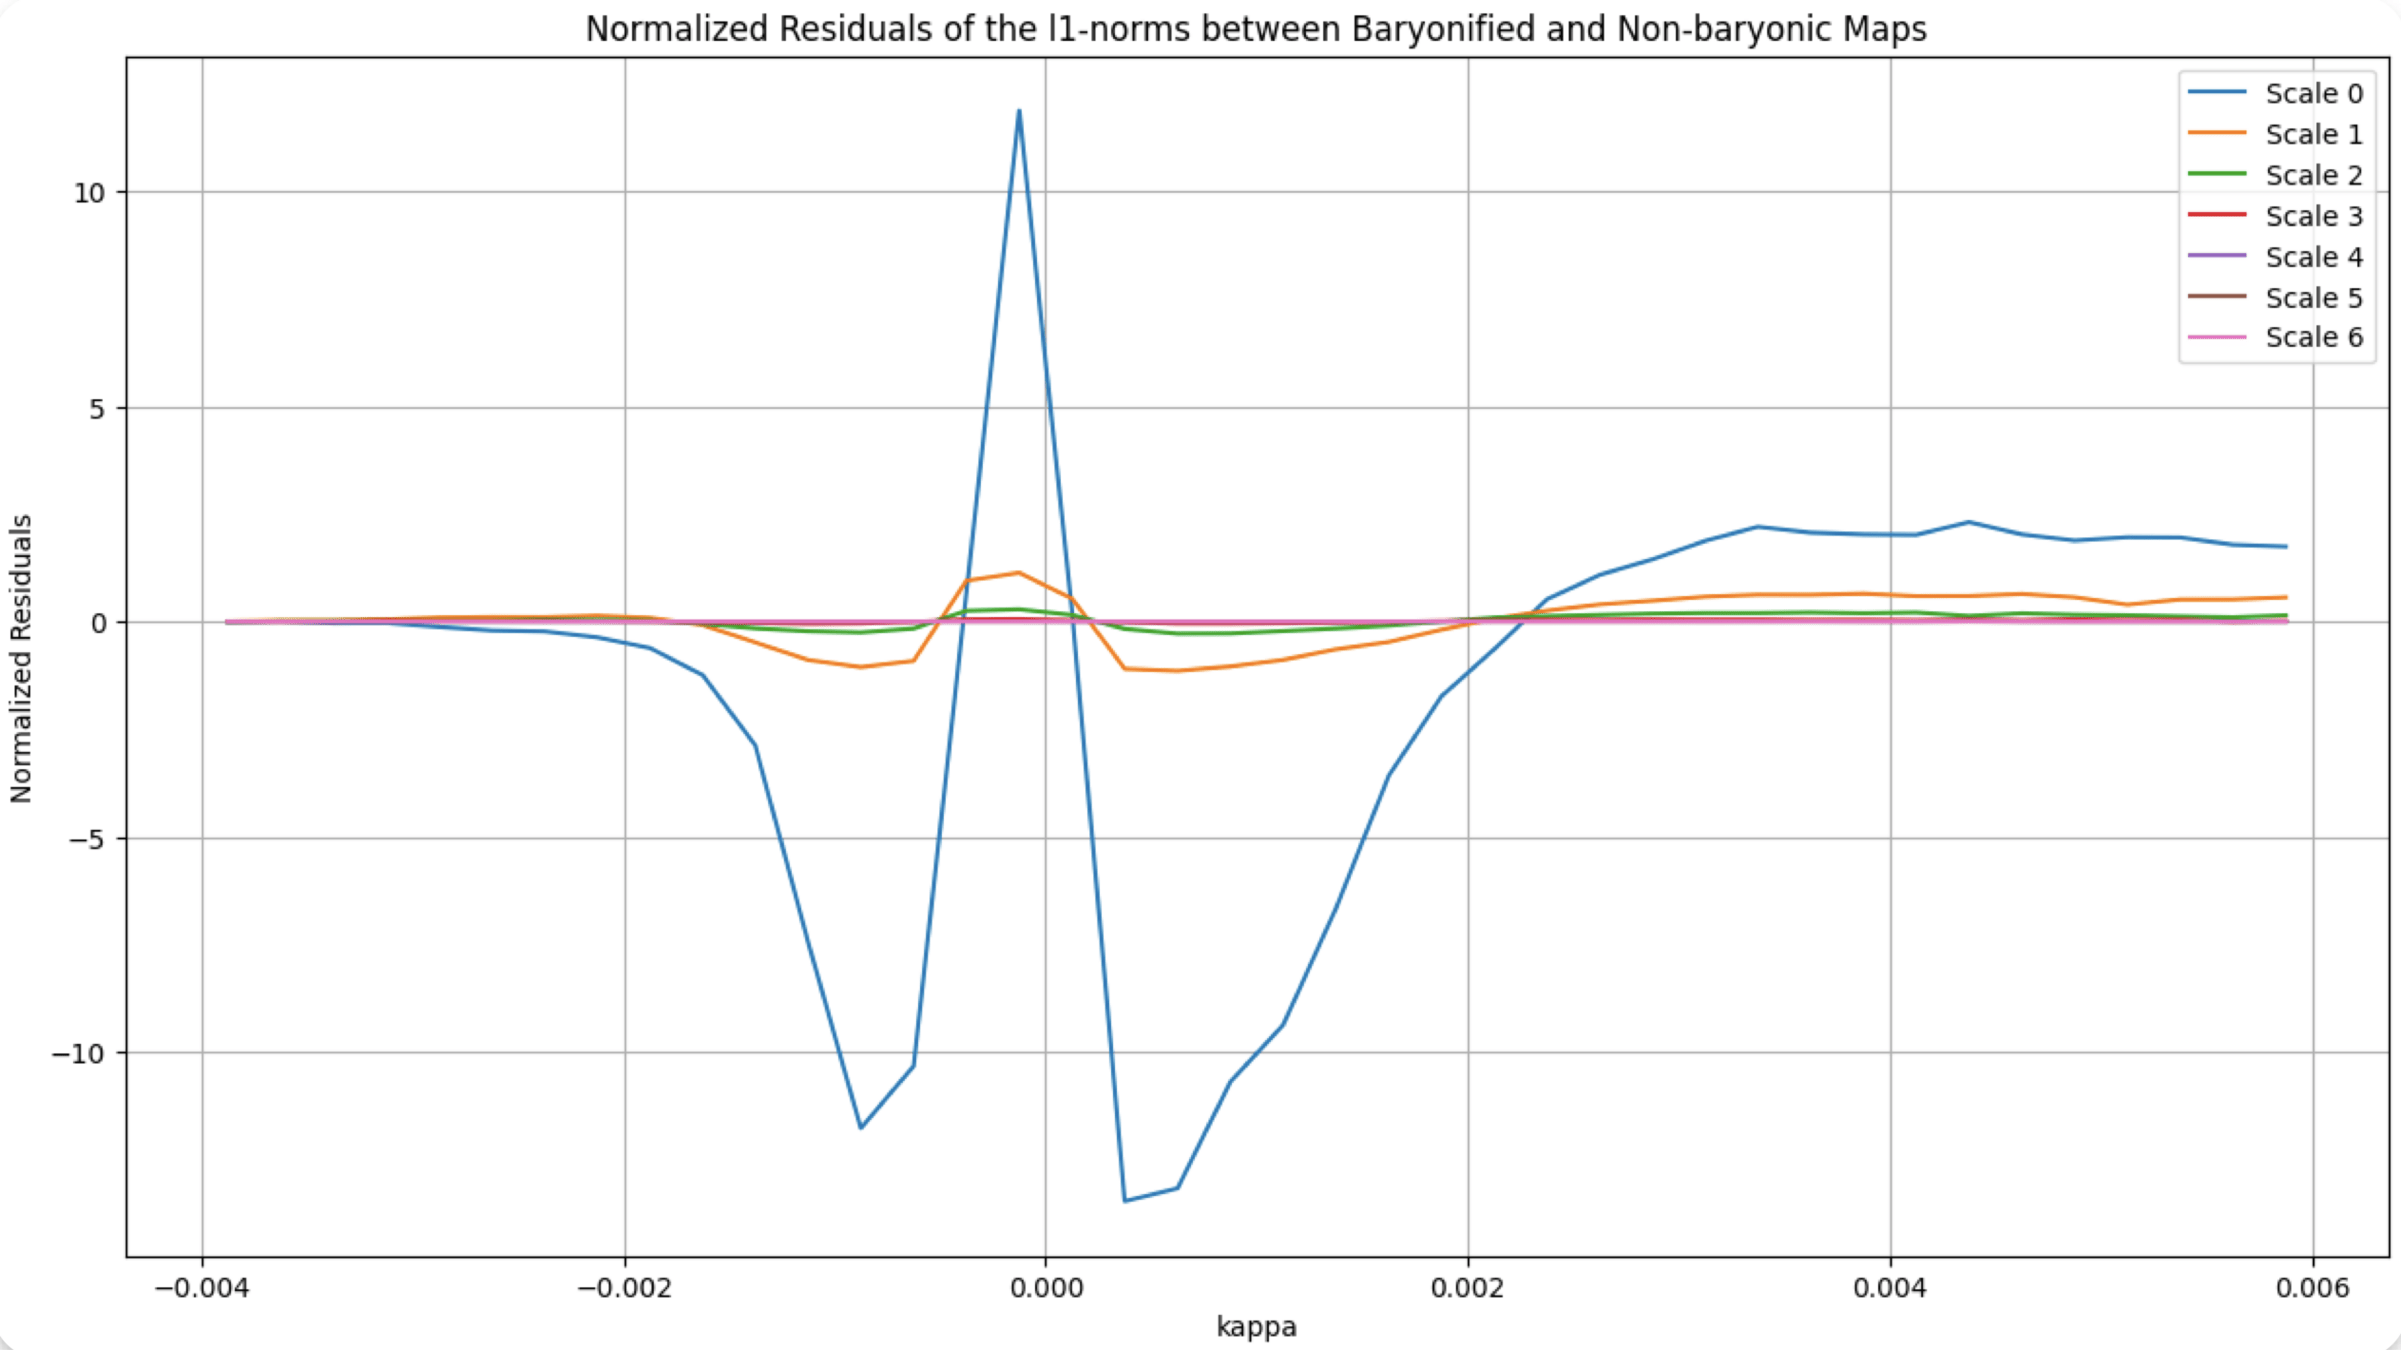
Wavelet l1-norm: sum
of wavelet coefficients
within specific amplitude
ranges across different
wavelet scales
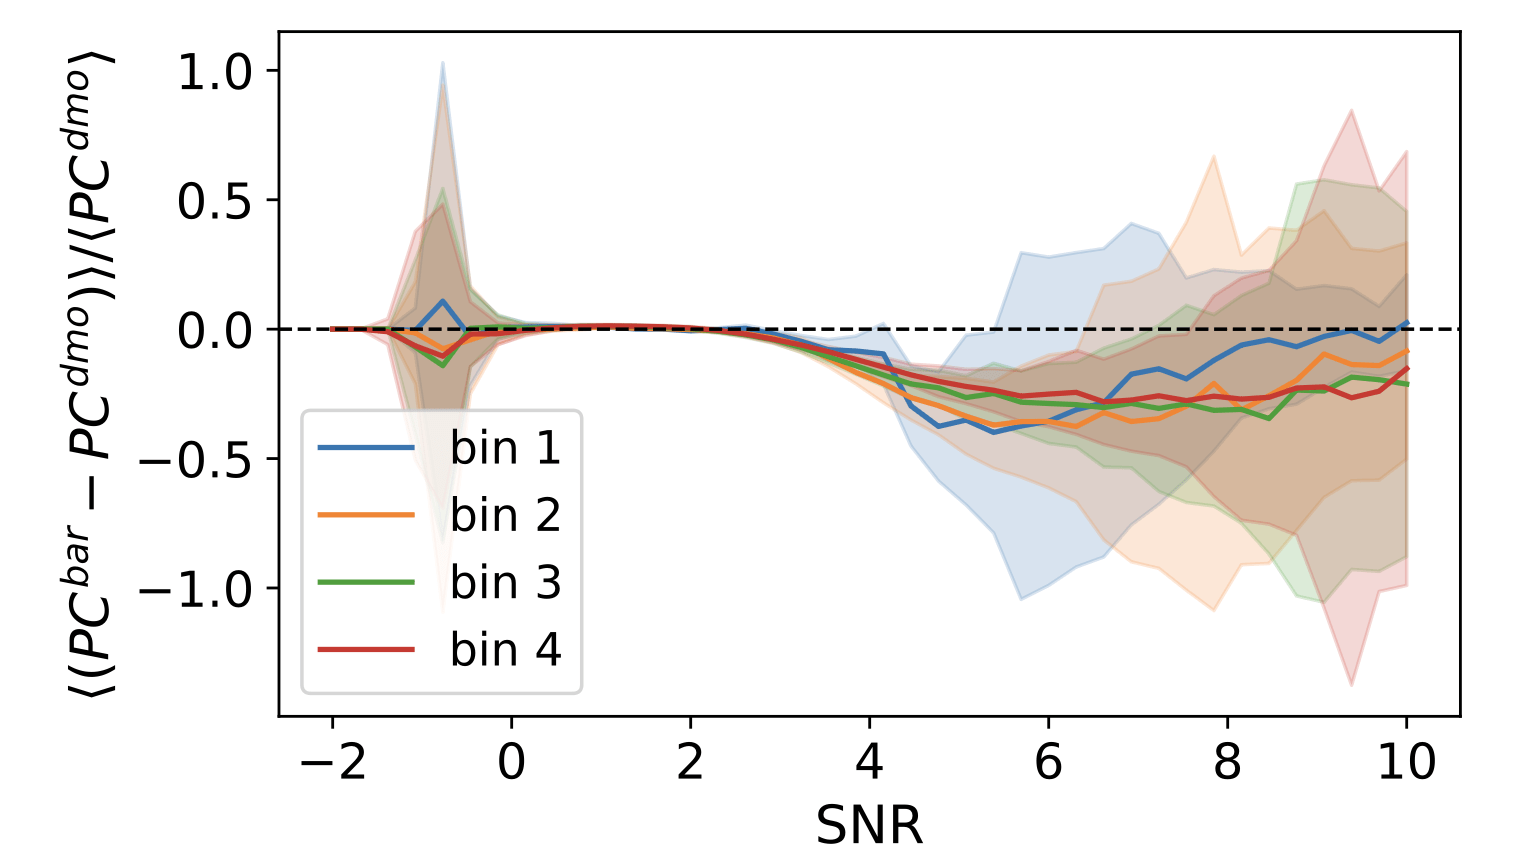
Wavelet peaks: local maxima of wavelet
coefficient maps
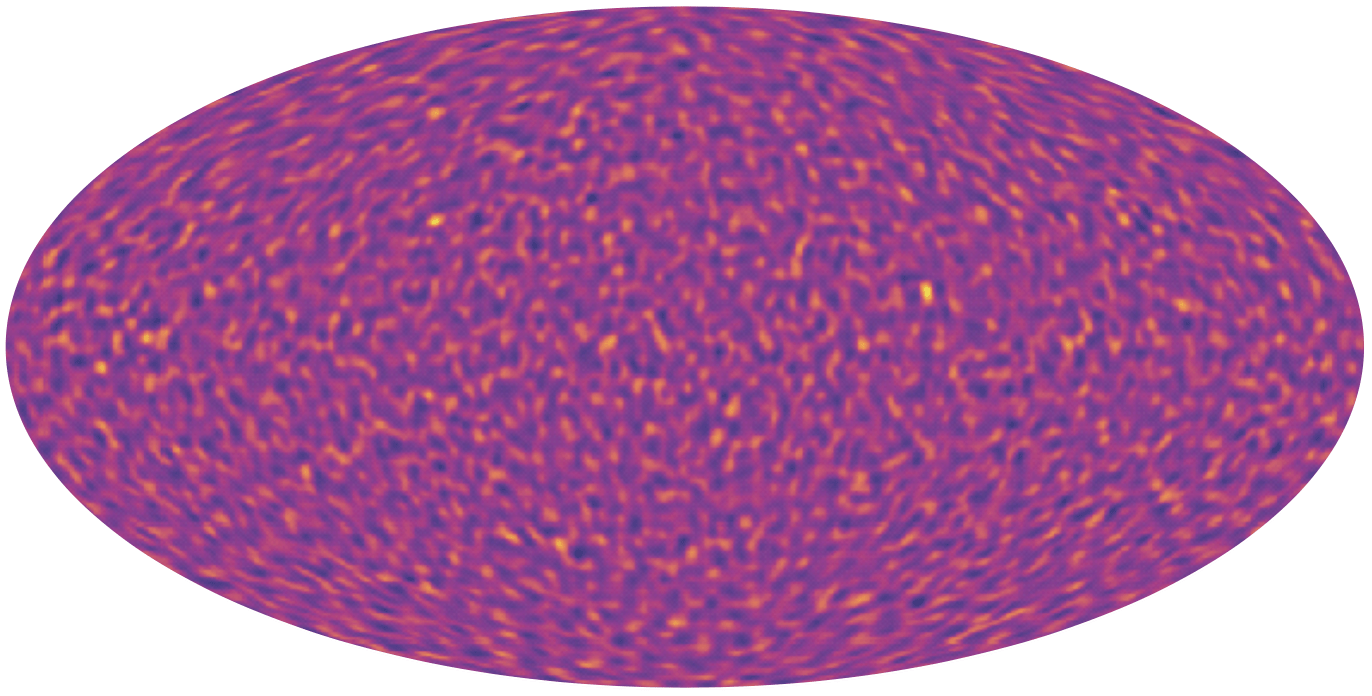
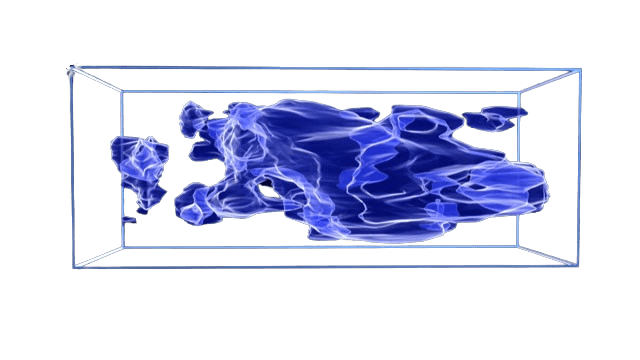
N-body sims, providing DMO & baryonified full-sky κ-maps.
Baryonic effects are incorporated using a shell-based Baryon Correction Model.
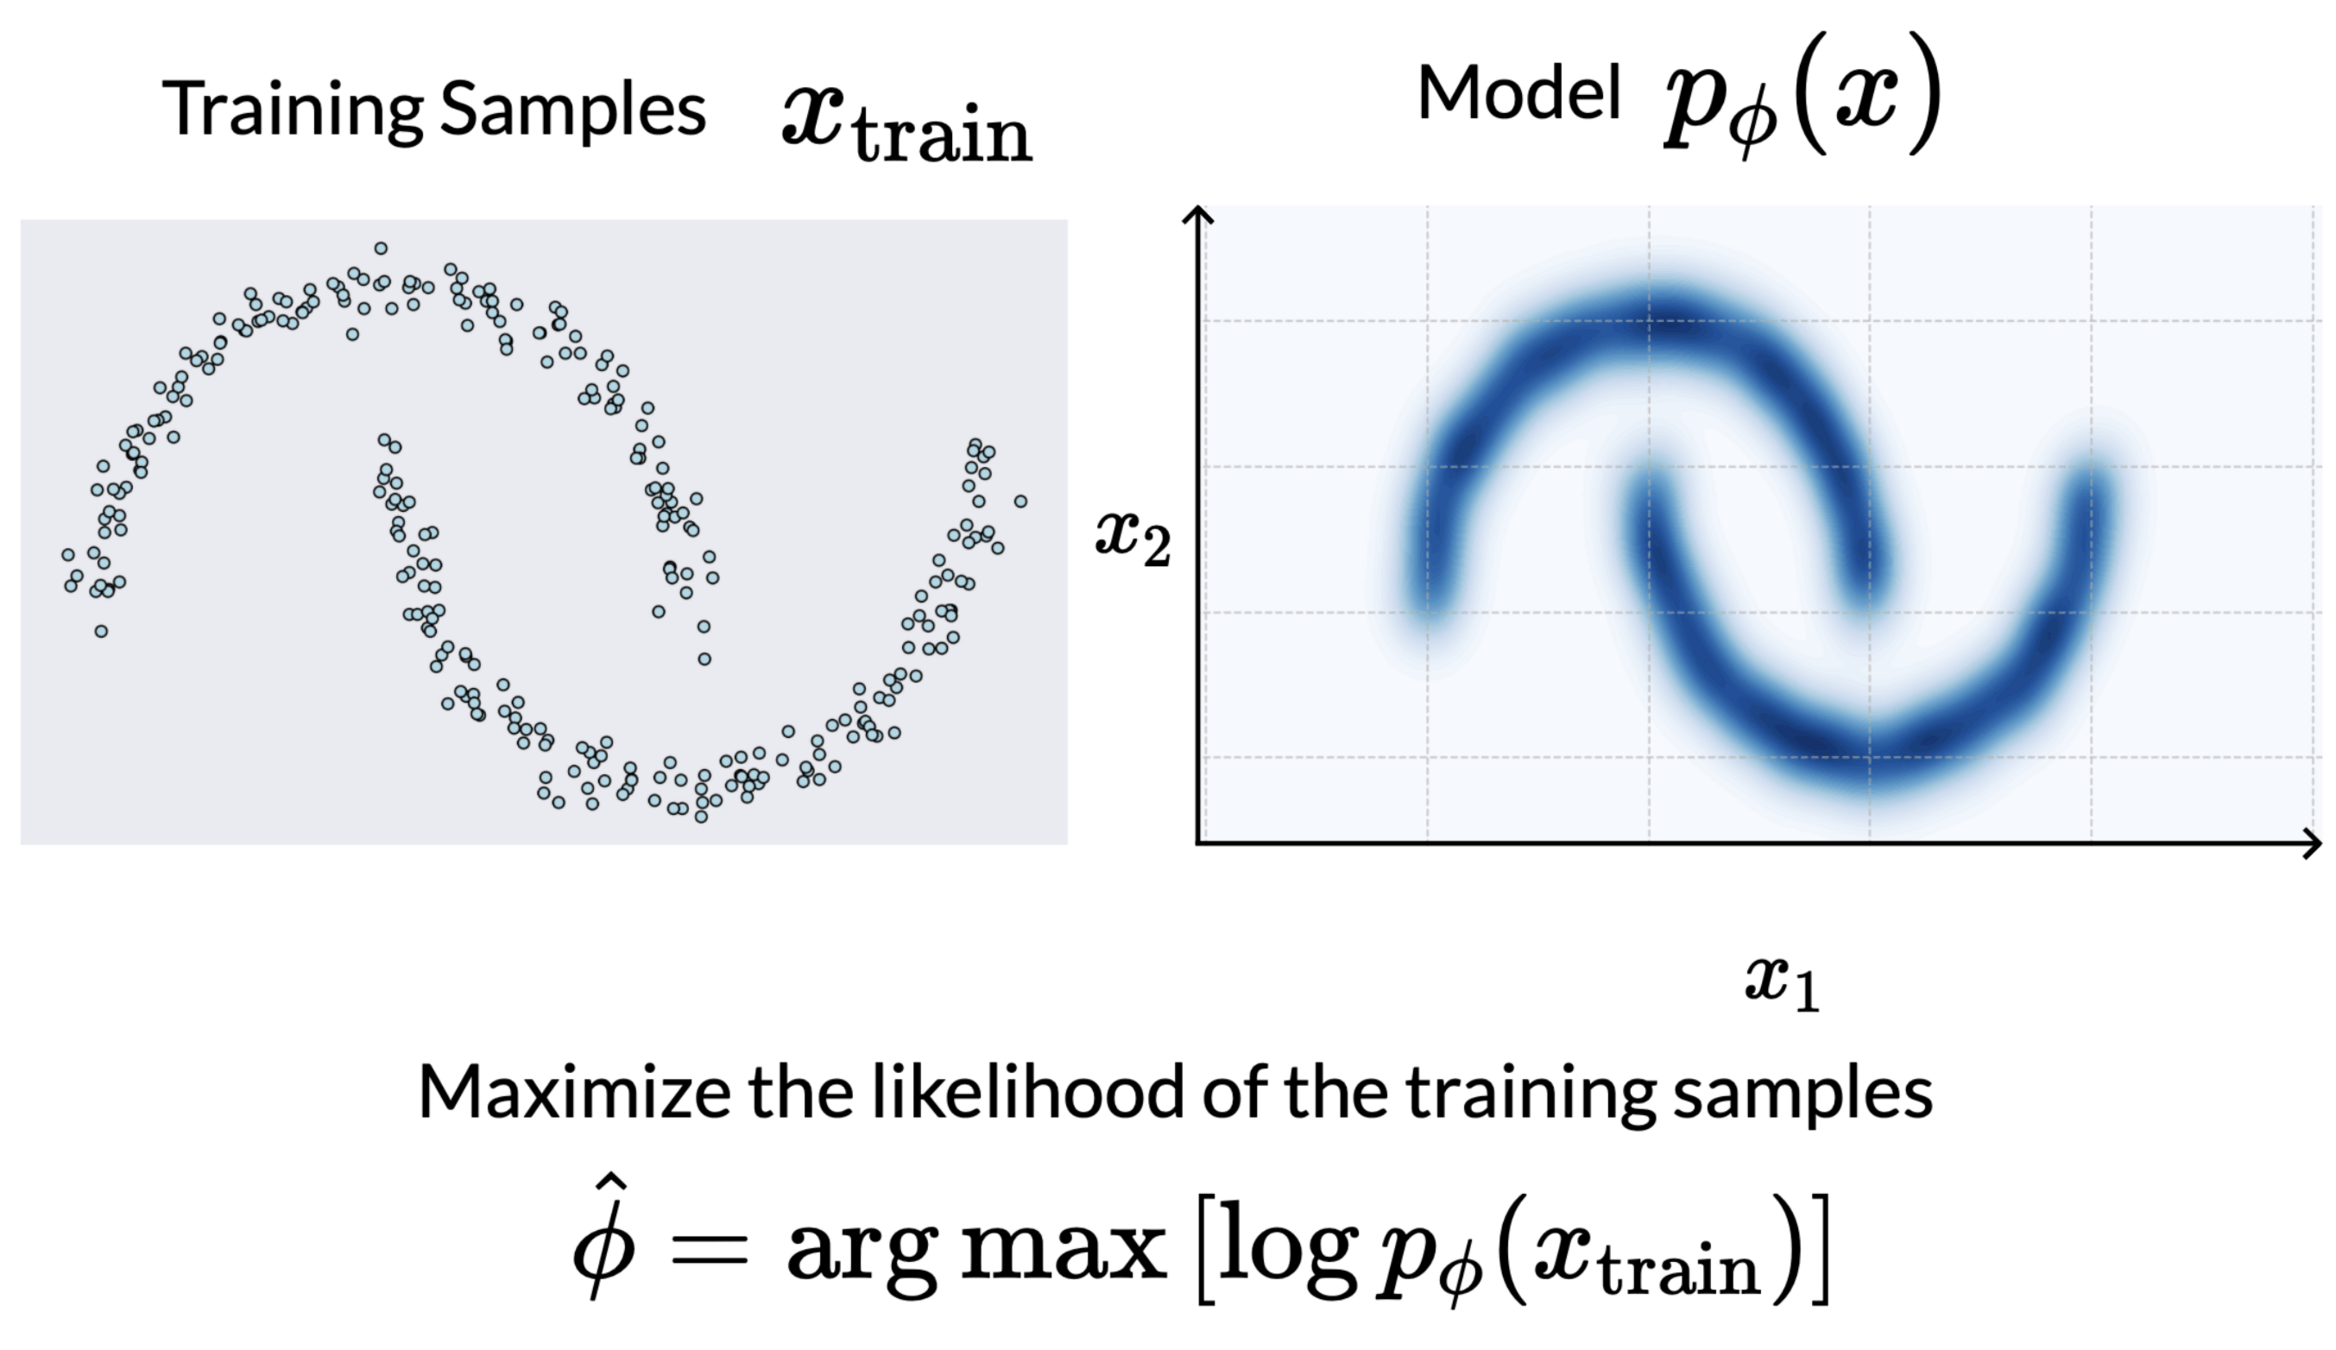
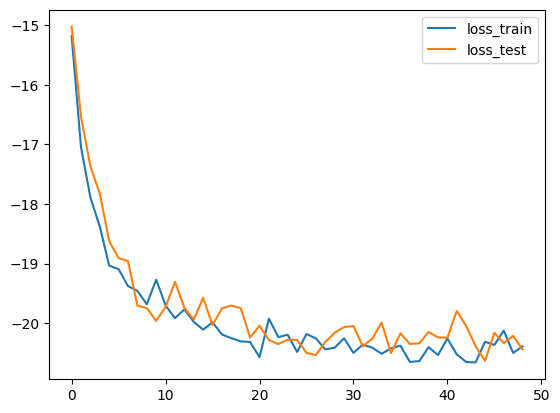
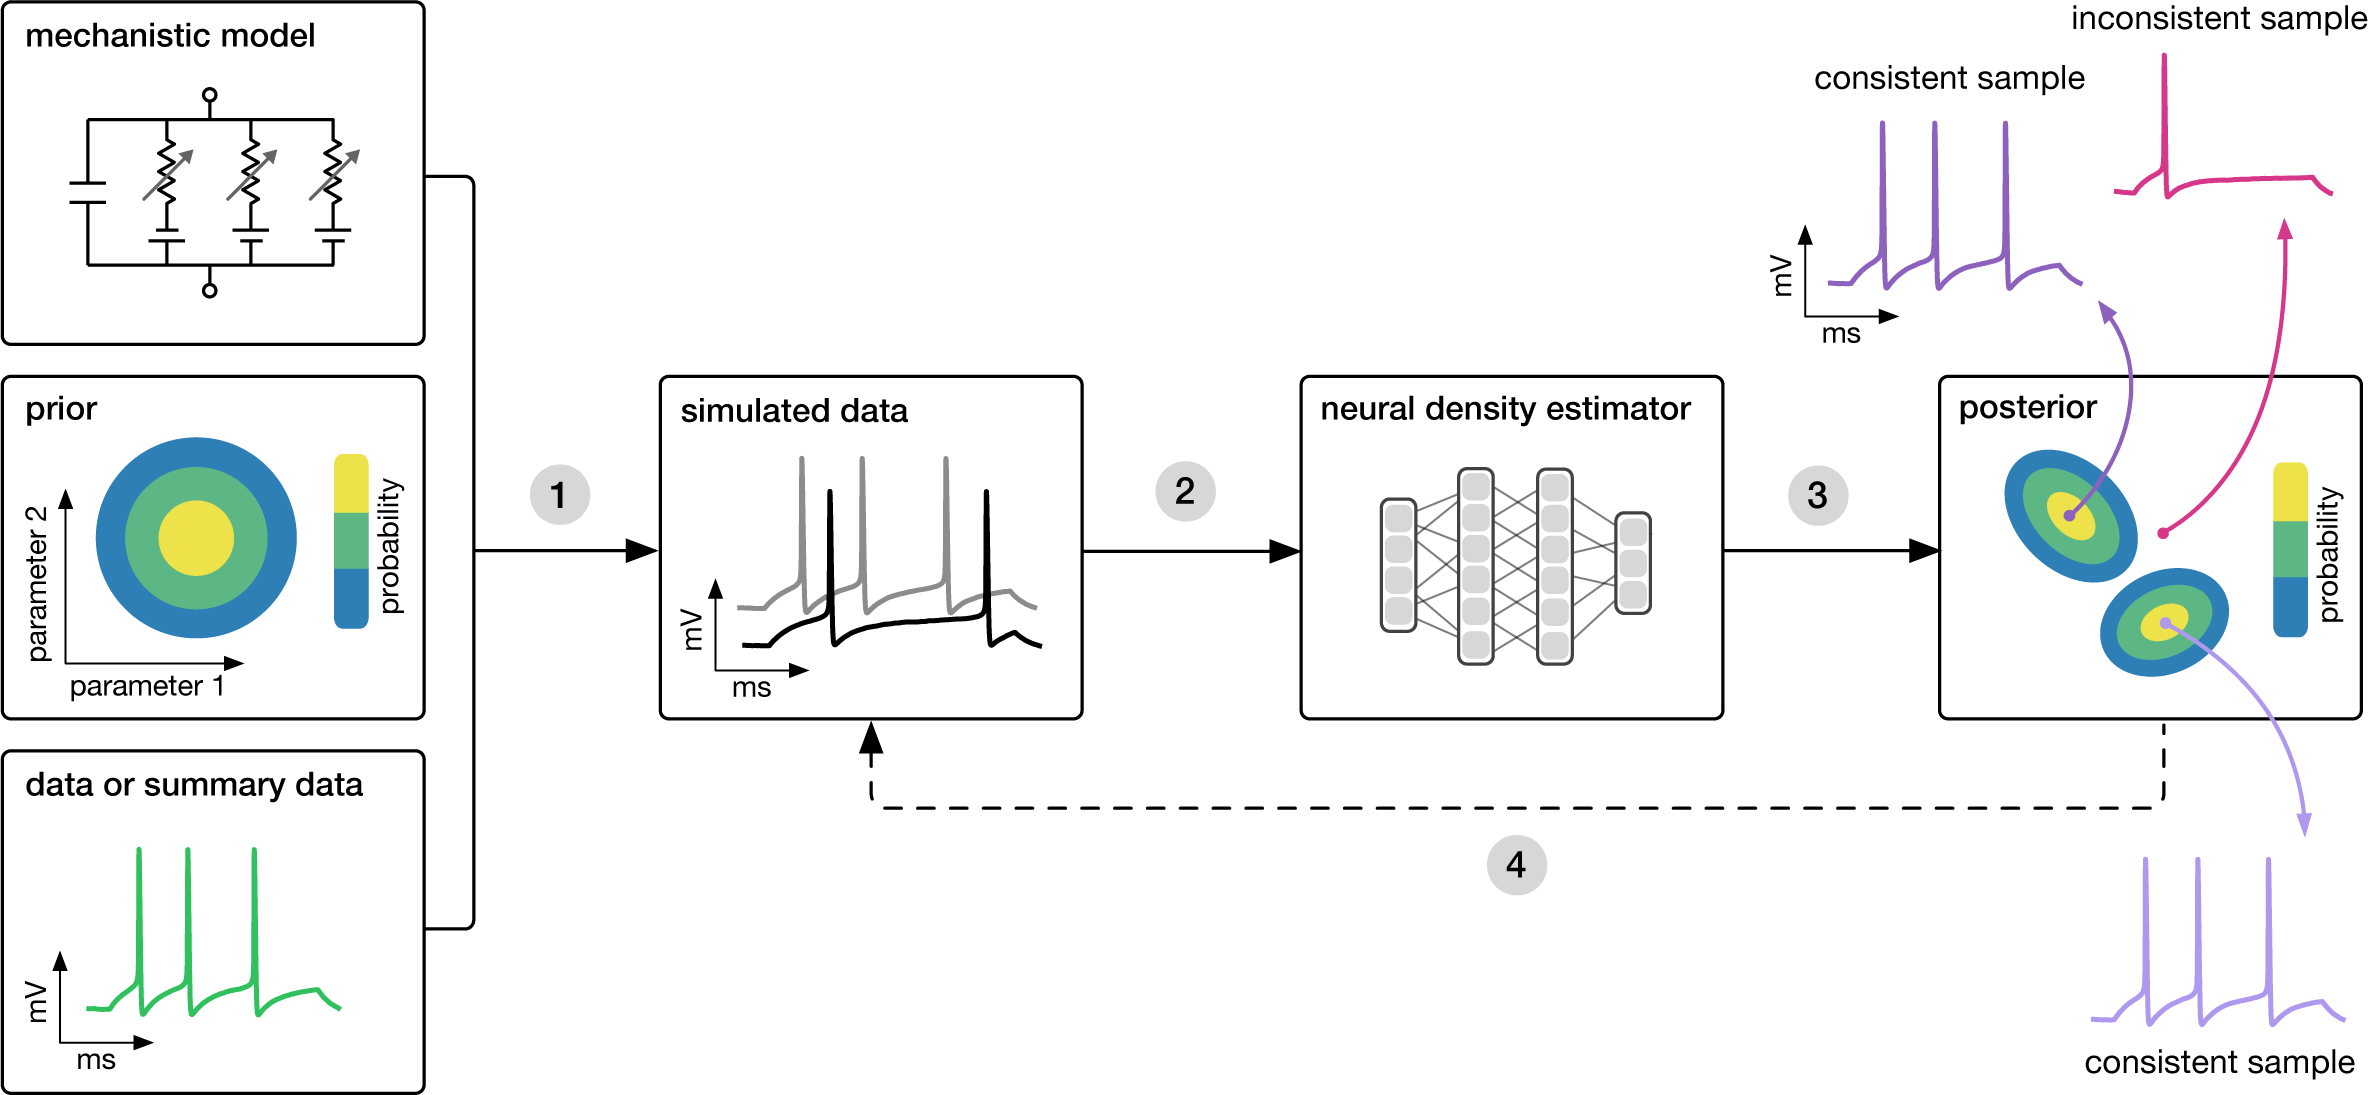
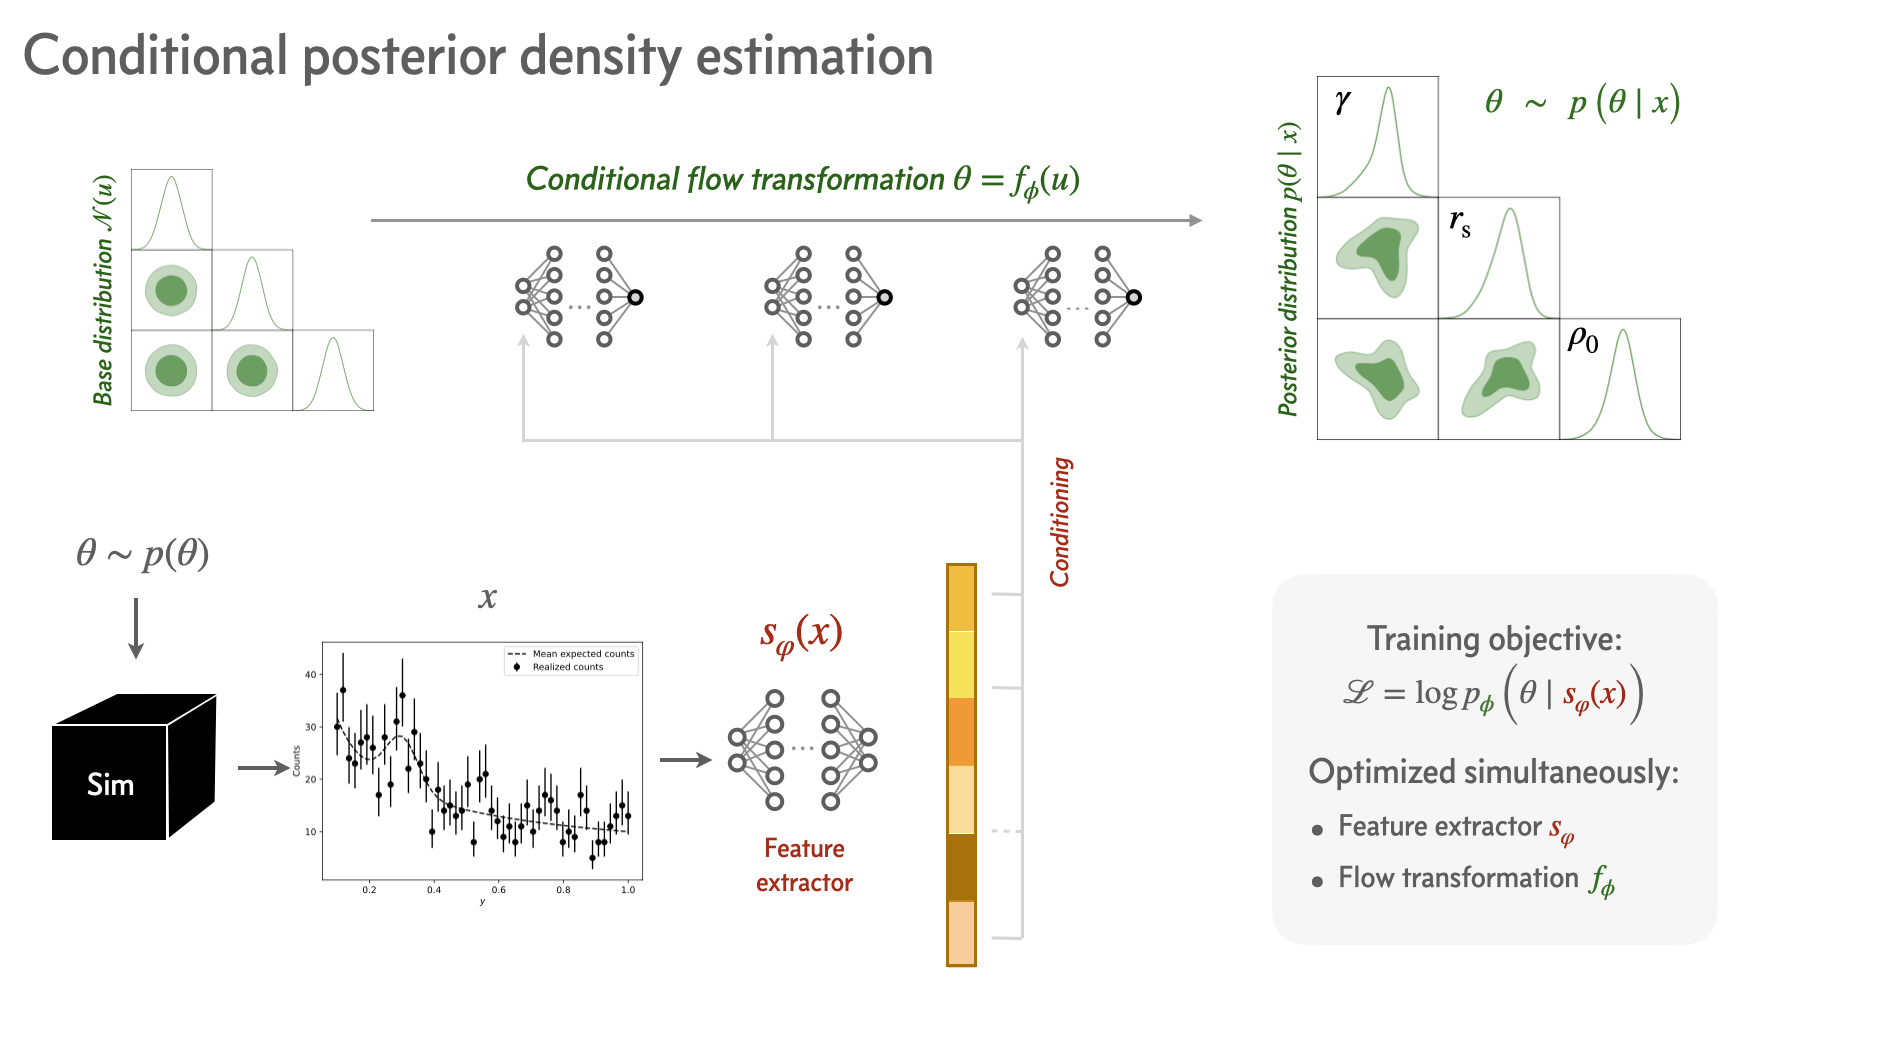
Density Estimation
Normalizing Flows (NF) are based on mapping functions
Those functions enable us to map a latent variable z∼pz(z) to a variable x∼px(x).
We can approximate distributions with NFs by learning this function
(discretize the problem into learning the parameters of a series of bijections)
Normalizing Flows for Density Estimation
Inference method: SBI
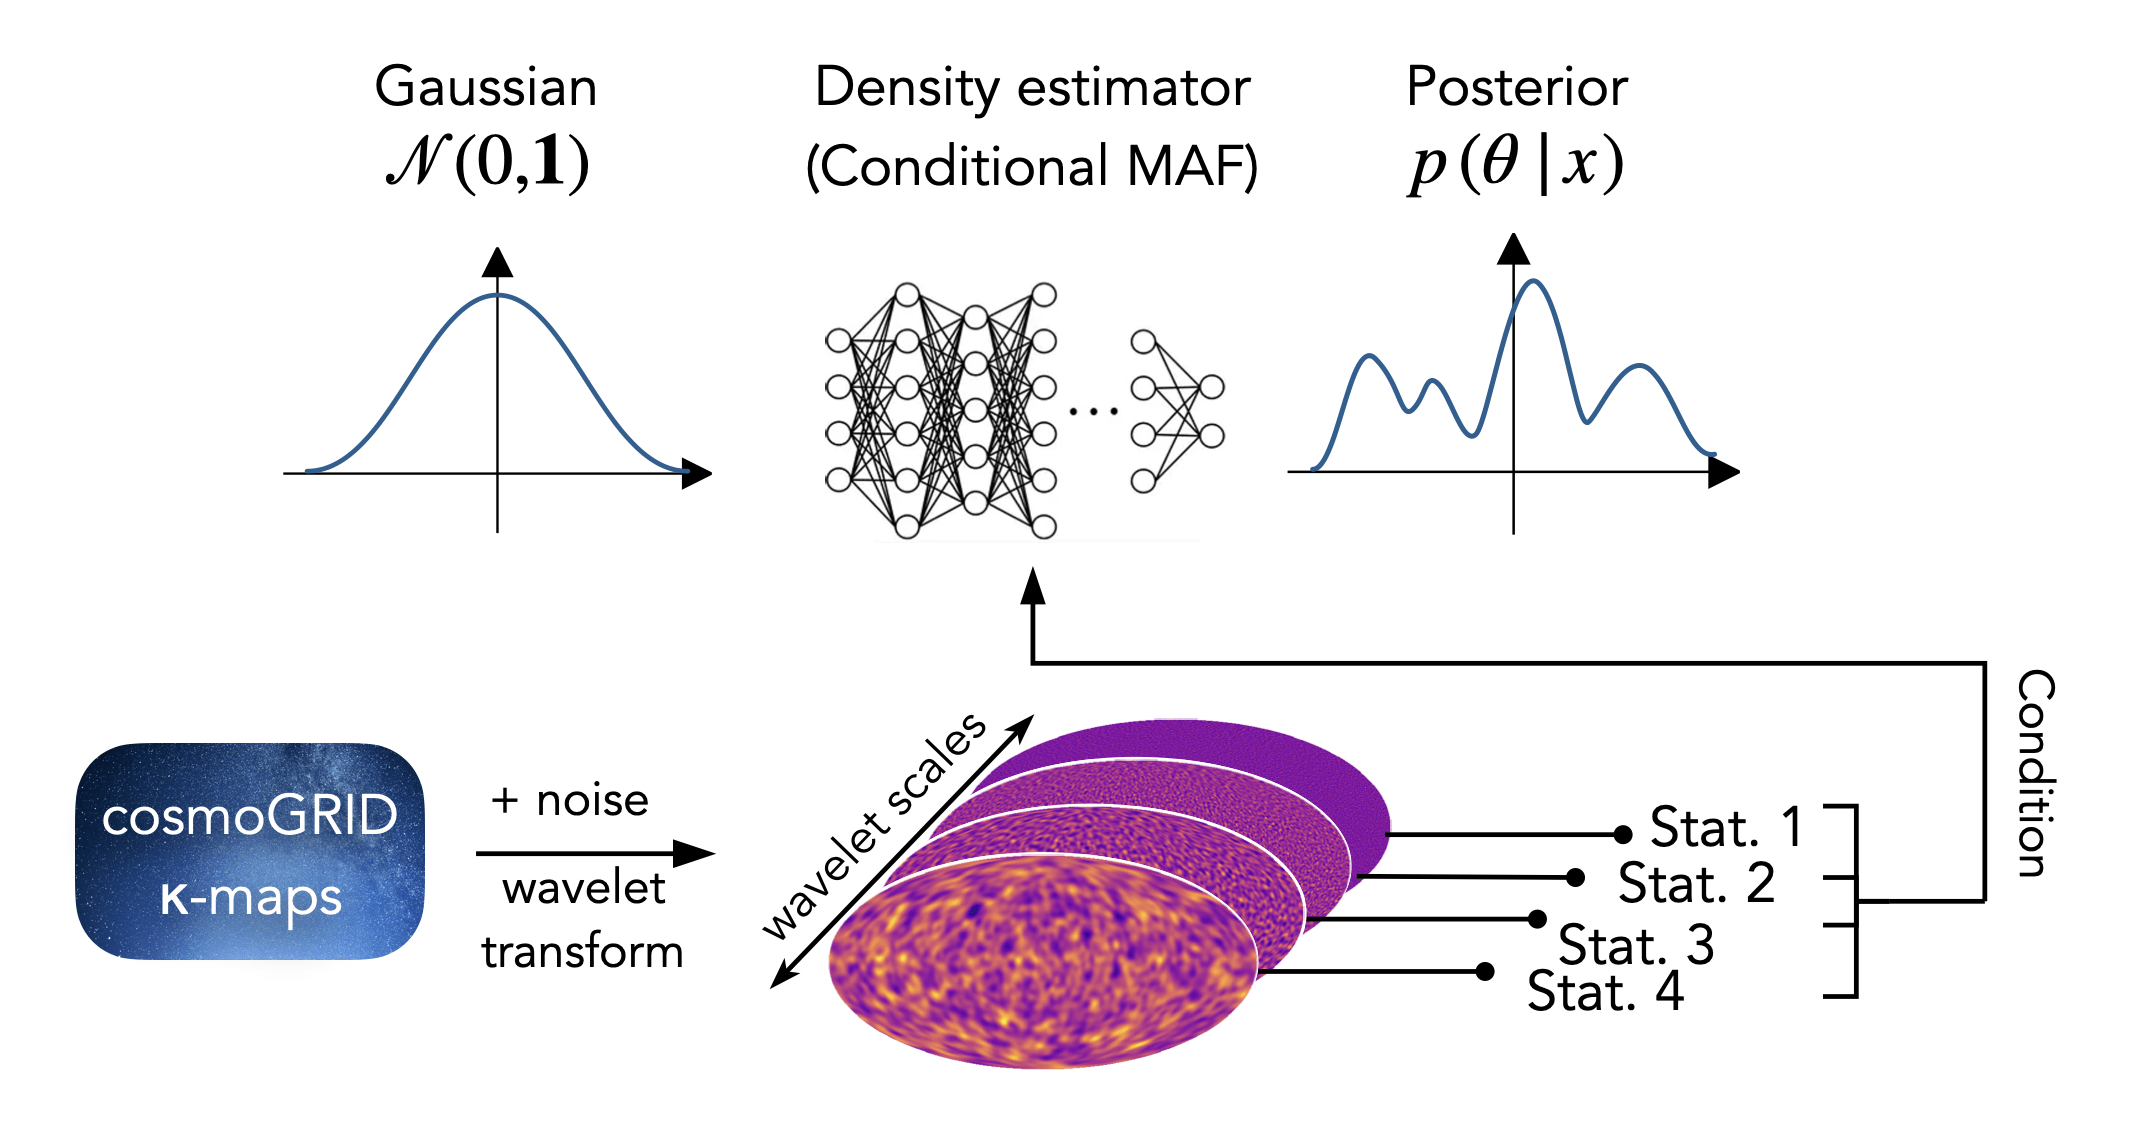
Training objective
*

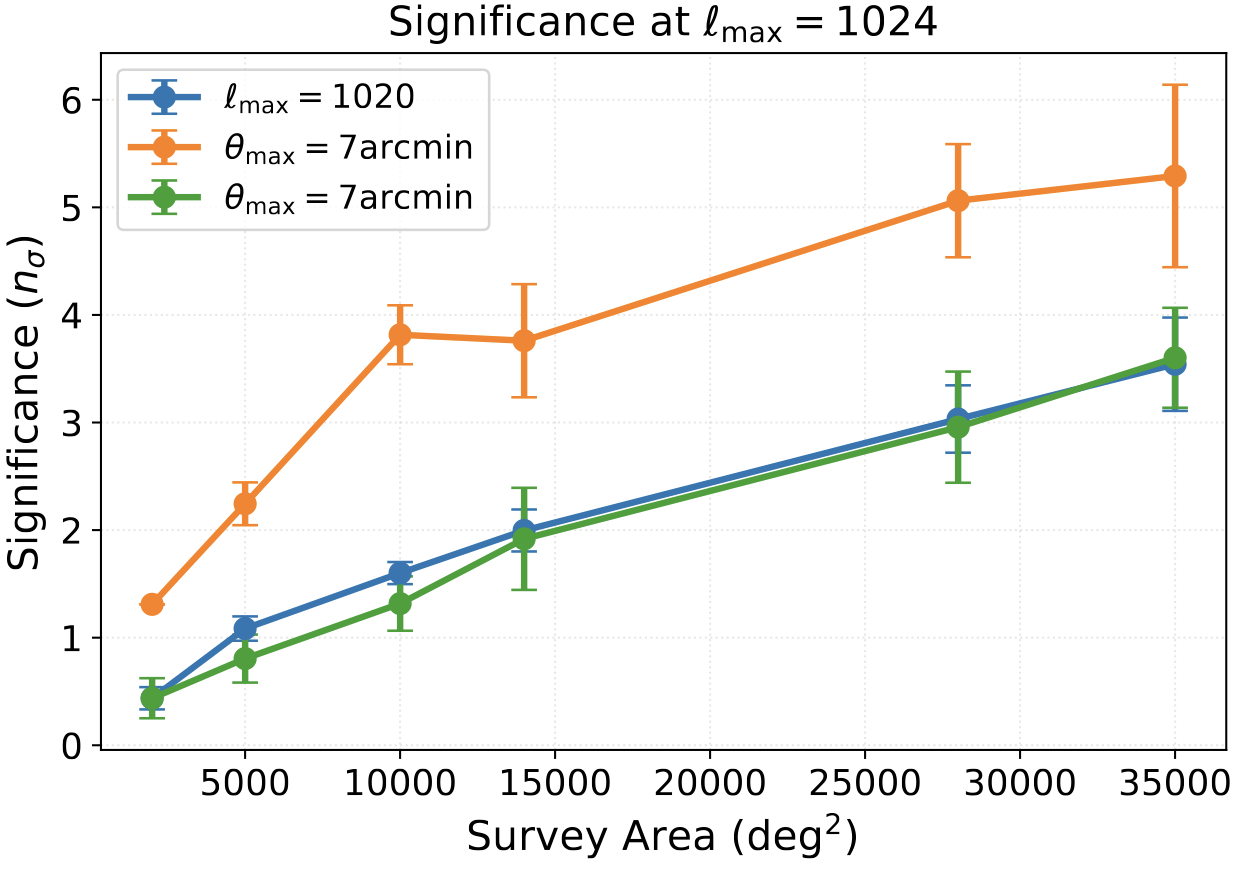
The Scaling of Baryonic Bias with Survey Area
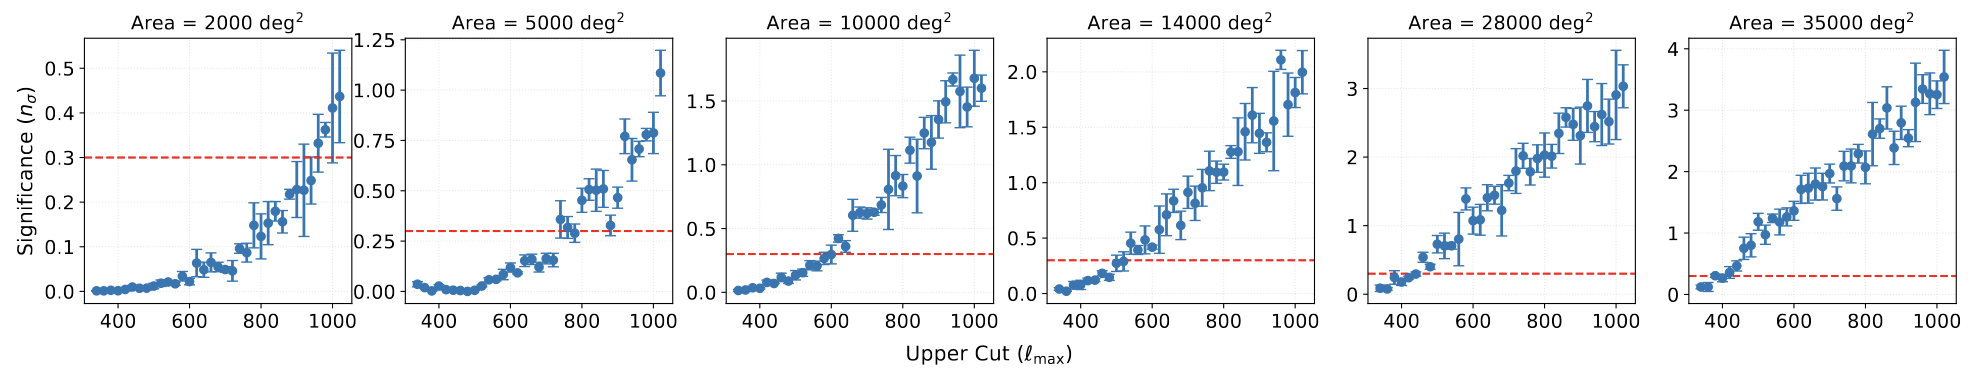
Determining Robust Scale Cuts
Information Content at Large Scales
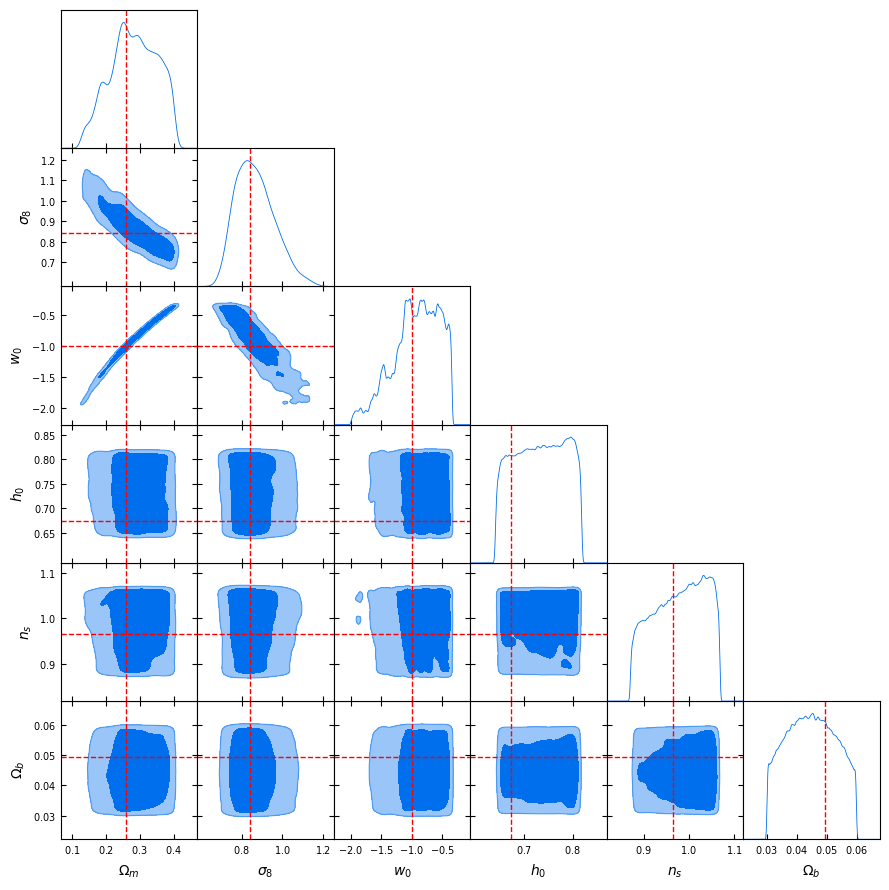
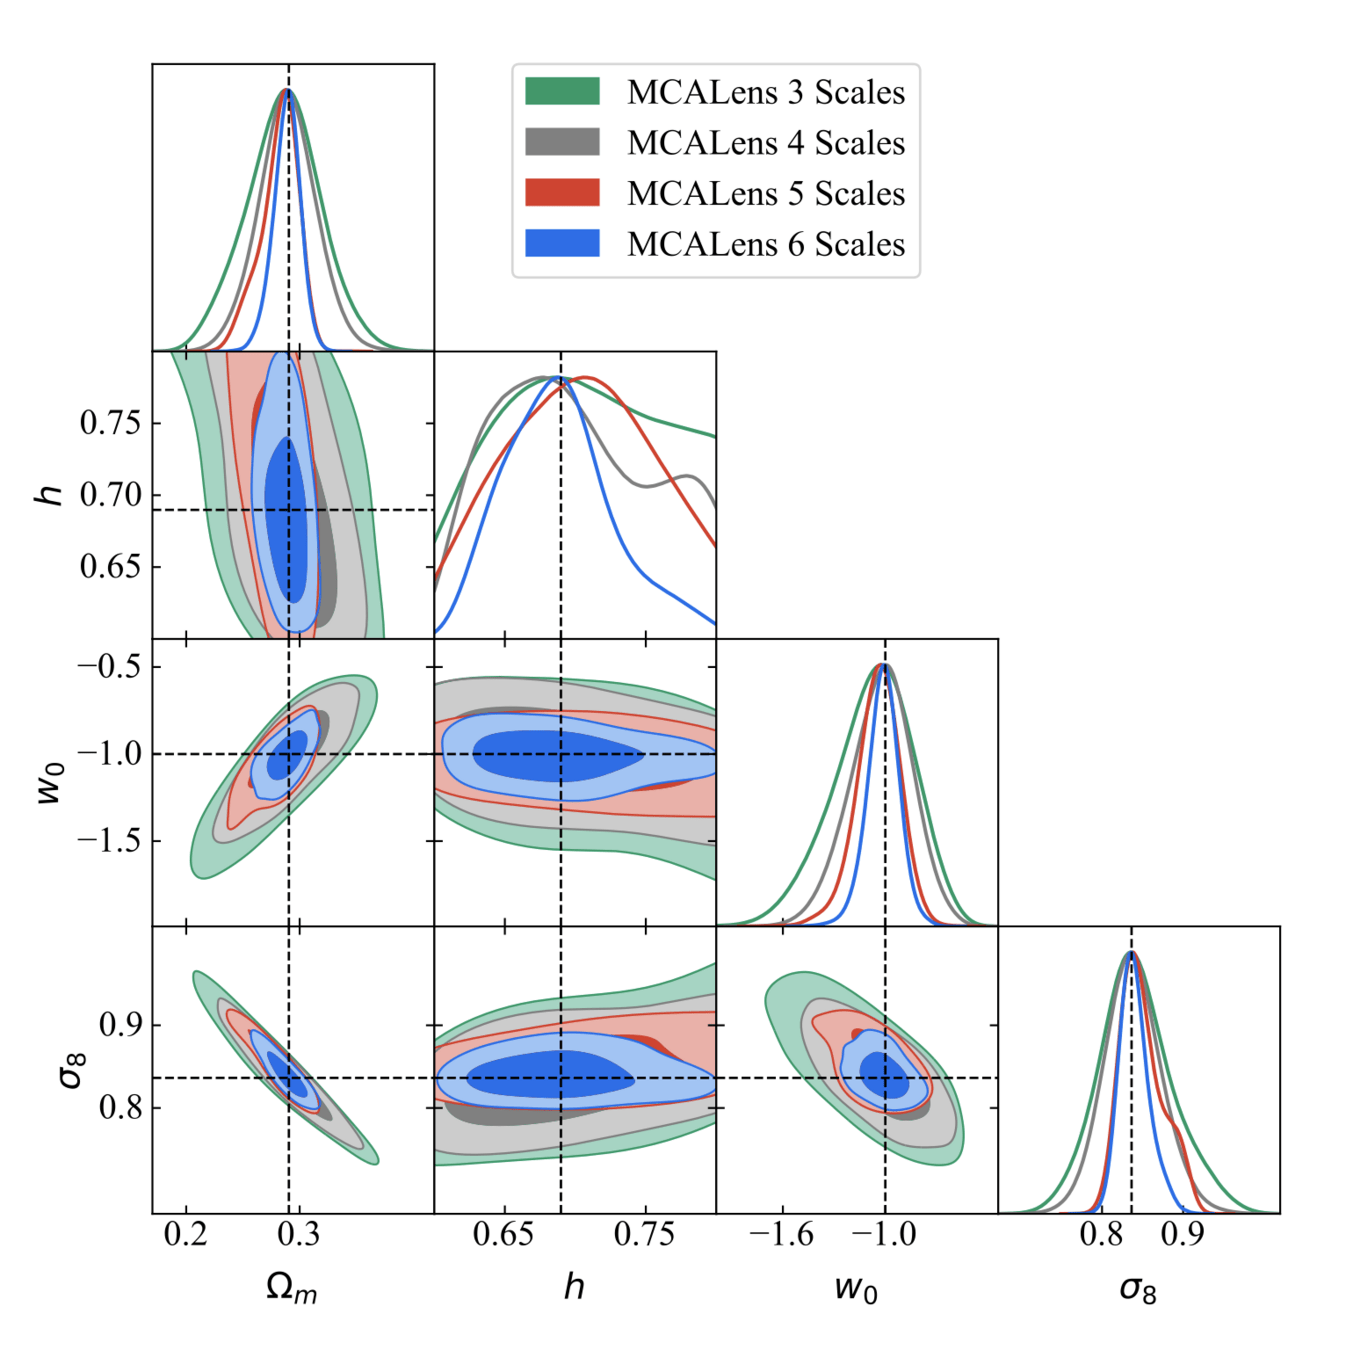
Results
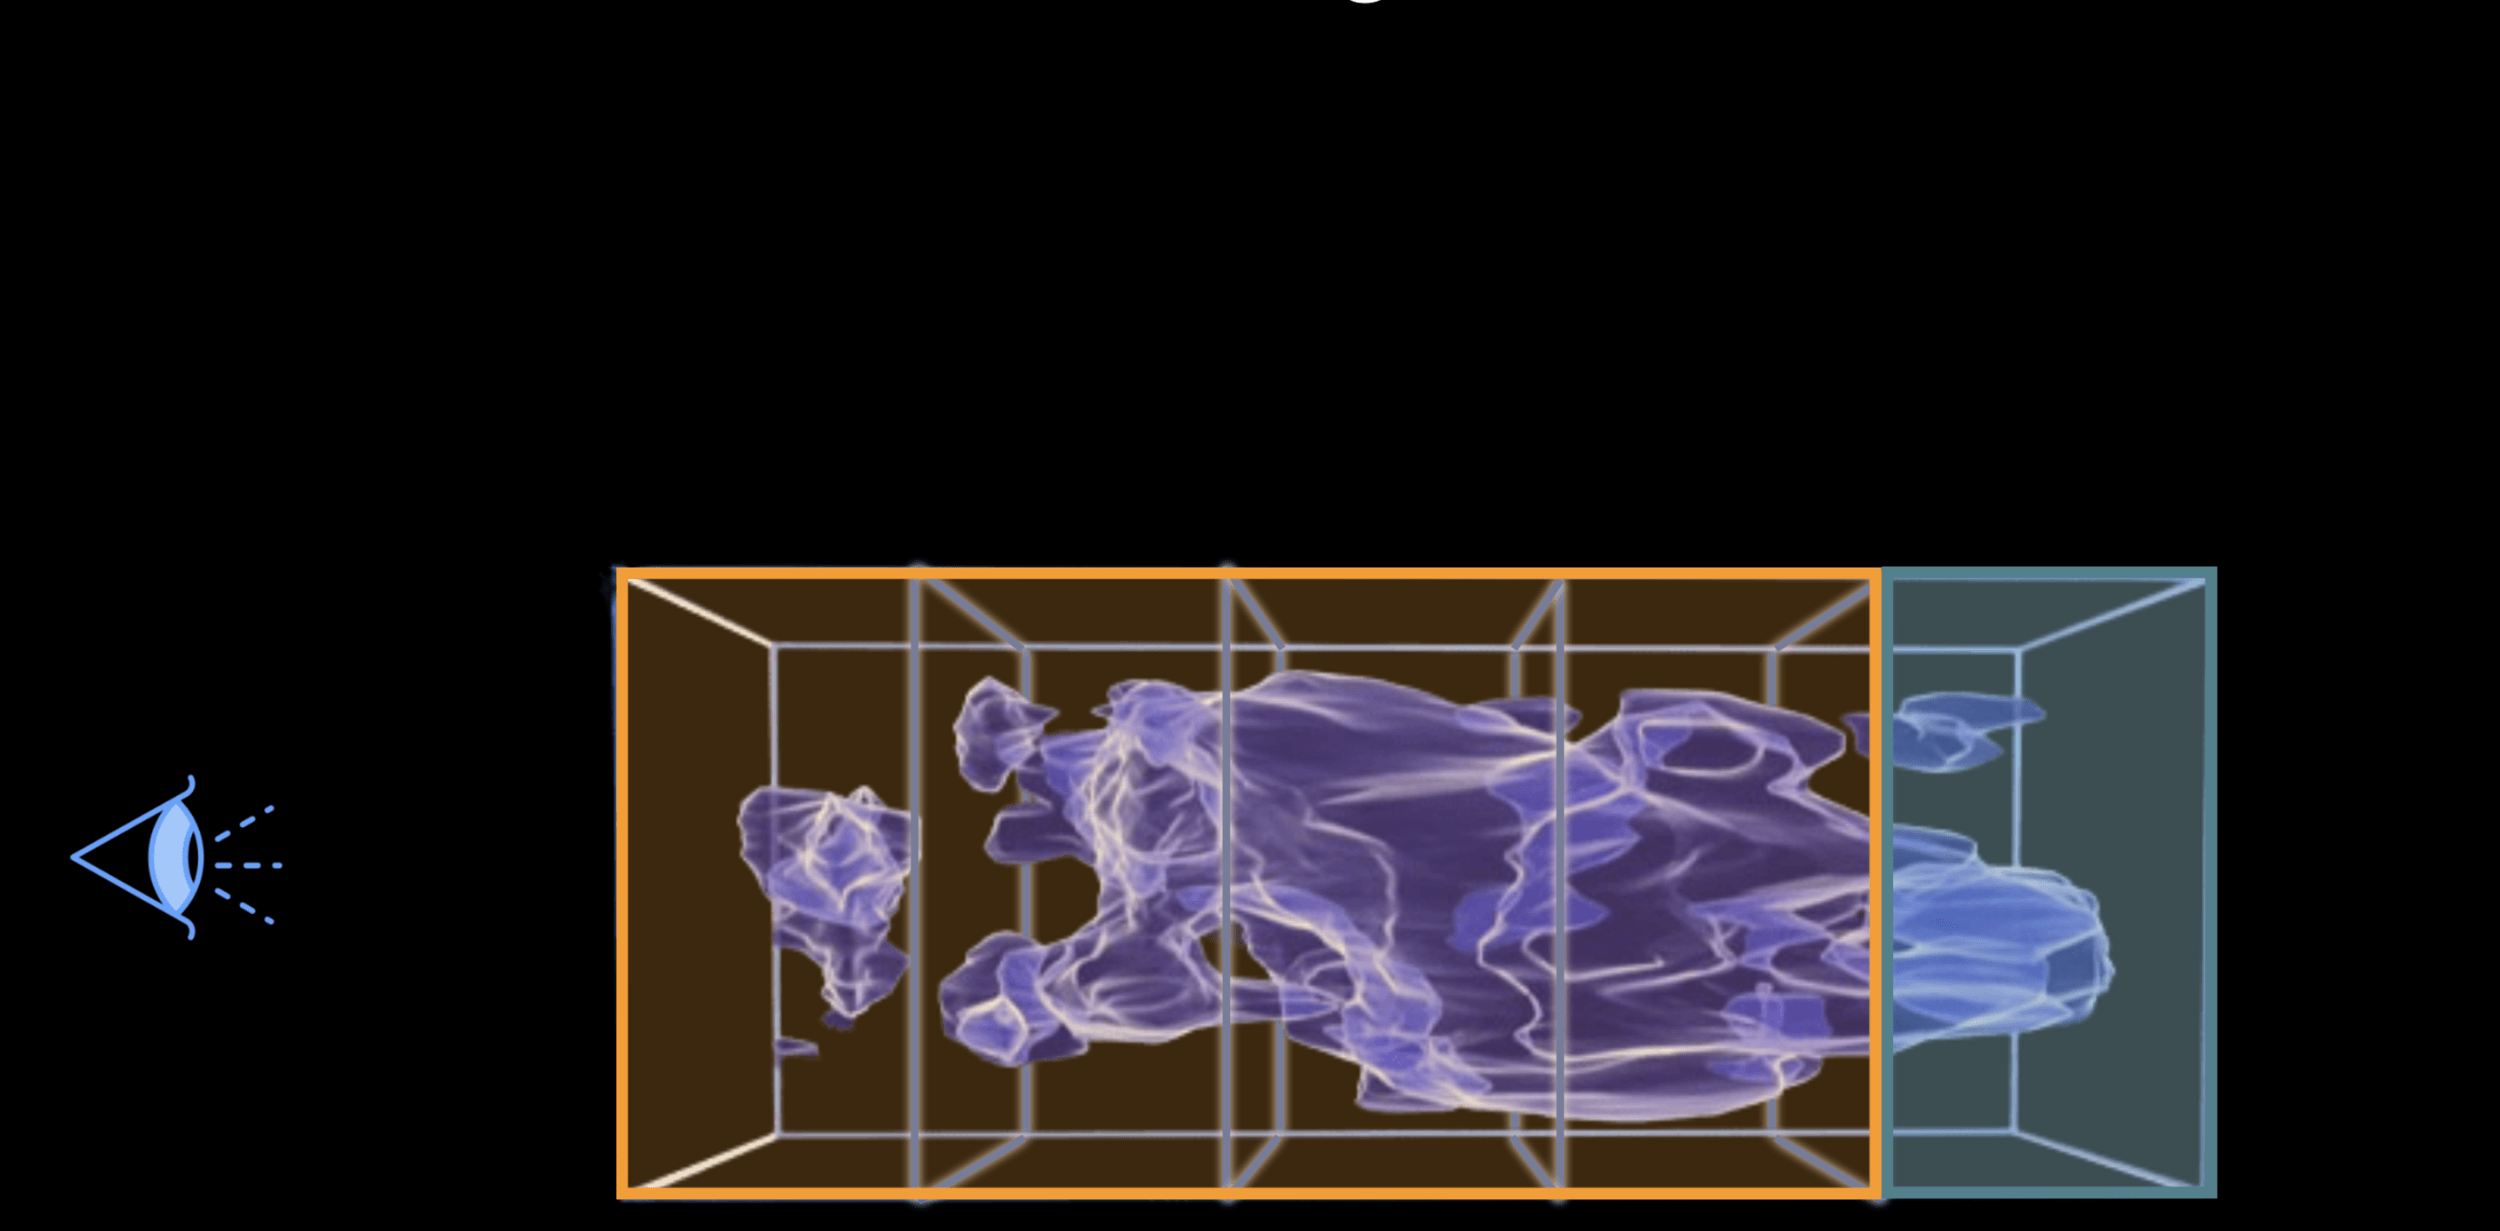
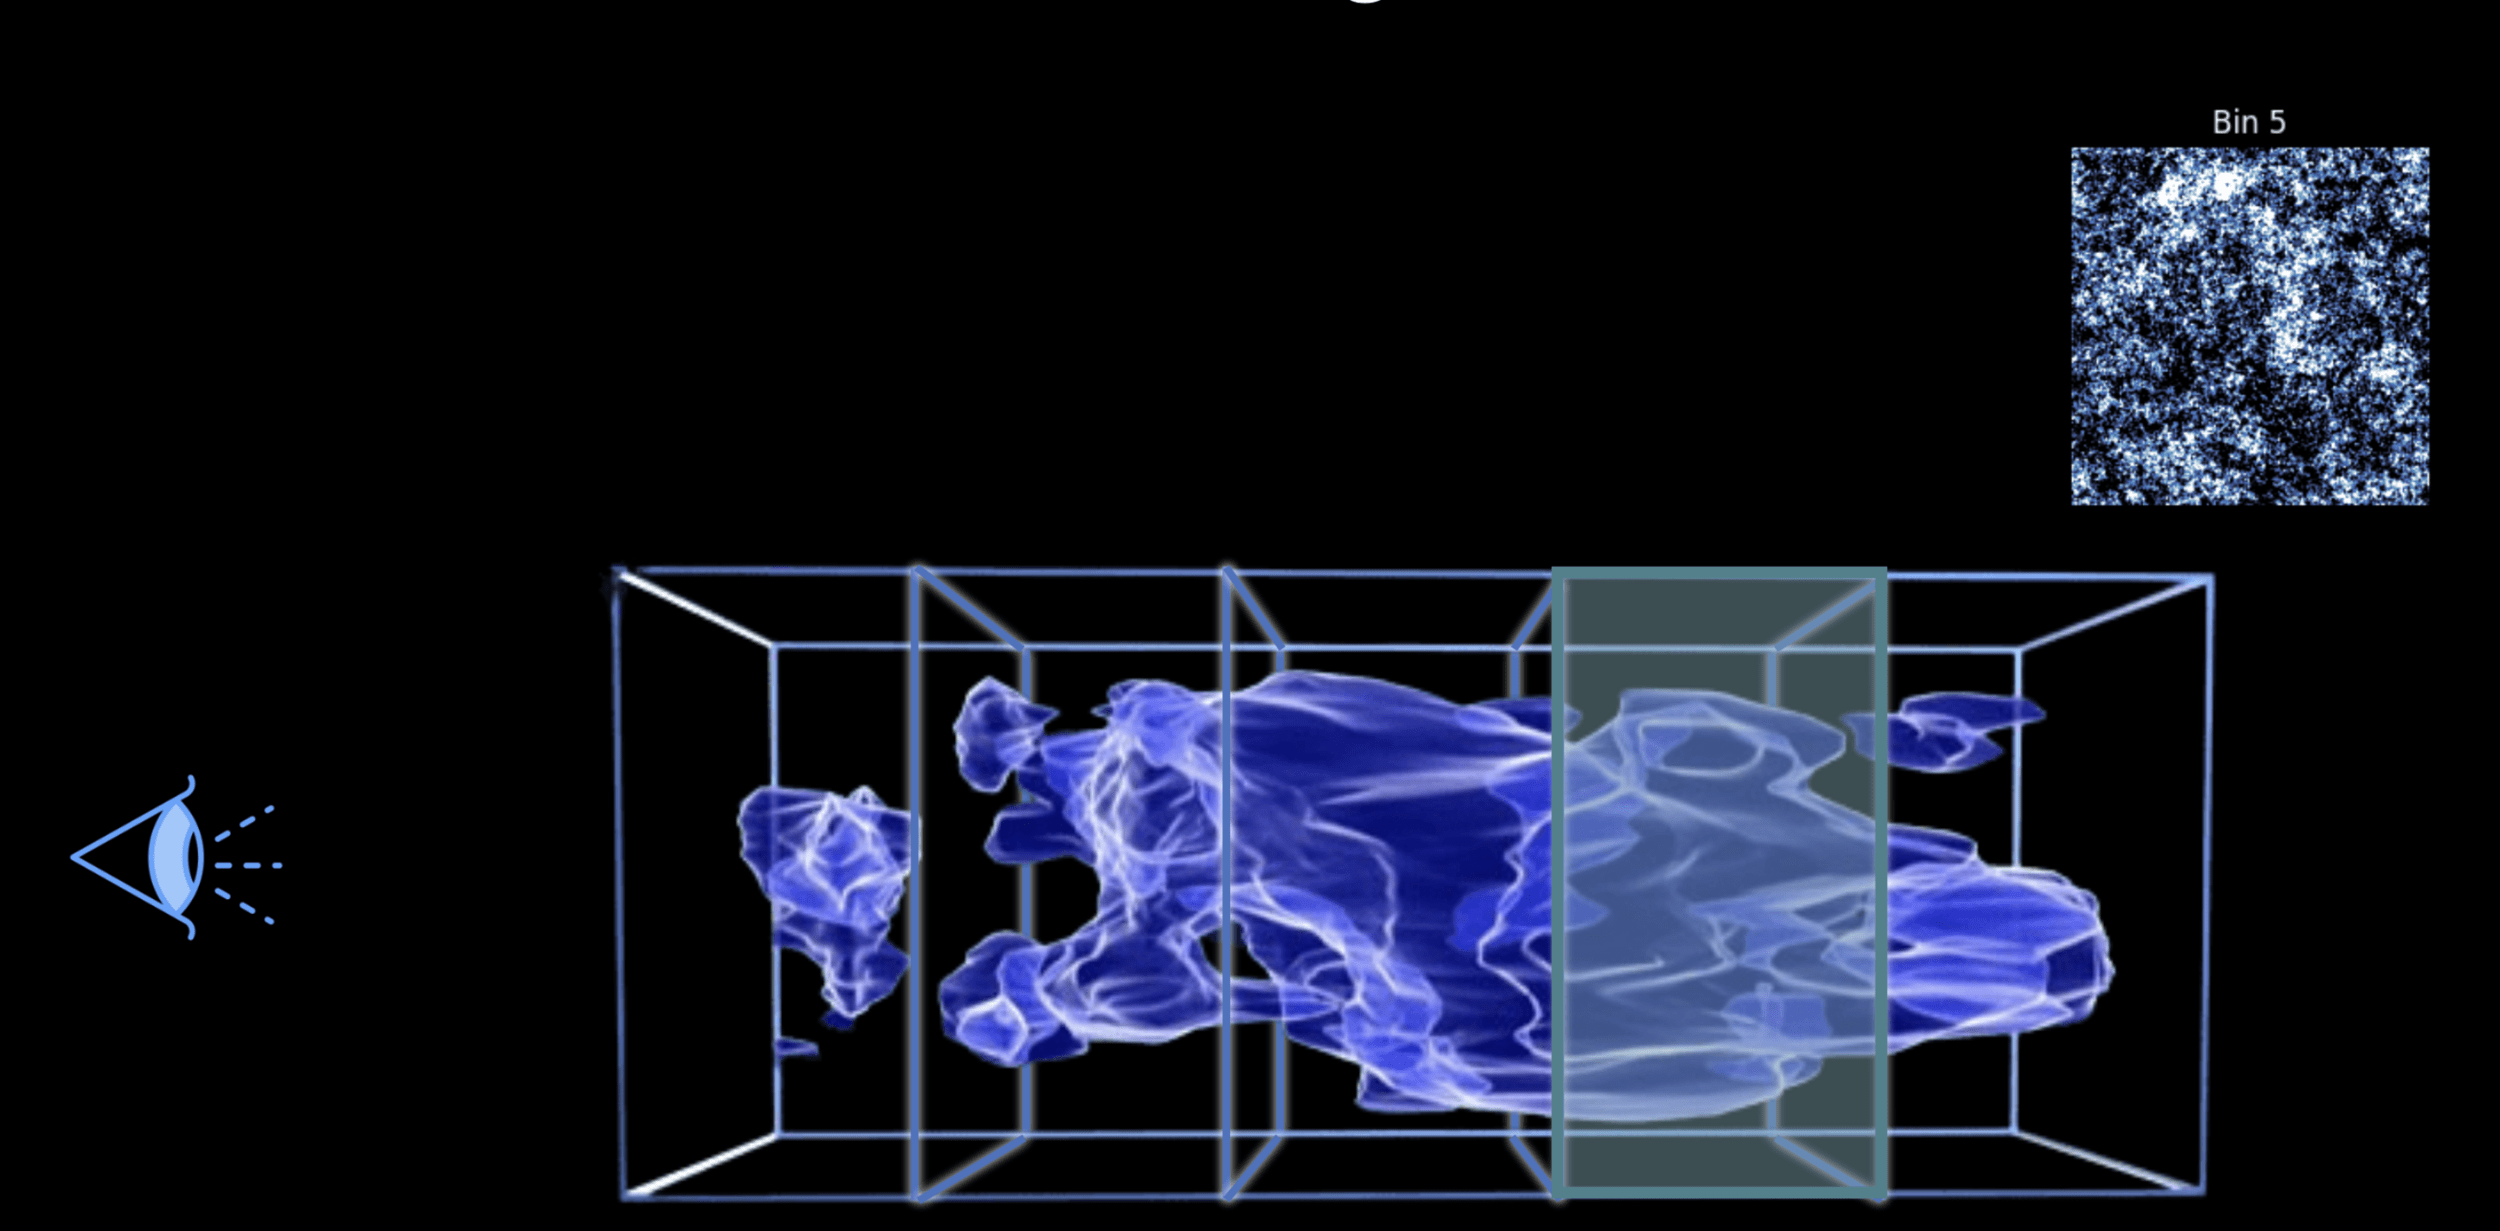
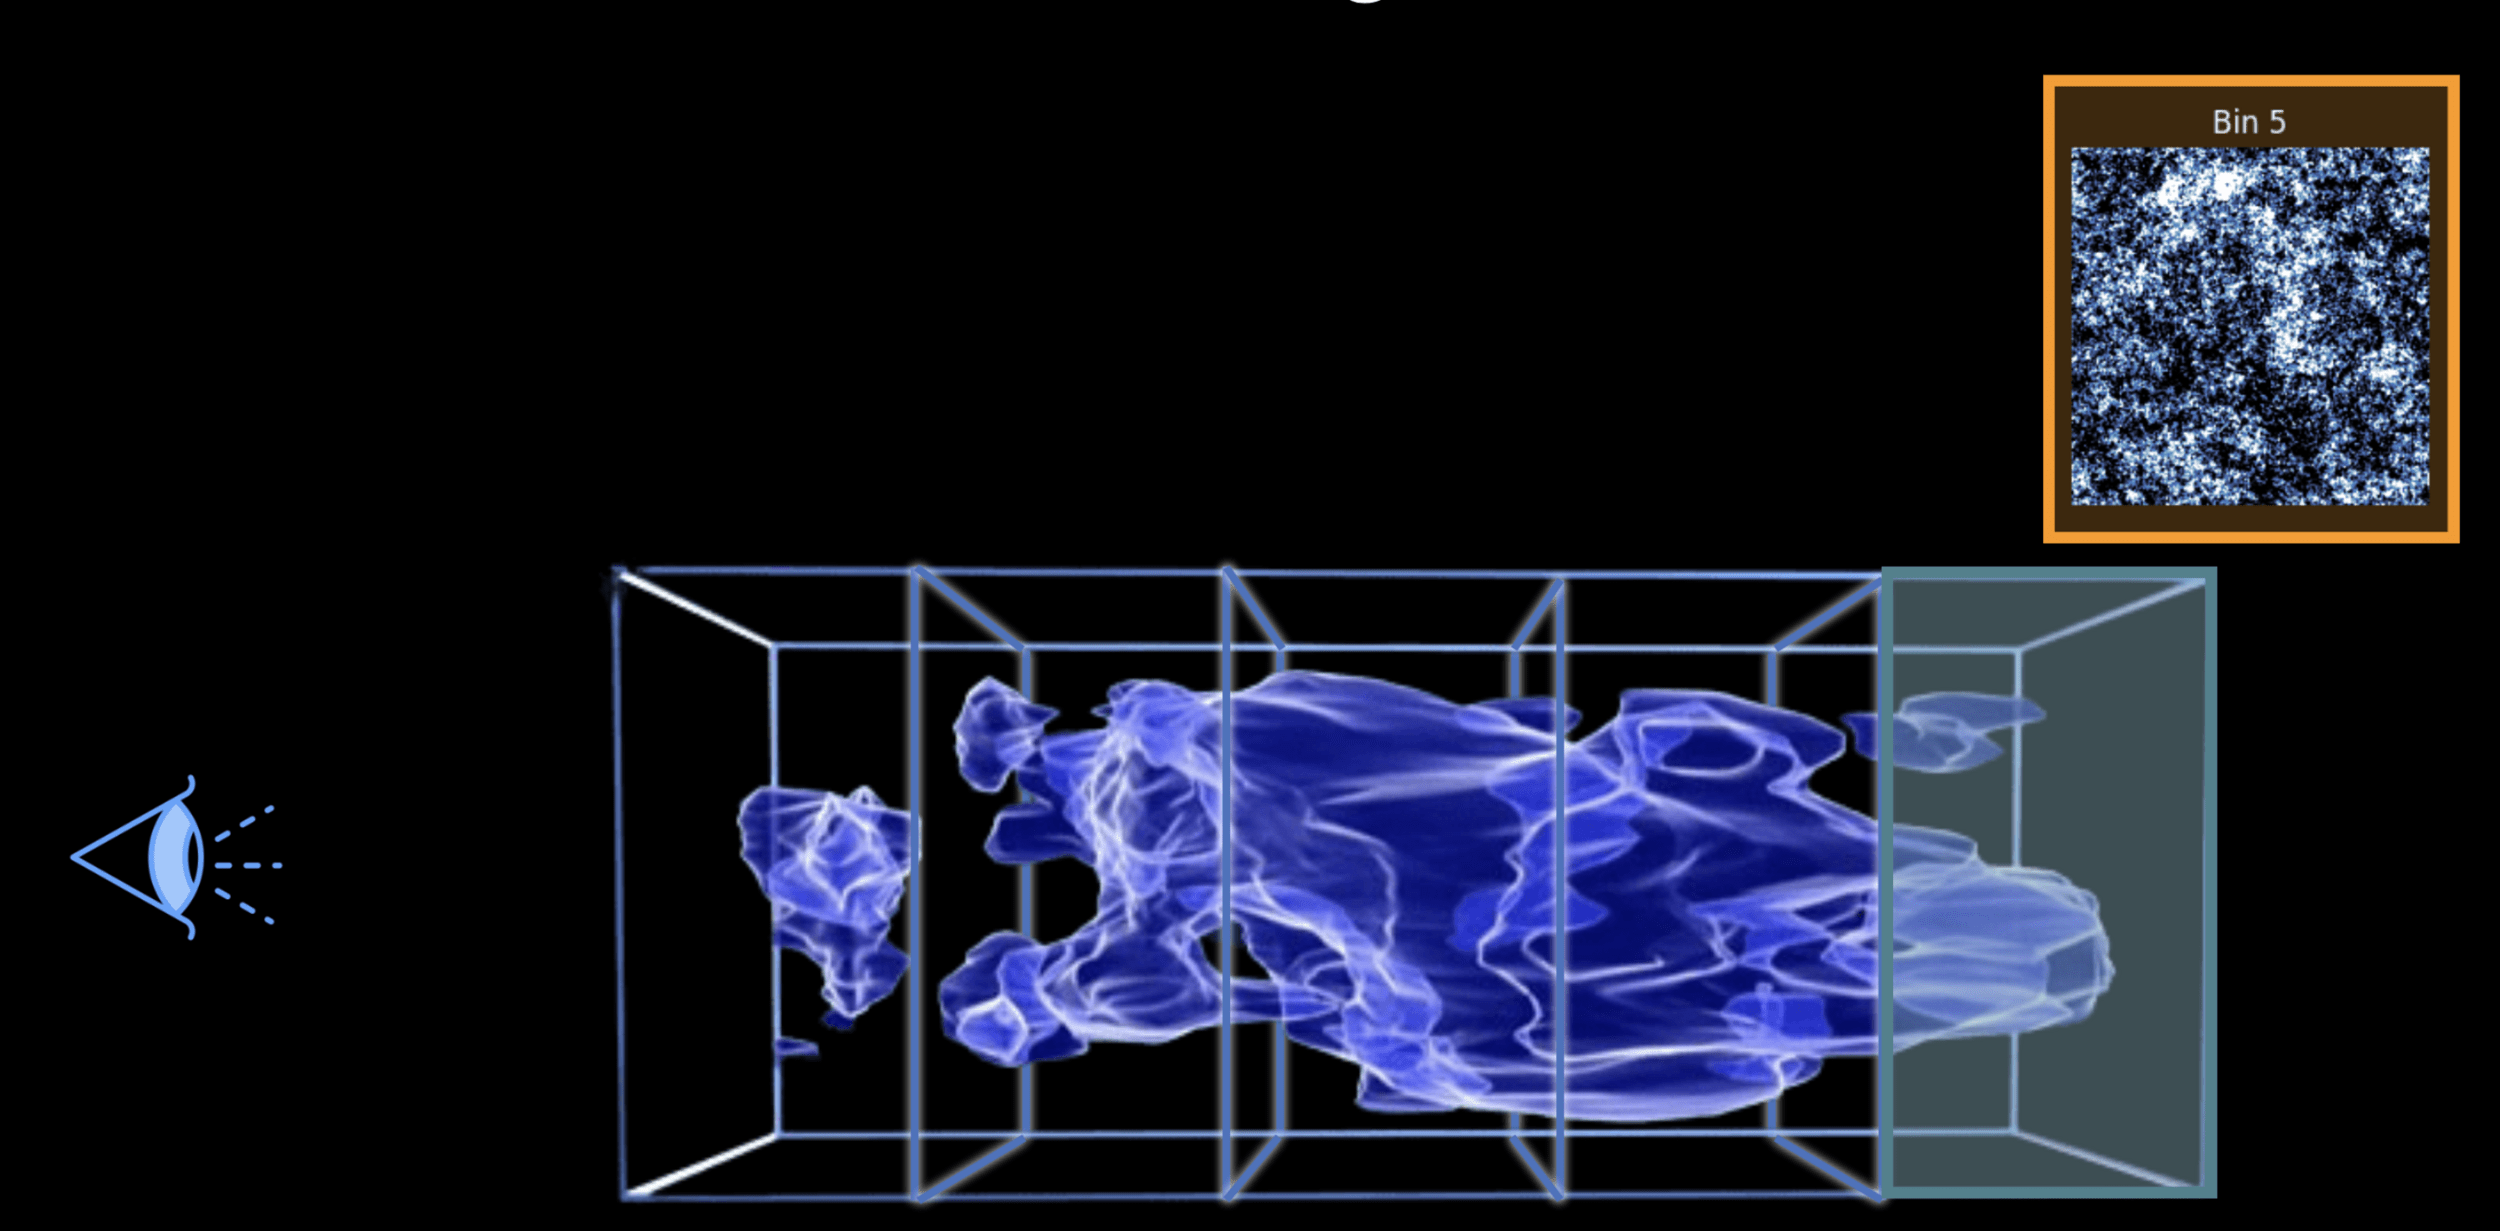
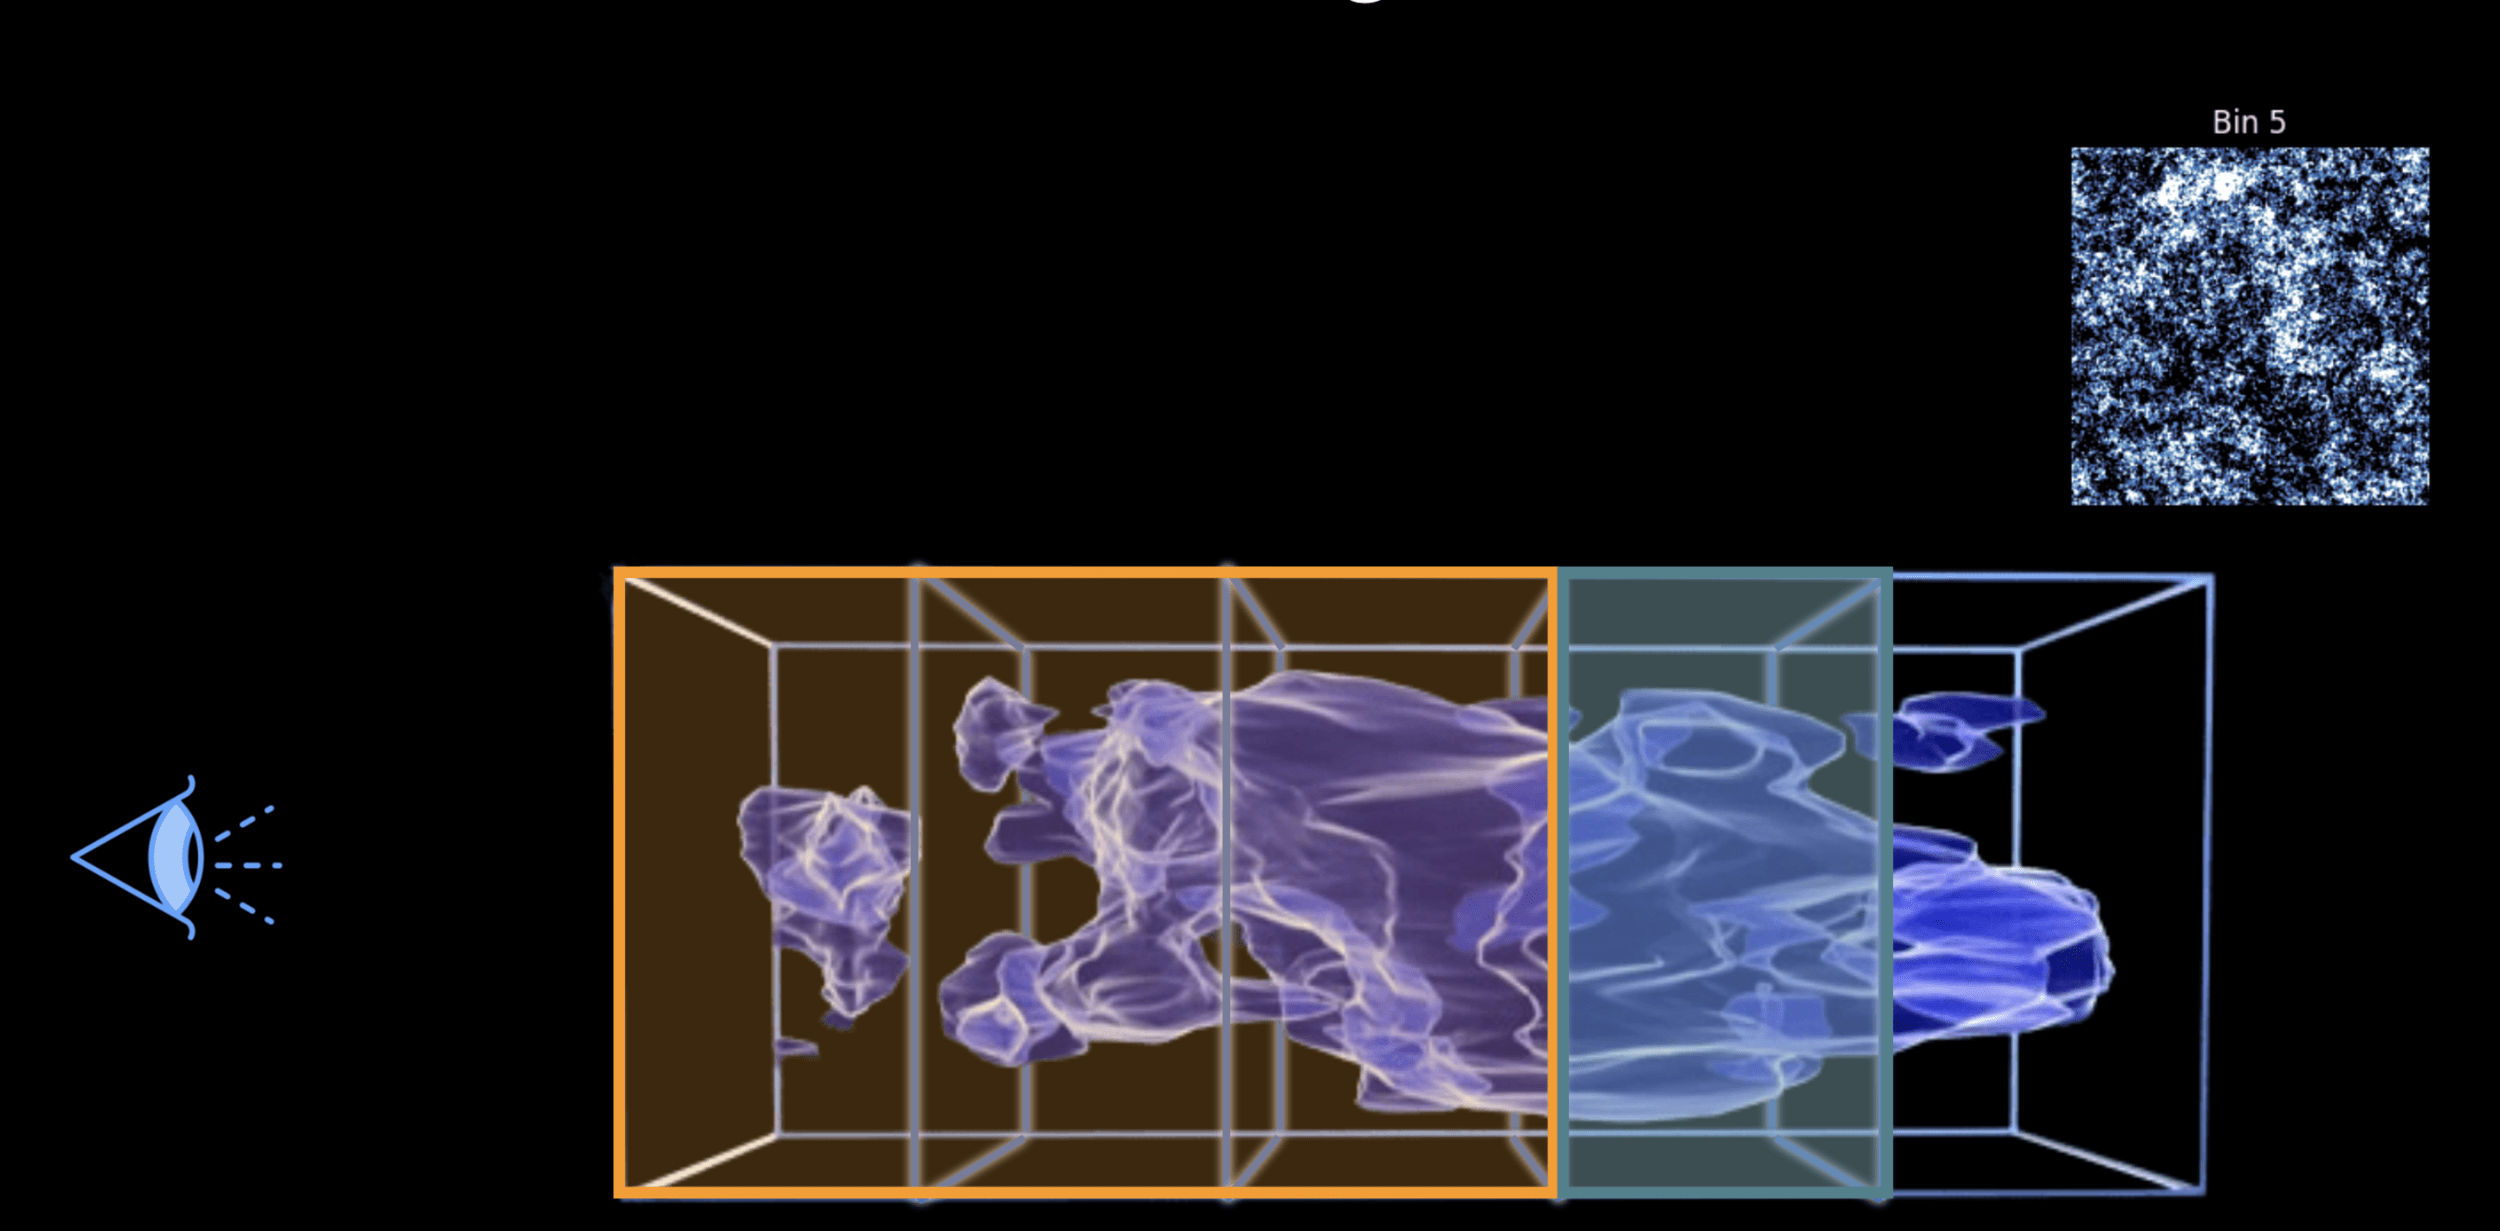
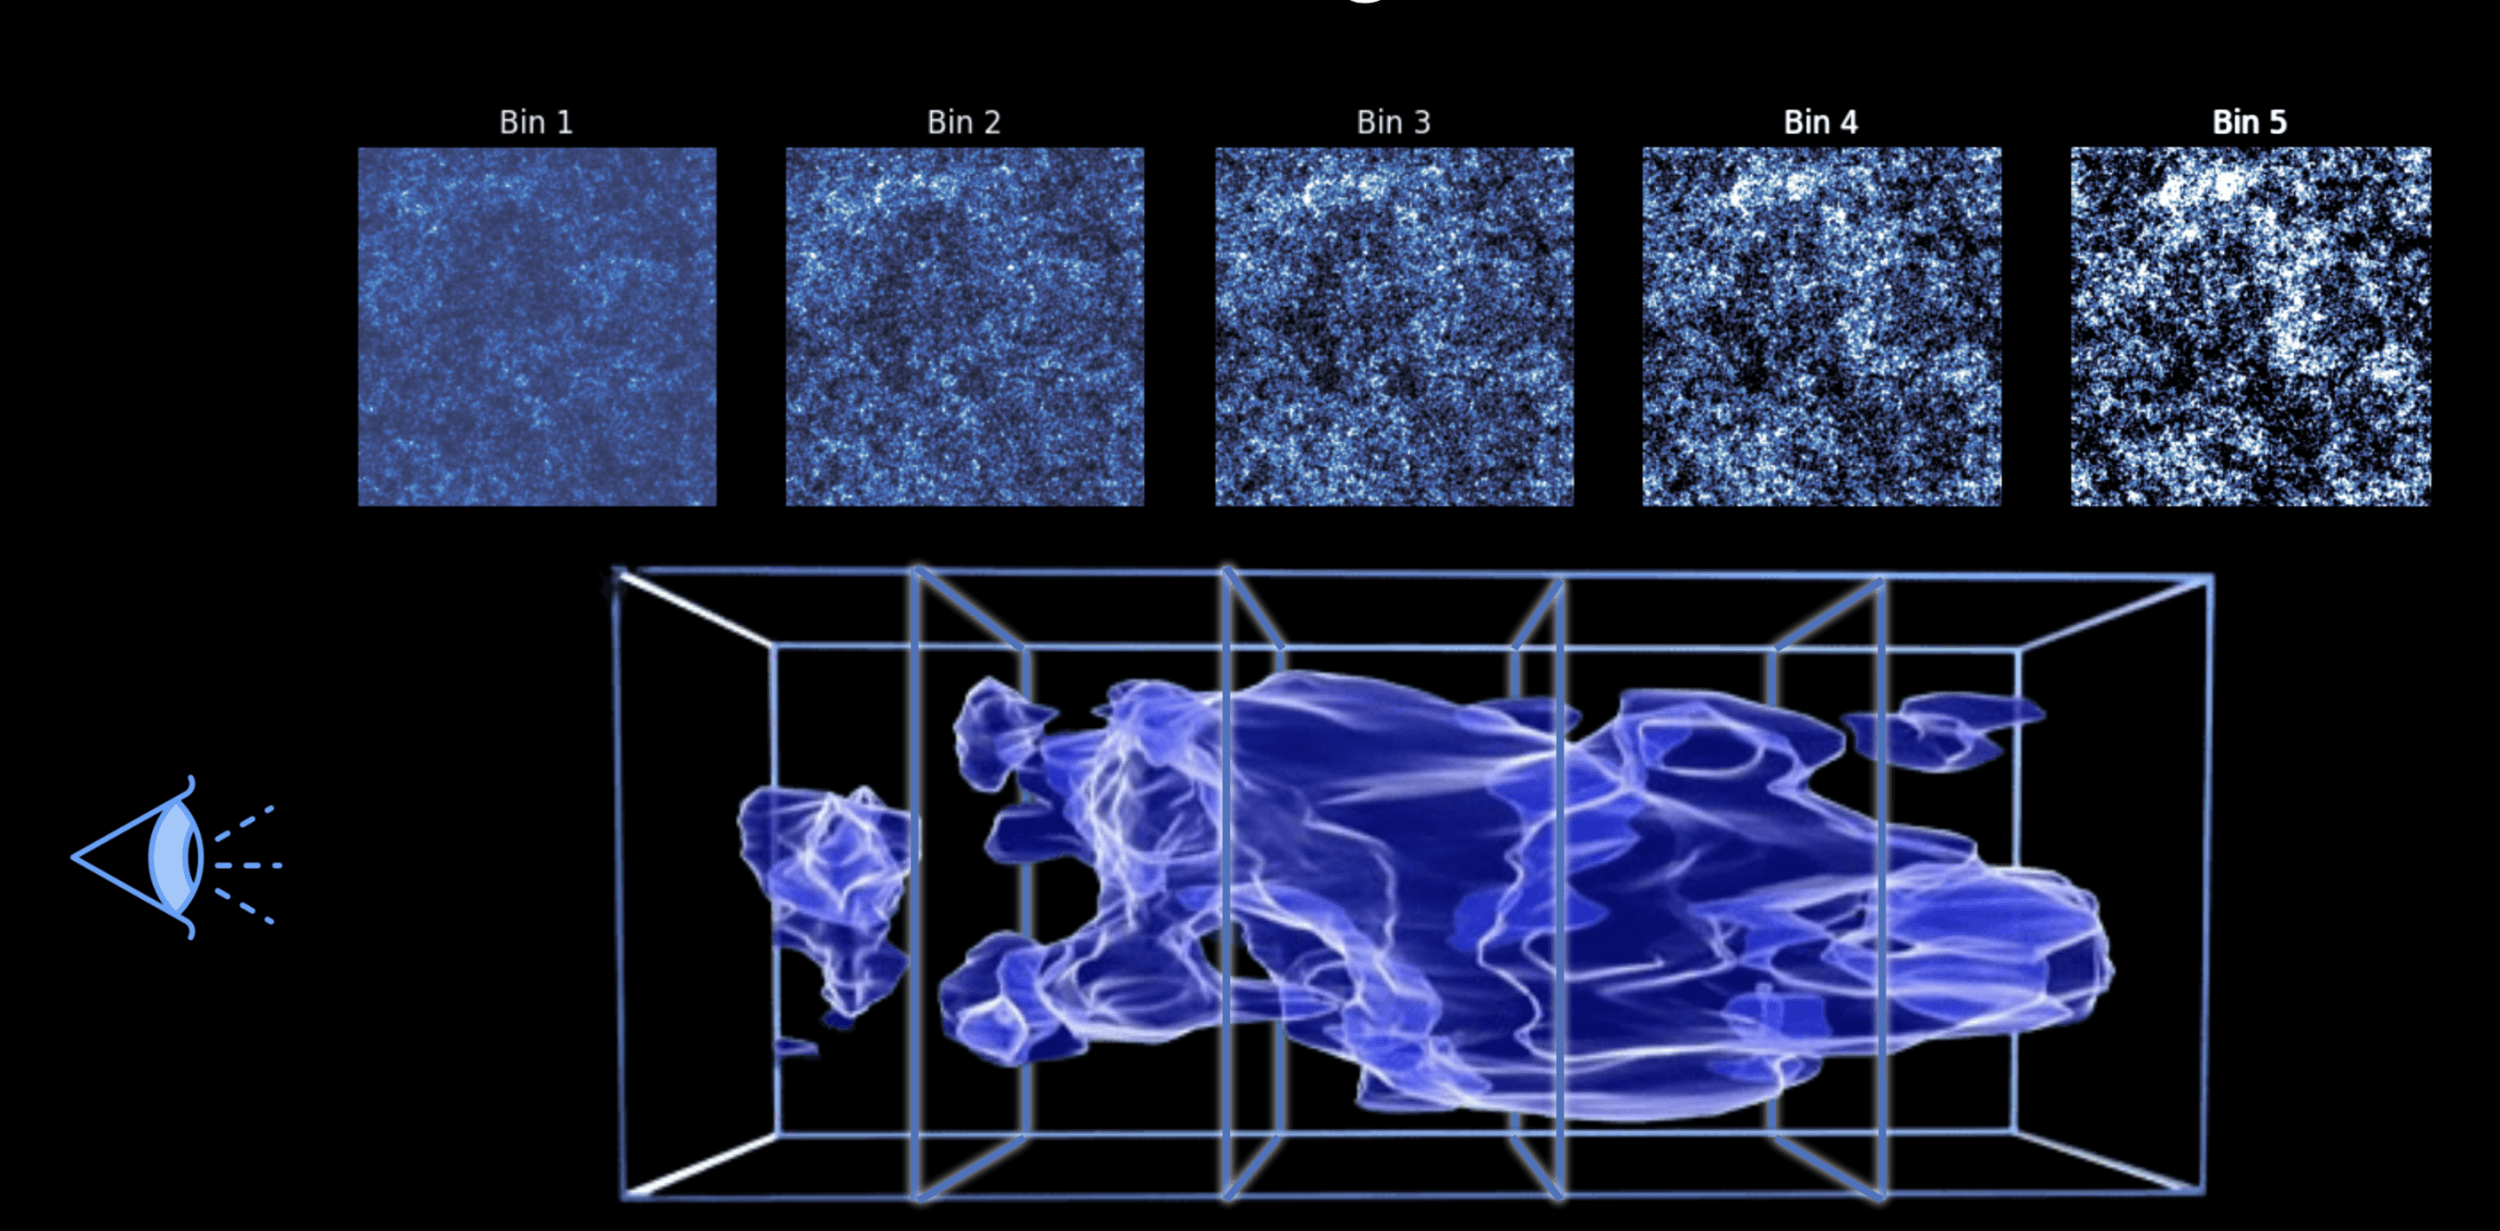
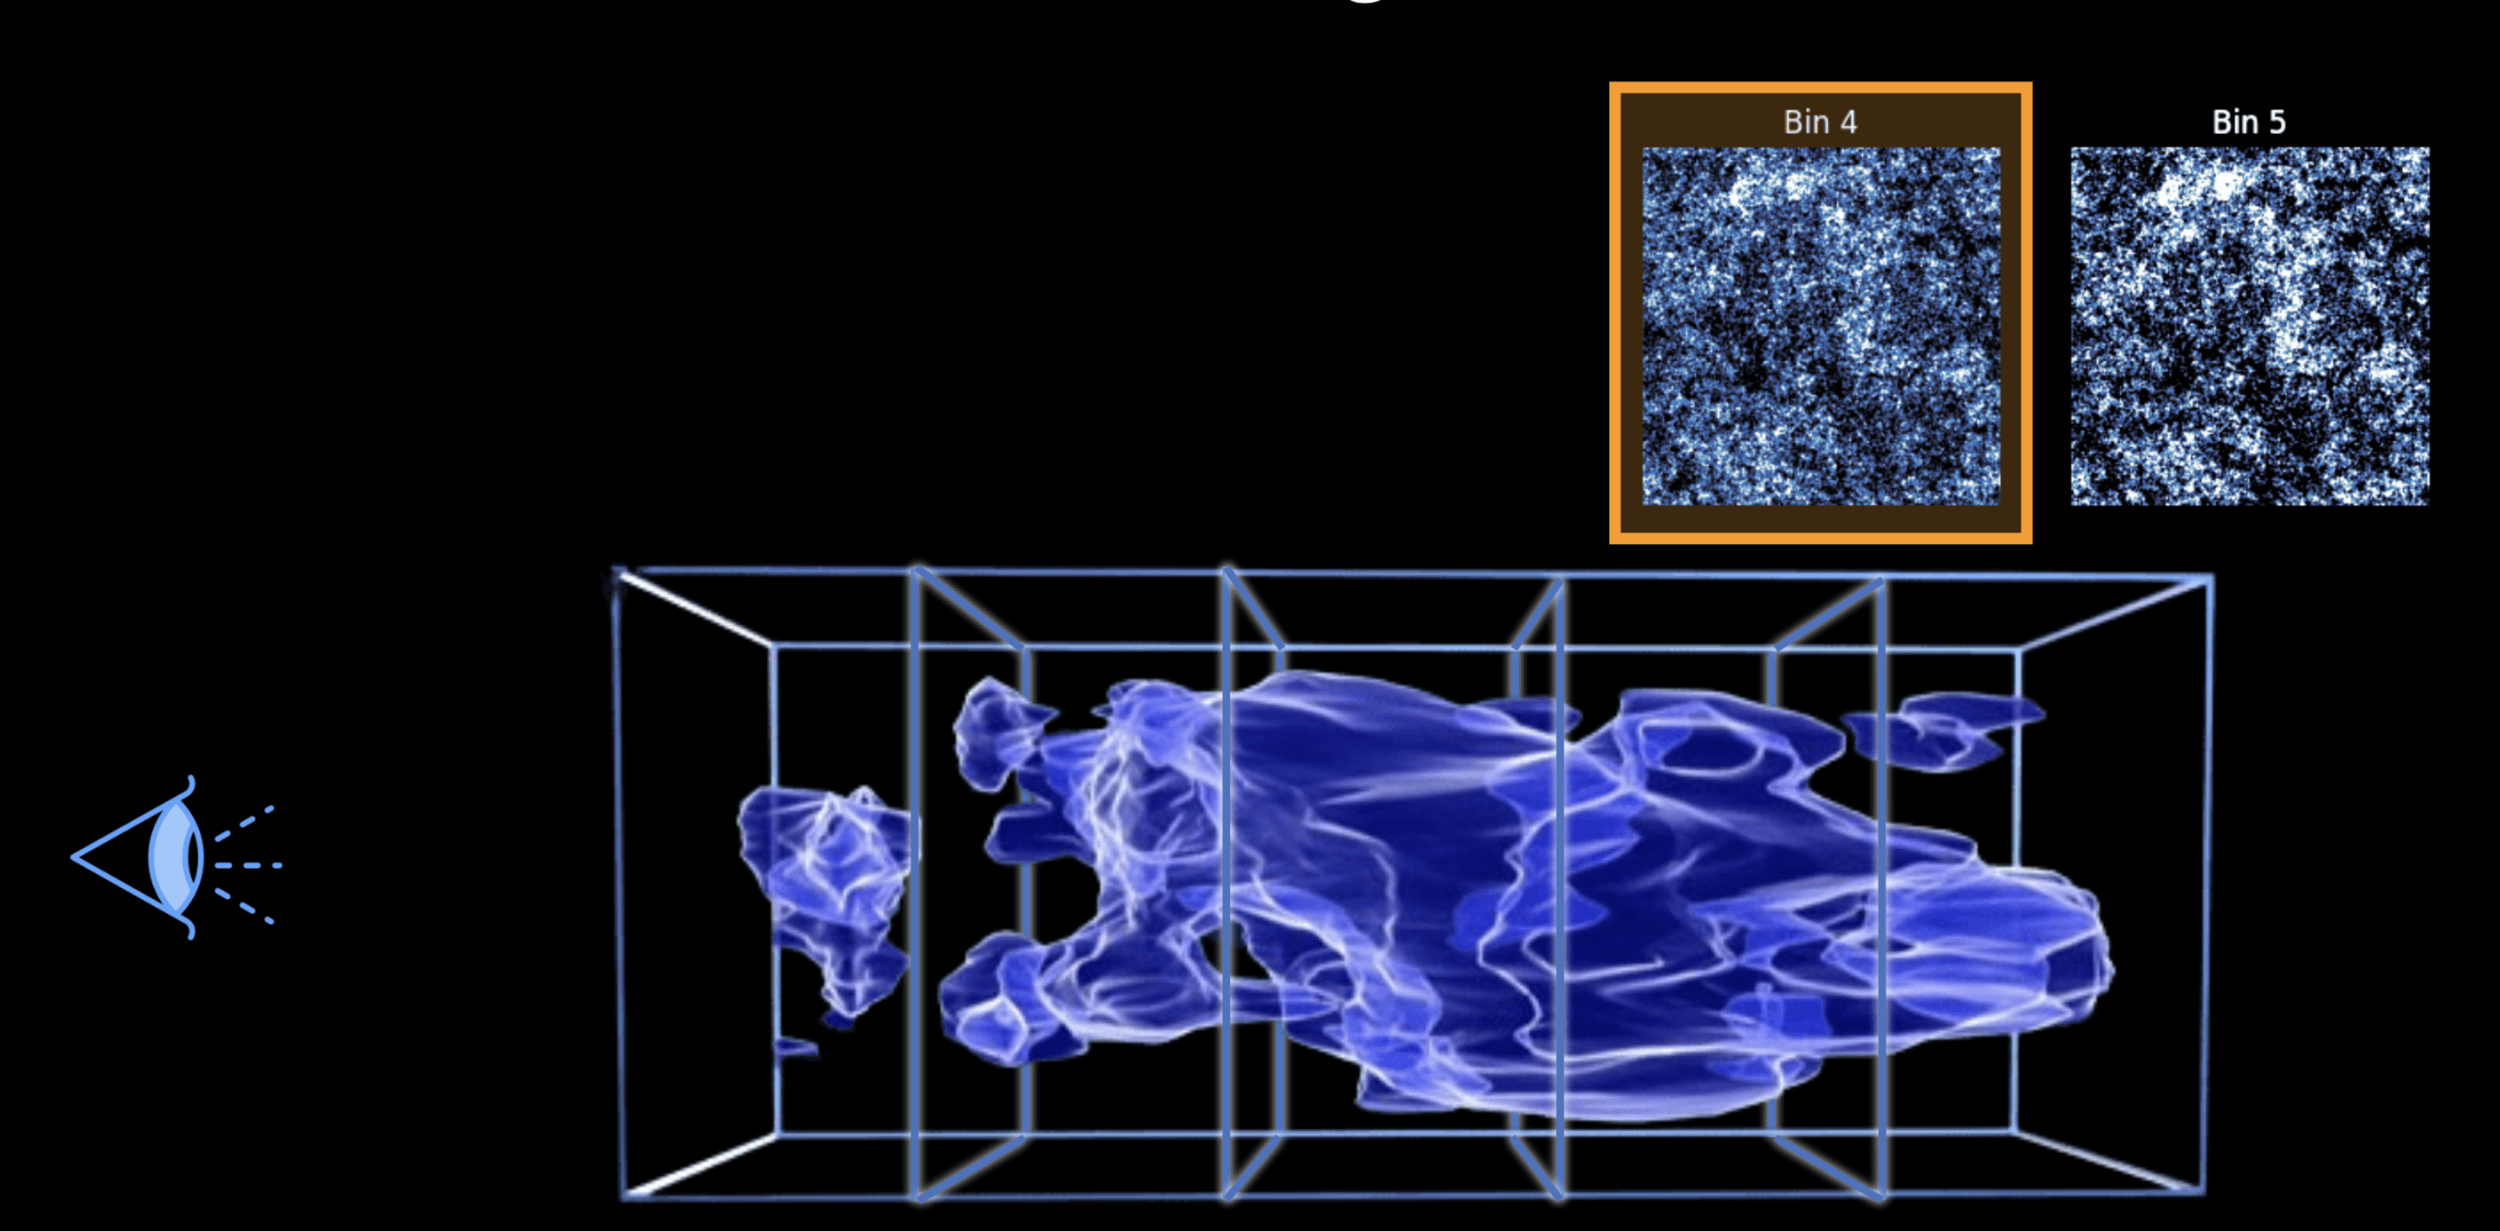
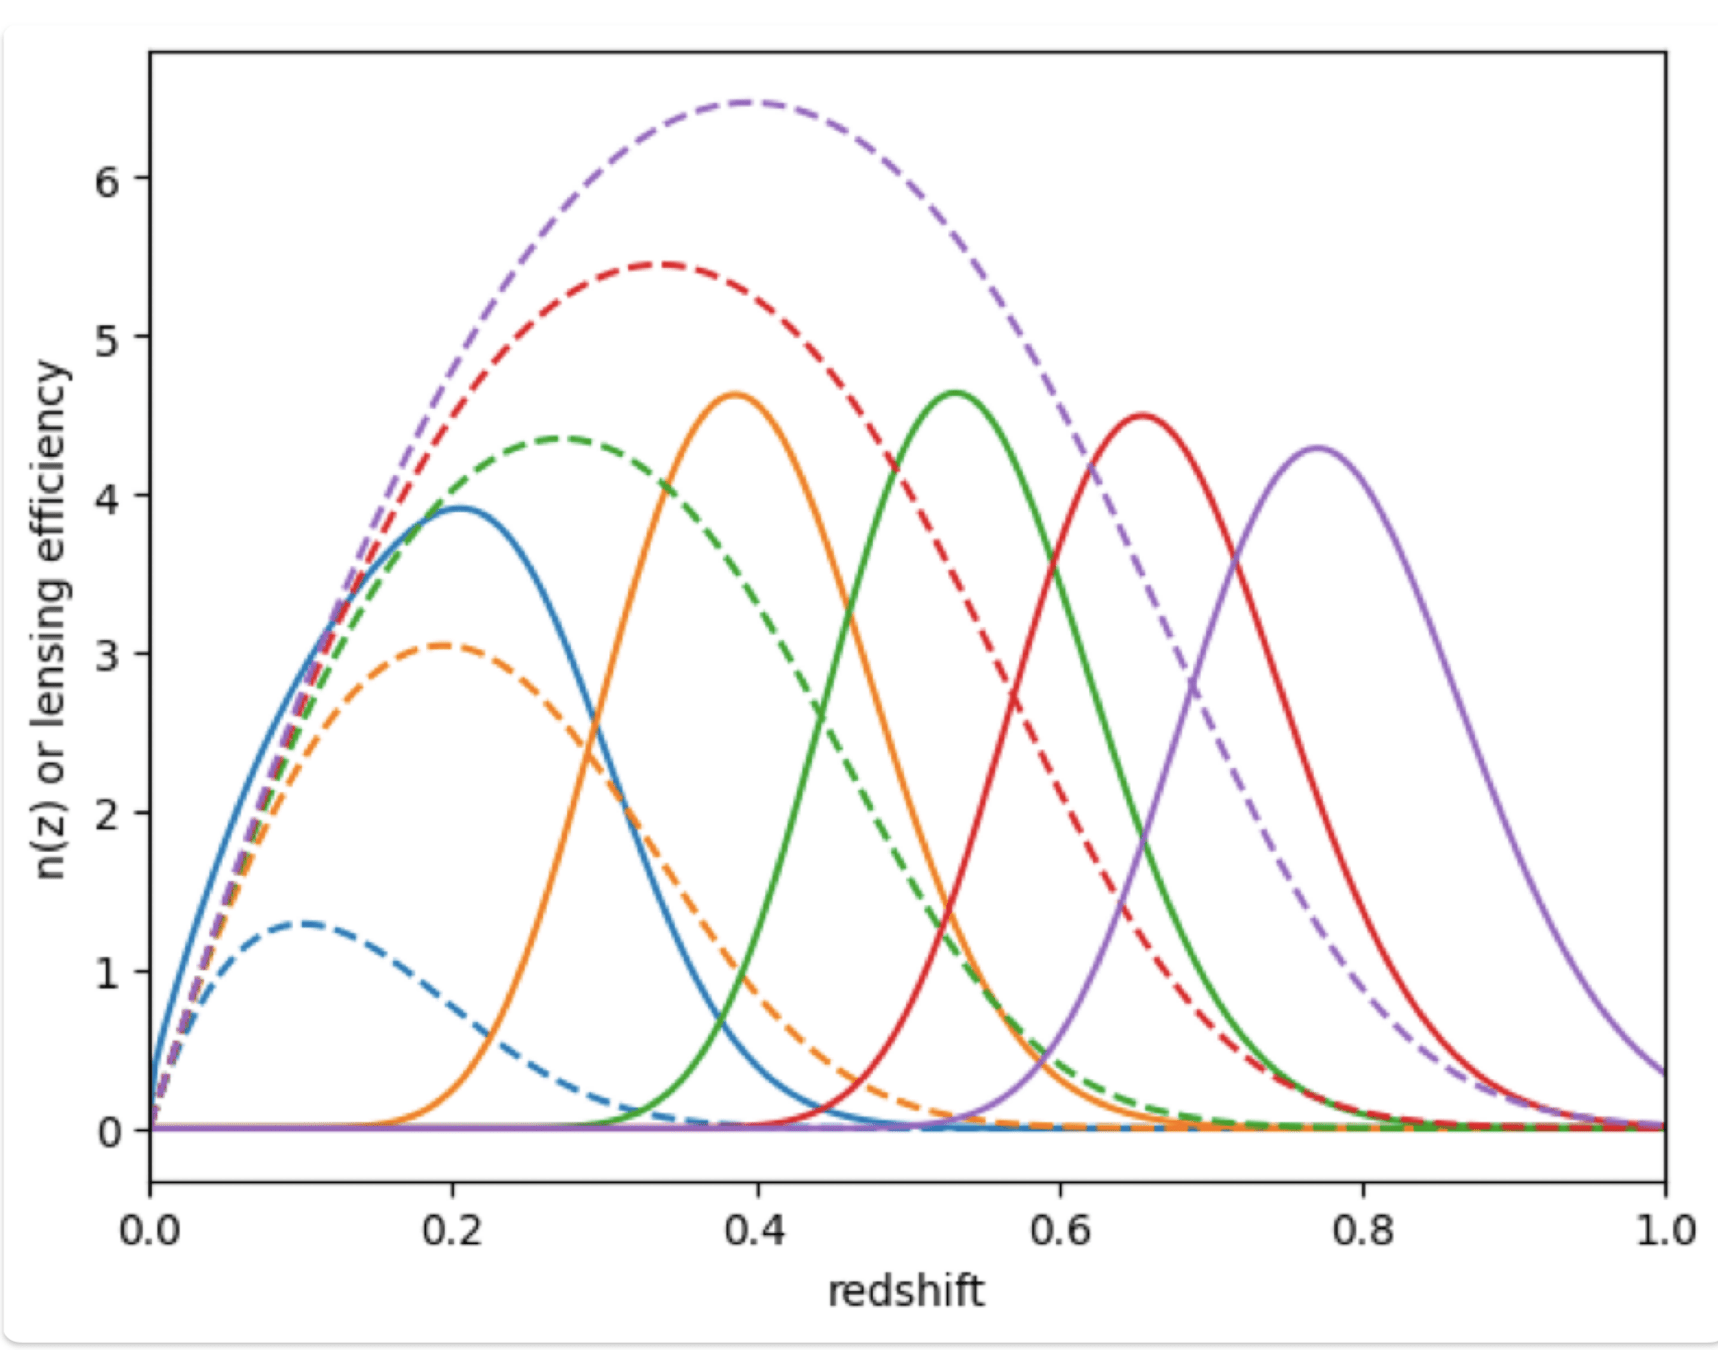
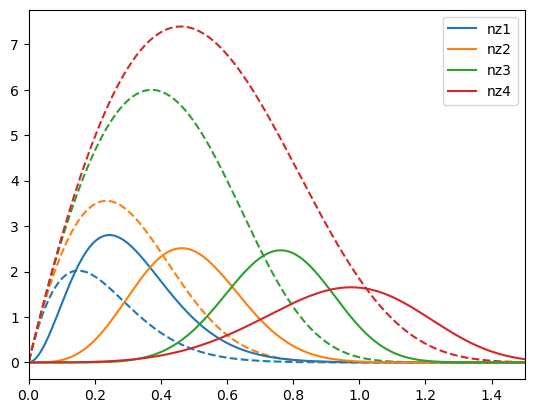
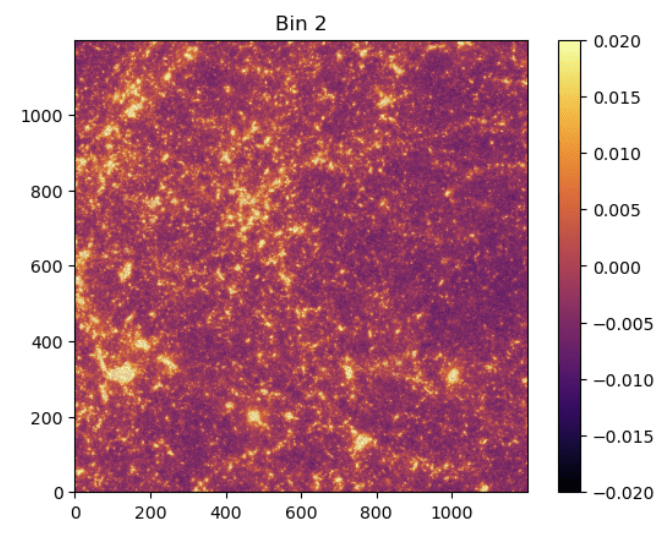
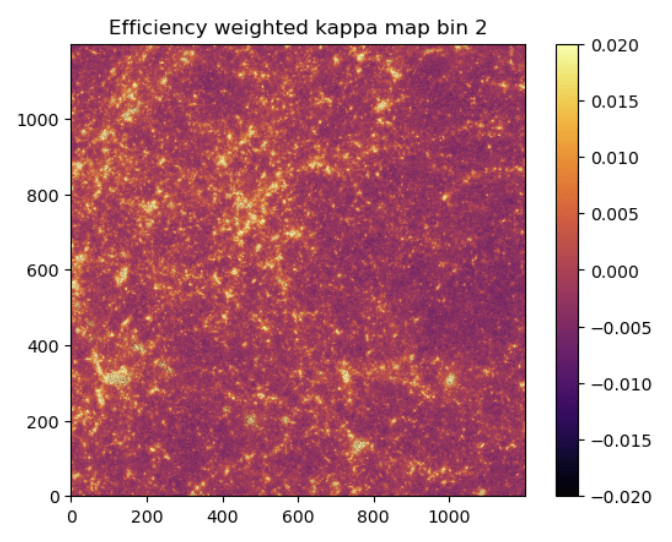
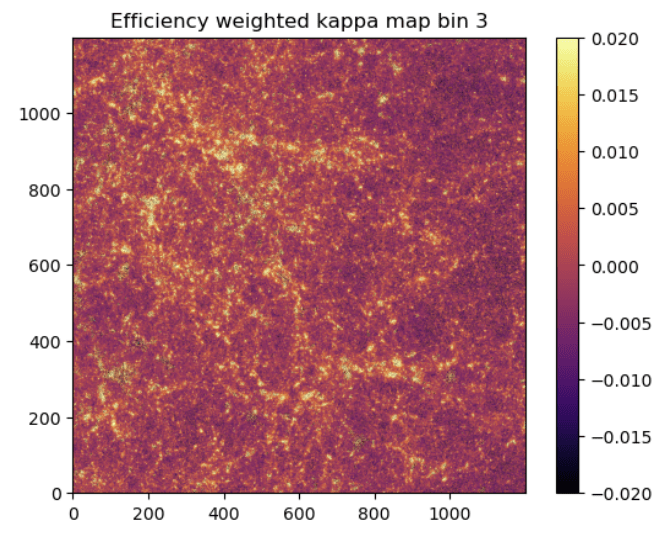
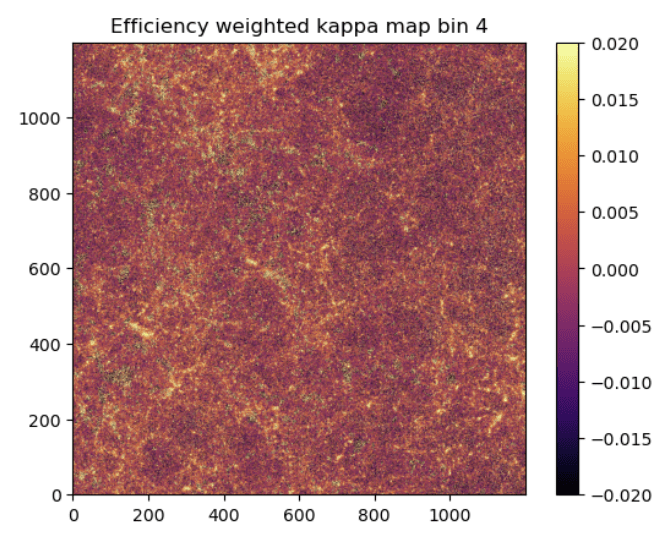
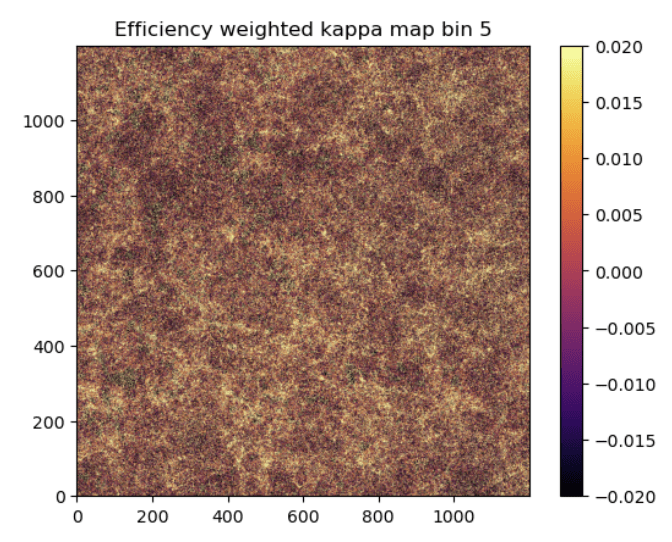
Weak lensing tomography
Credit: Justine Zeghal
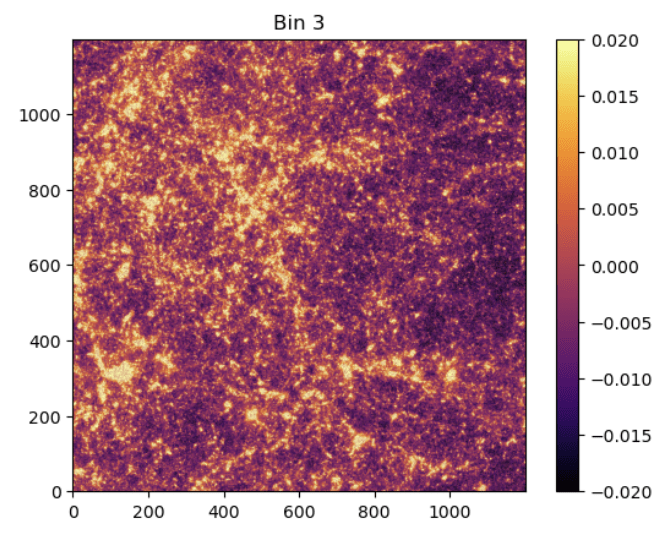
Weak lensing tomography
Credit: Justine Zeghal
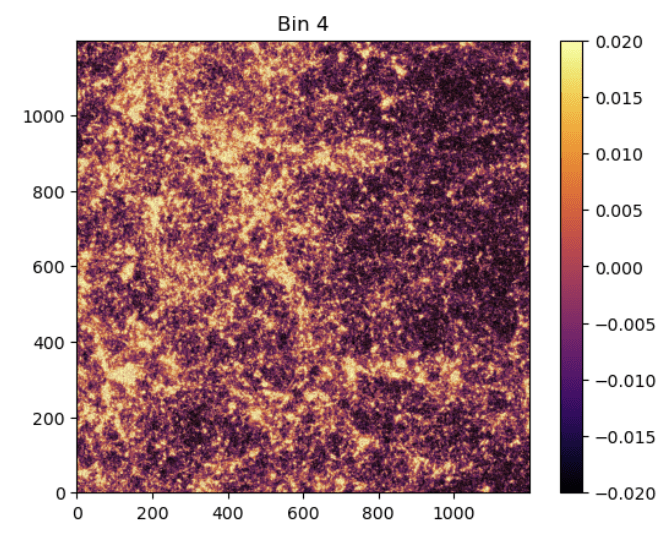
Weak lensing tomography
Credit: Justine Zeghal
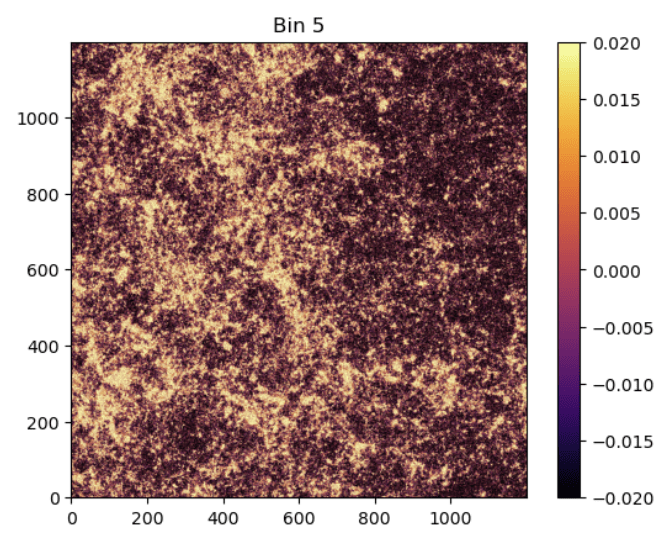
Weak lensing tomography
Credit: Justine Zeghal
Weak lensing tomography
Credit: Justine Zeghal
Weak lensing tomography
Credit: Justine Zeghal
Weak lensing tomography
Credit: Justine Zeghal
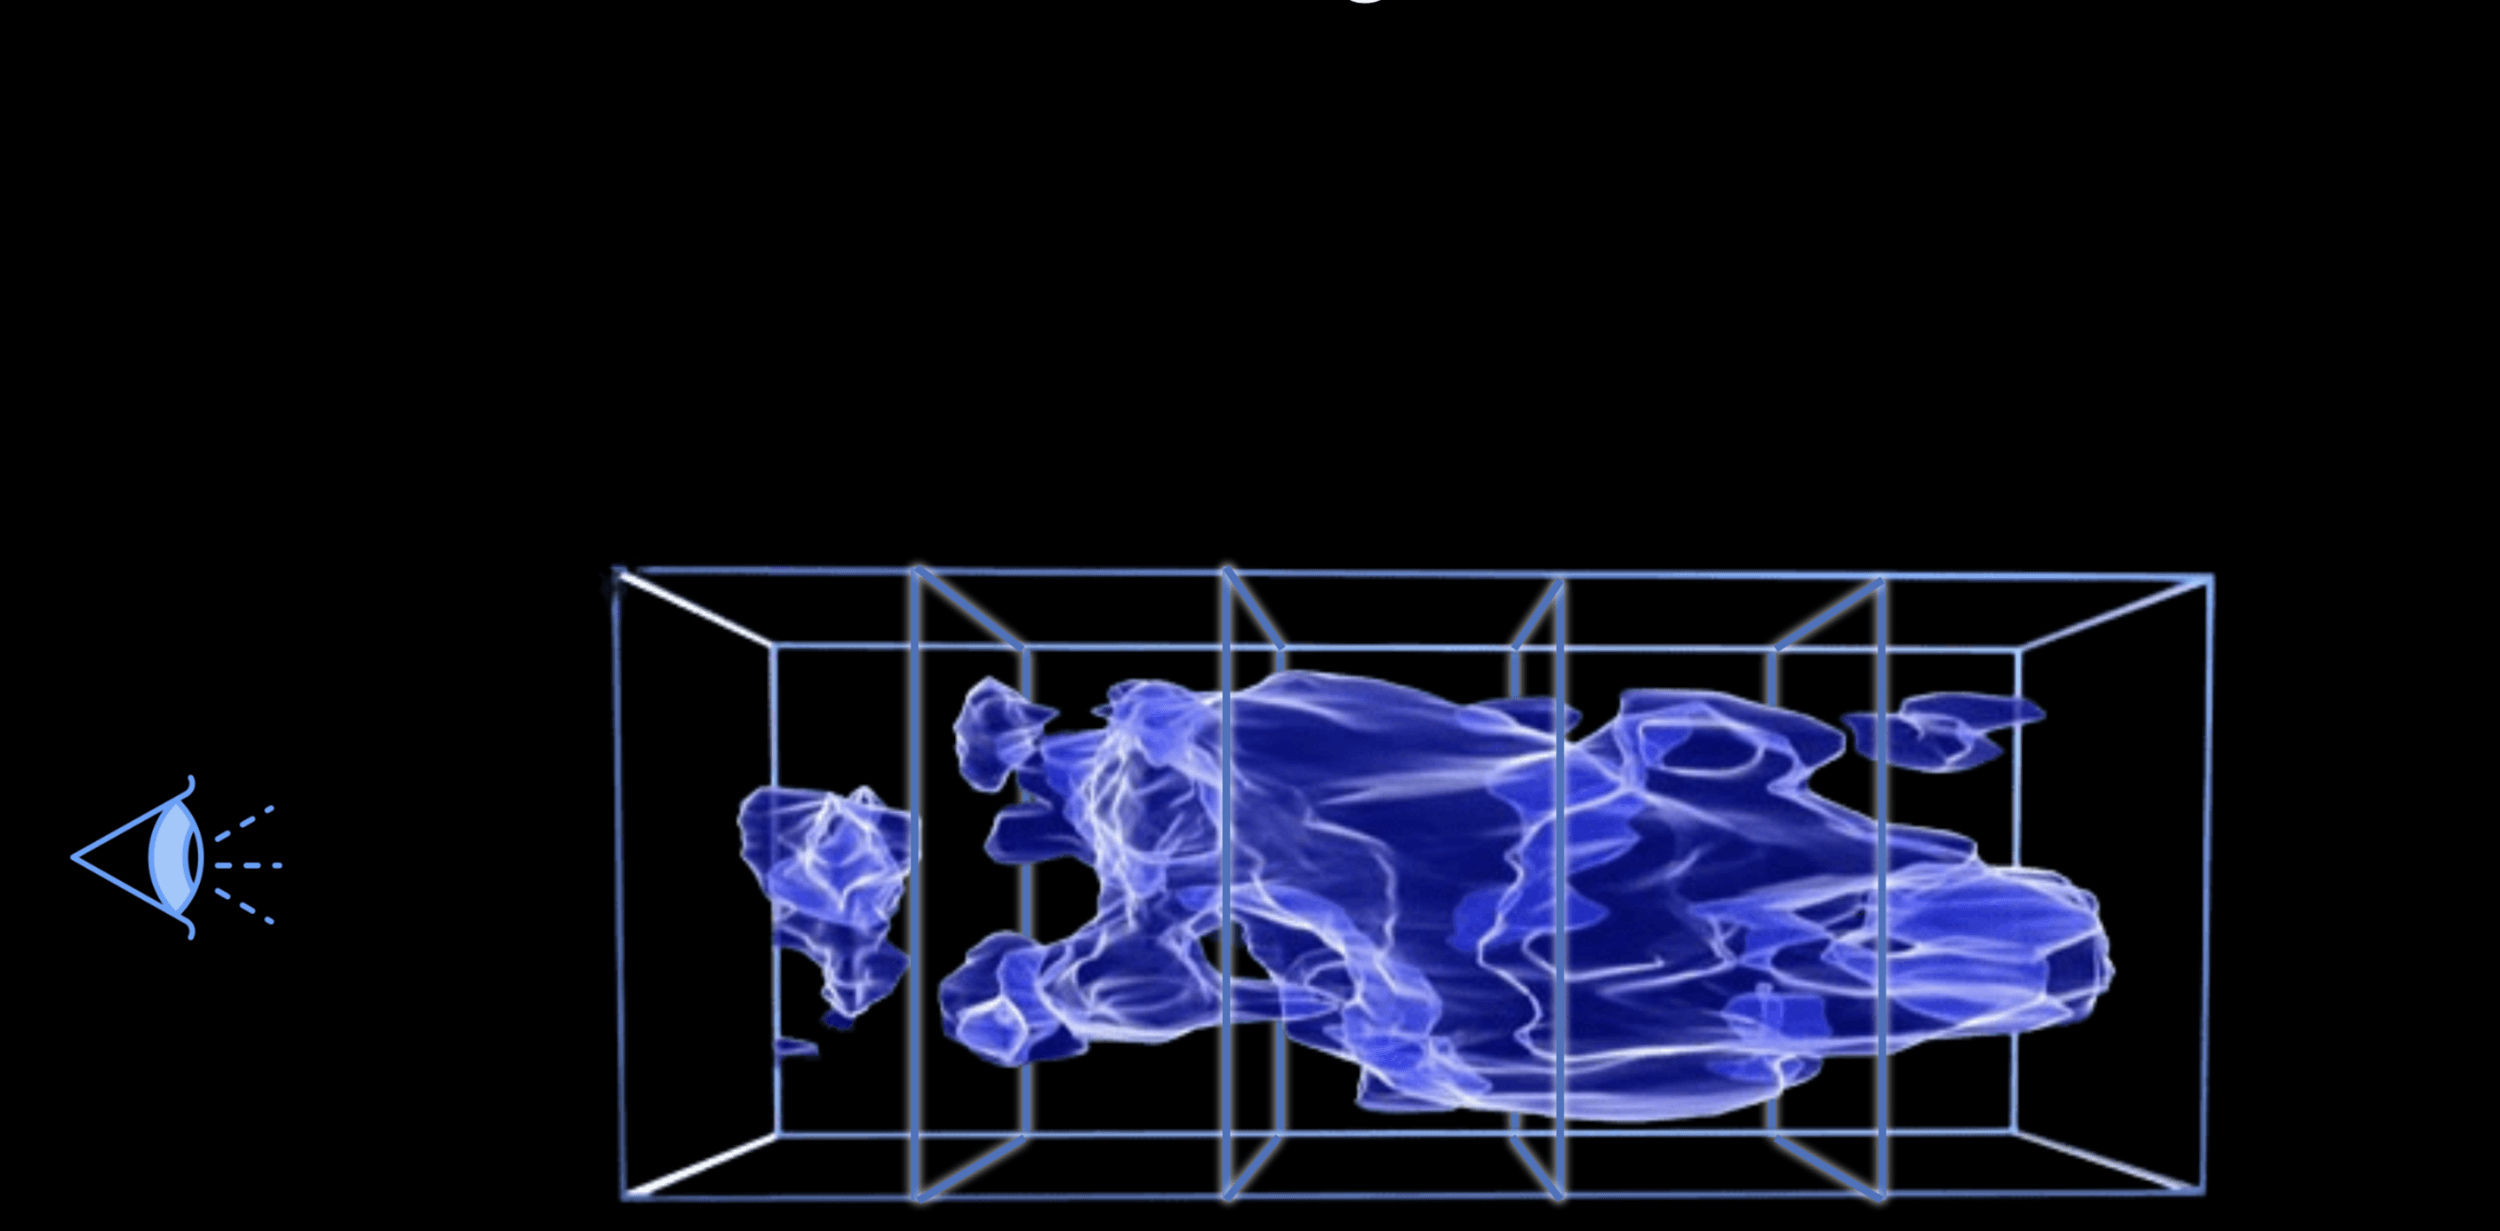
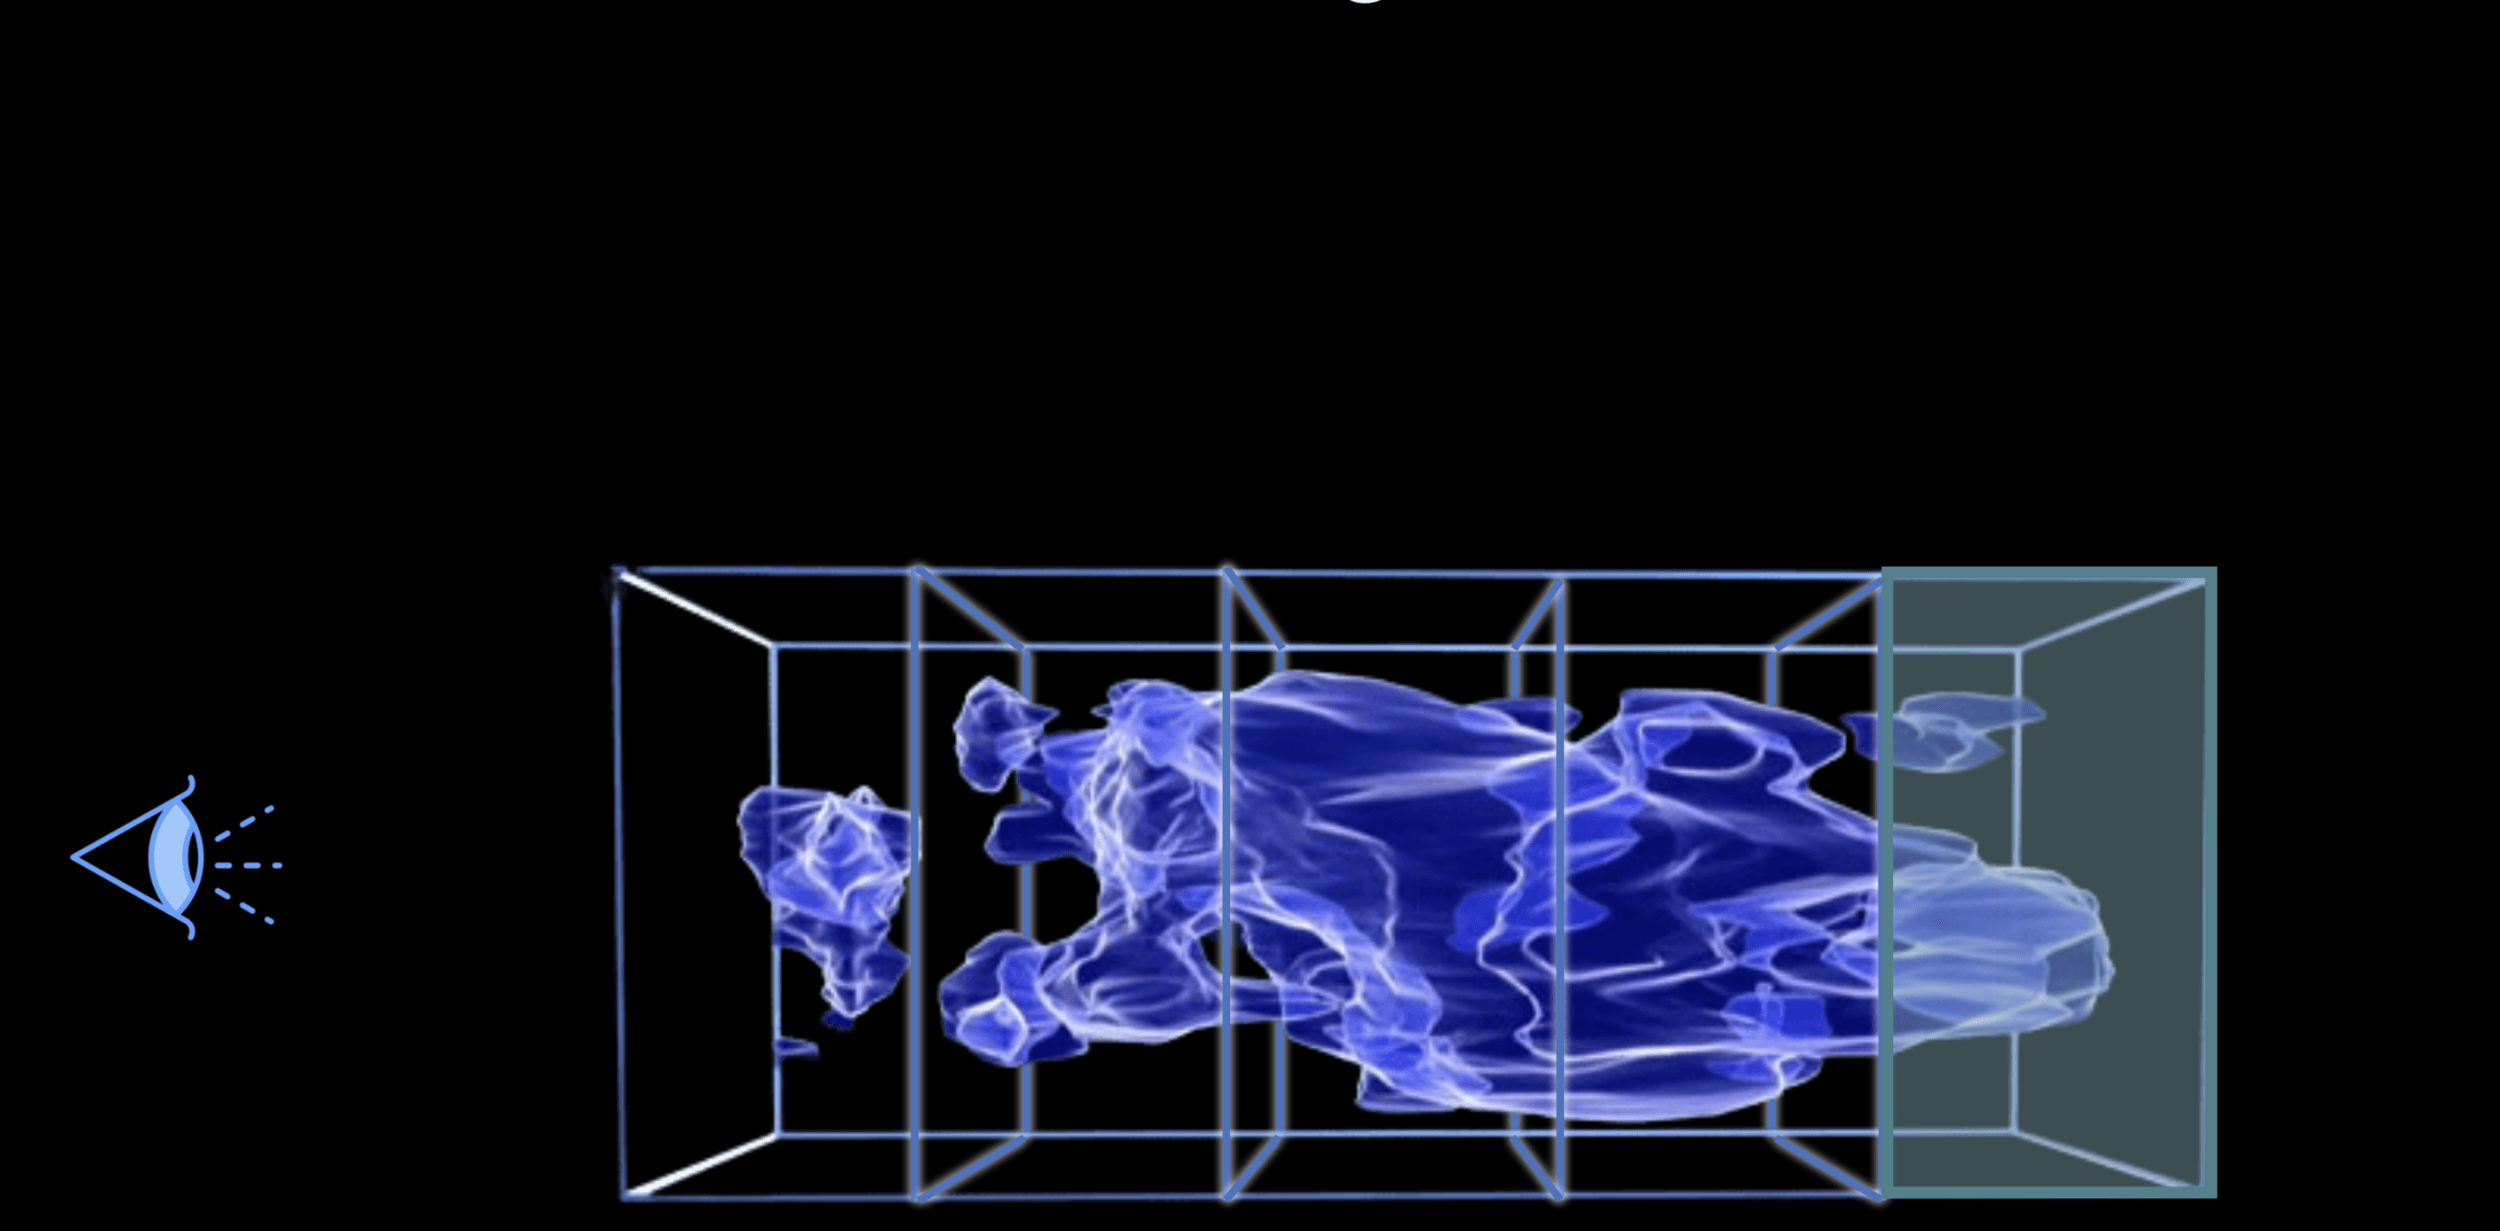
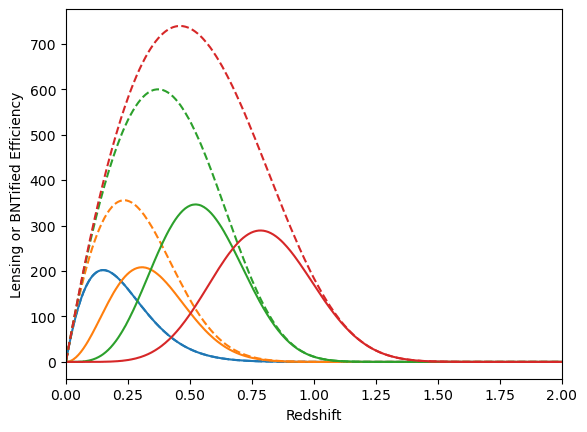
BNT transform
- When we observe shear, contributions come from mass at different redshifts.
- BNT Transform: method to “null” contributions from unwanted redshift ranges.
- It reorganizes weak-lensing data so that only specific redshift ranges contribute to the signal.
- BNT aligns angular (ℓ) and physical (k) scales.
- This could help mitigate baryonic effects by optimally removing sensitivity to poorly modeled small scales and controlling scale leakage.


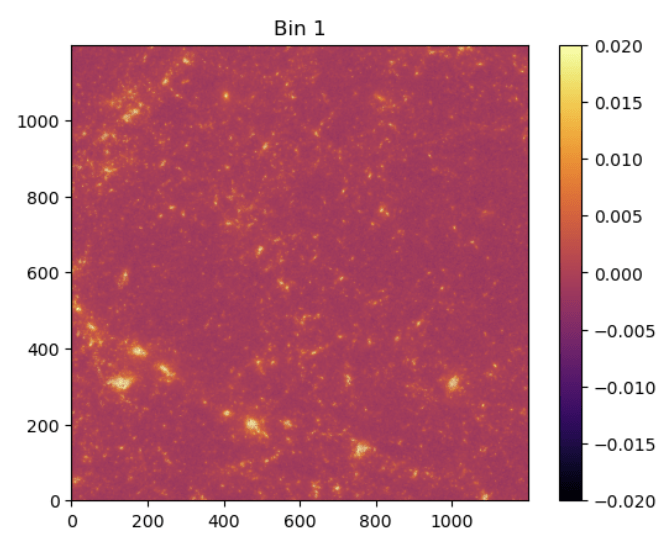
BNT maps
no BNT
BNT


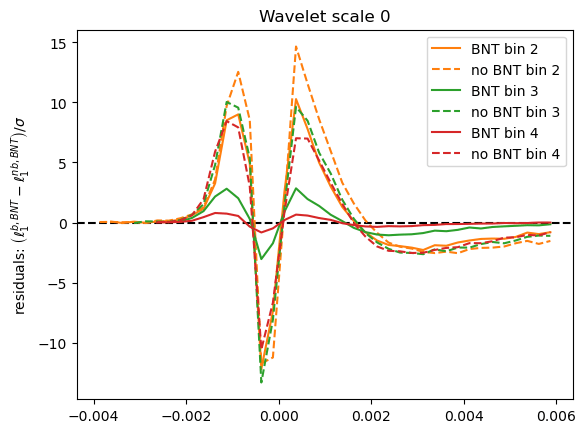
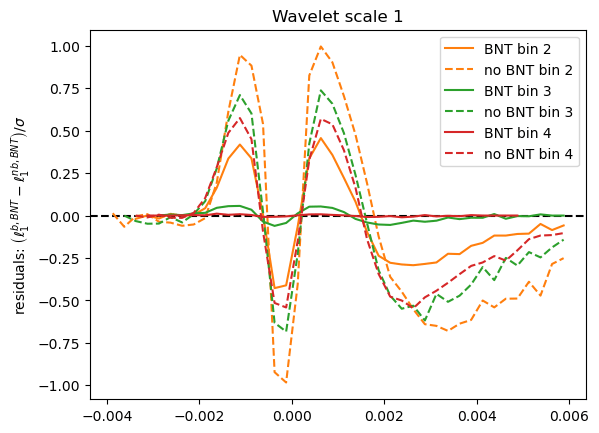
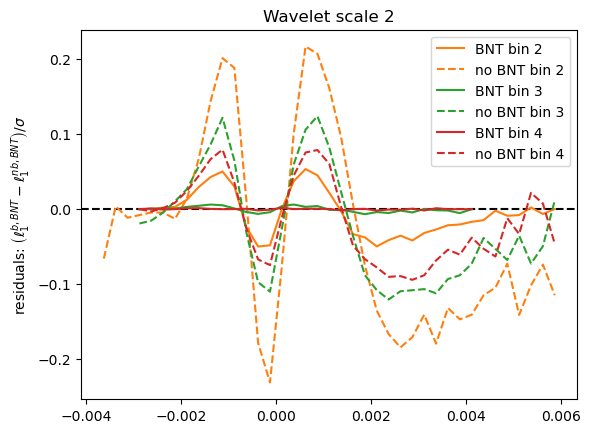
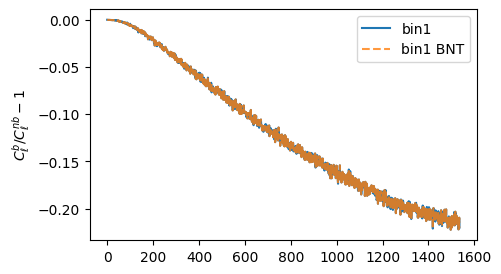
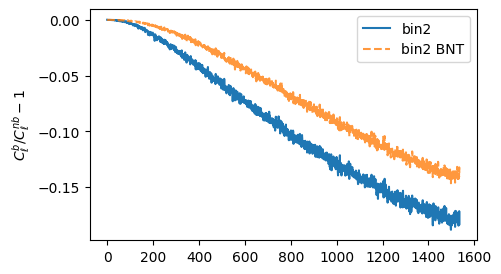
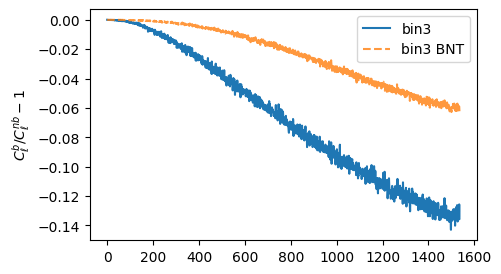
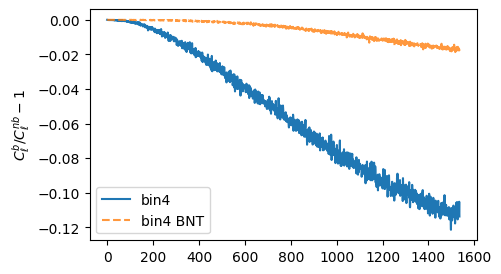
How are statistics impacted?


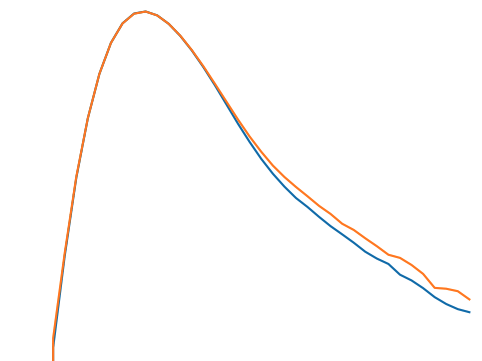
Power Spectrum
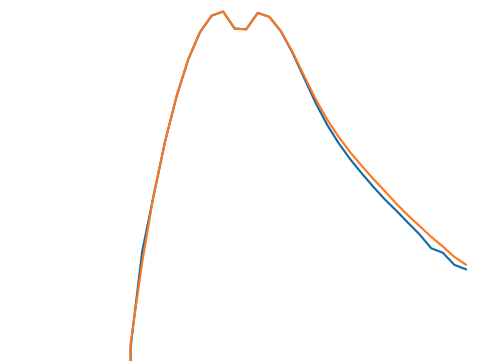
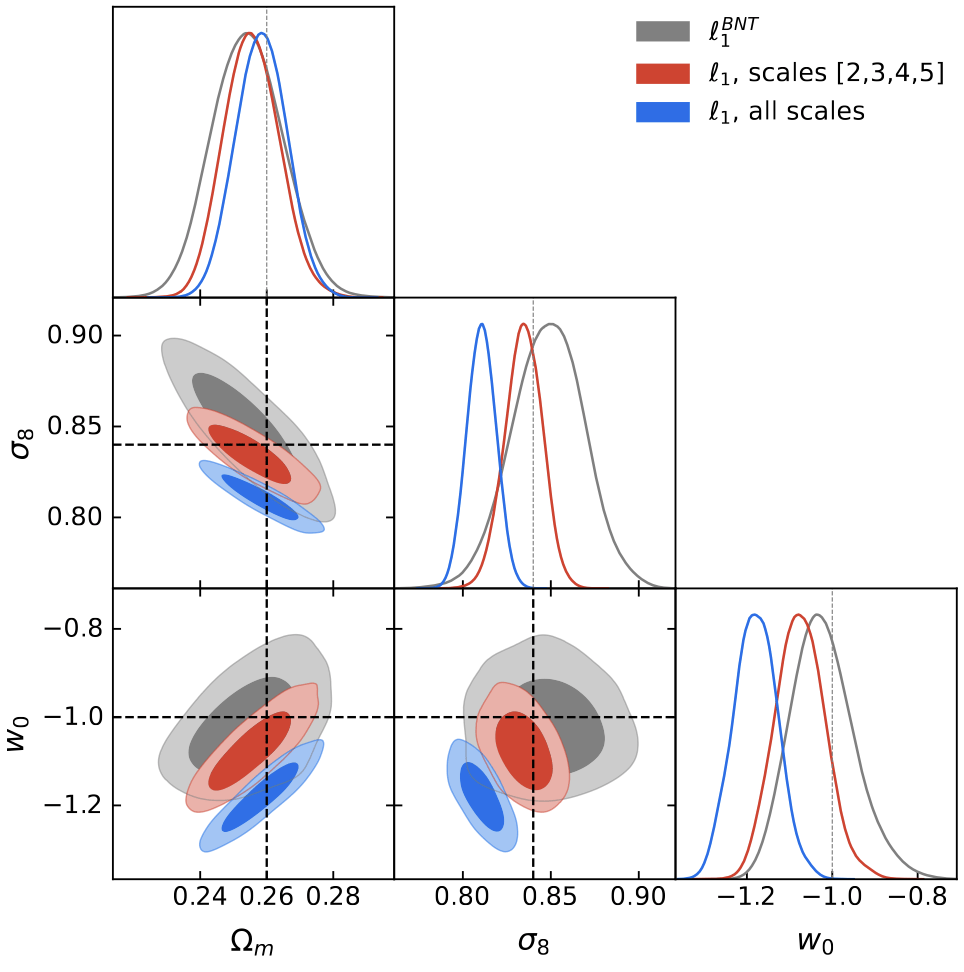
l1-norm
* This could help mitigate baryonic effects by optimally removing sensitivity to poorly modeled small scales and controlling scale leakage?
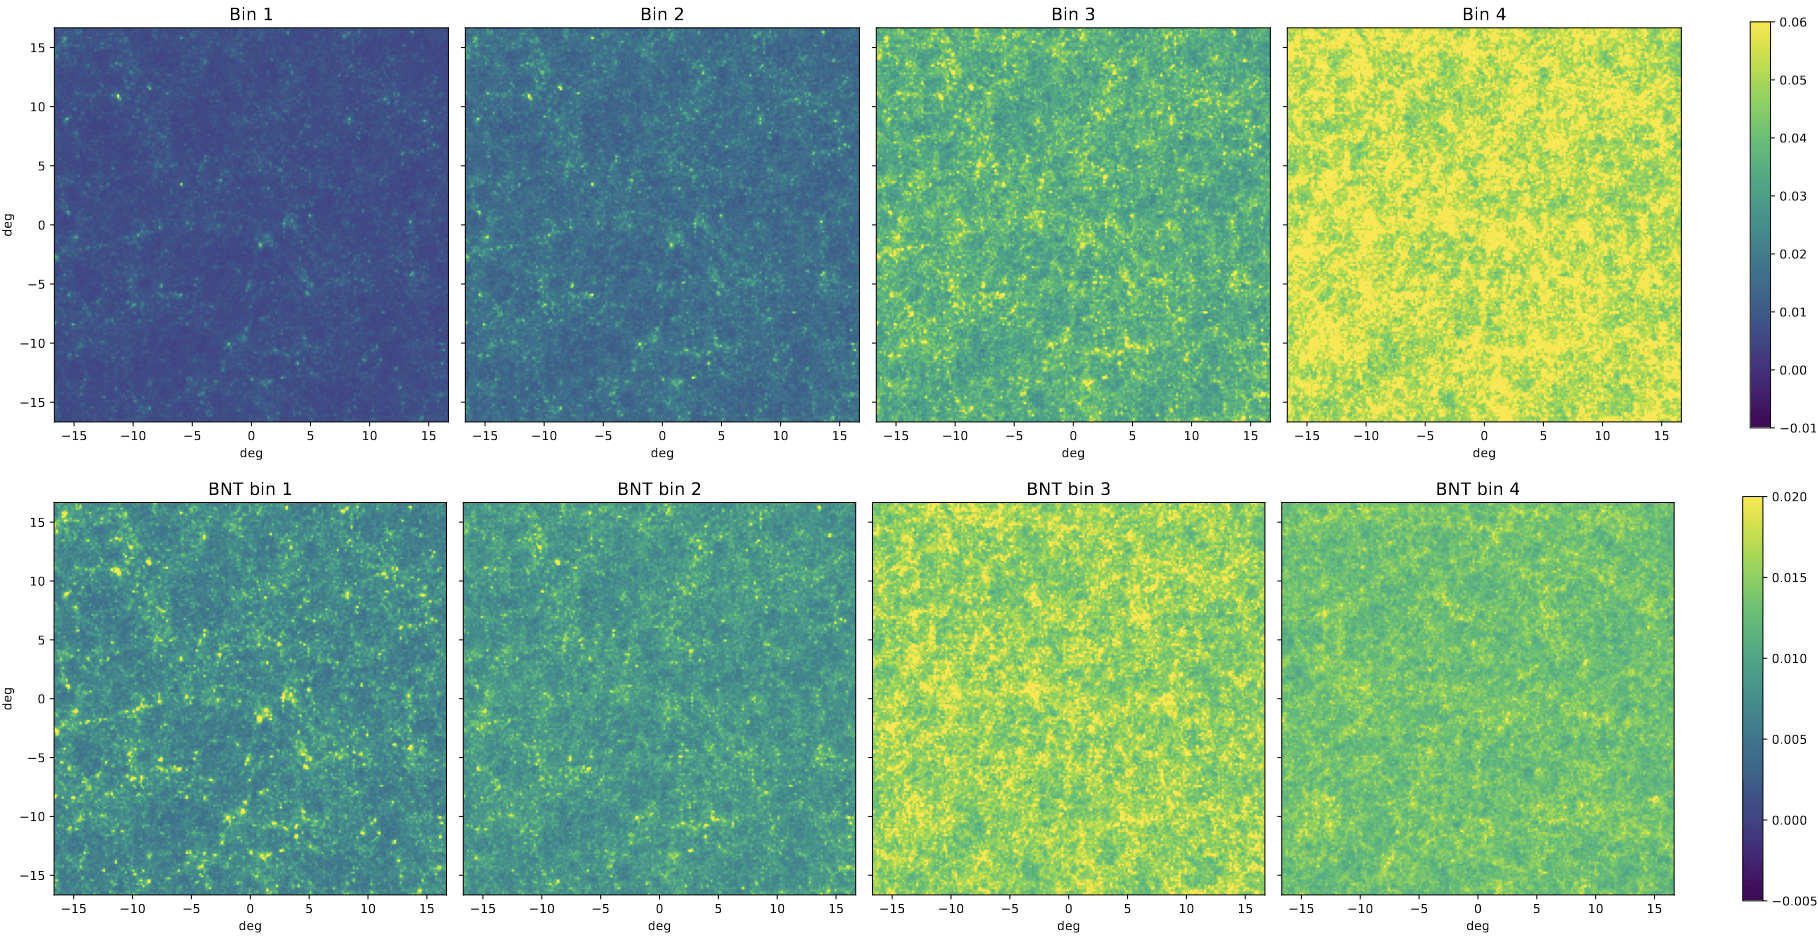
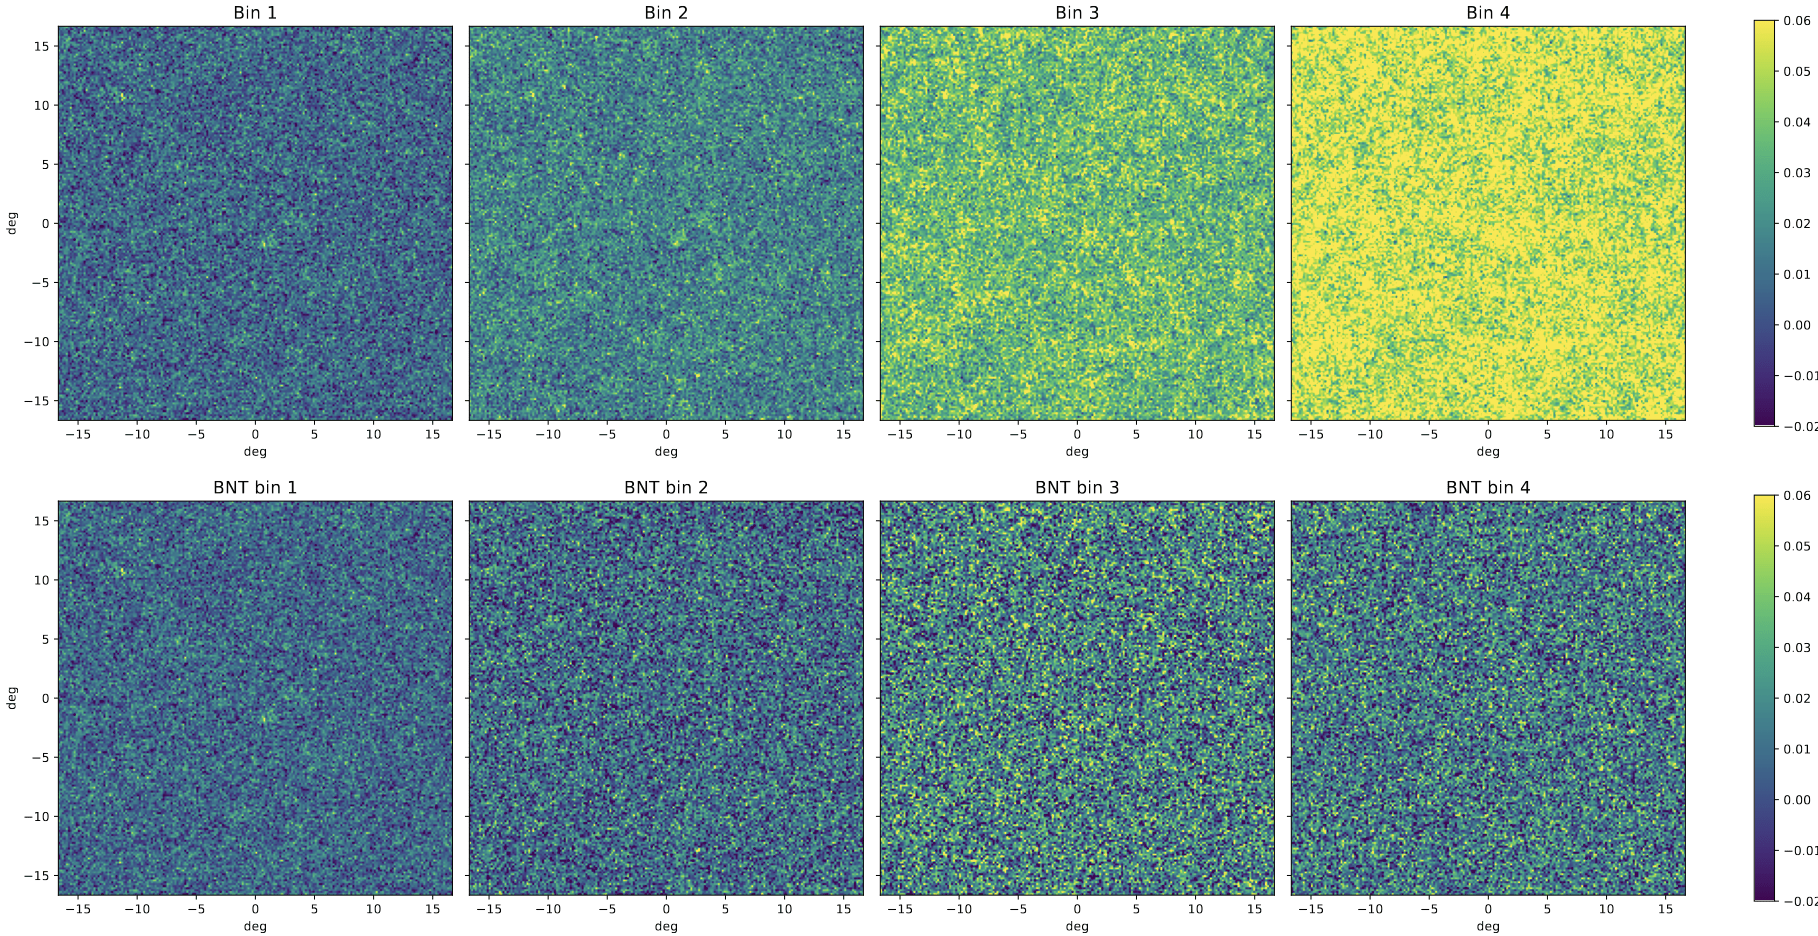
Take a look at the maps again..
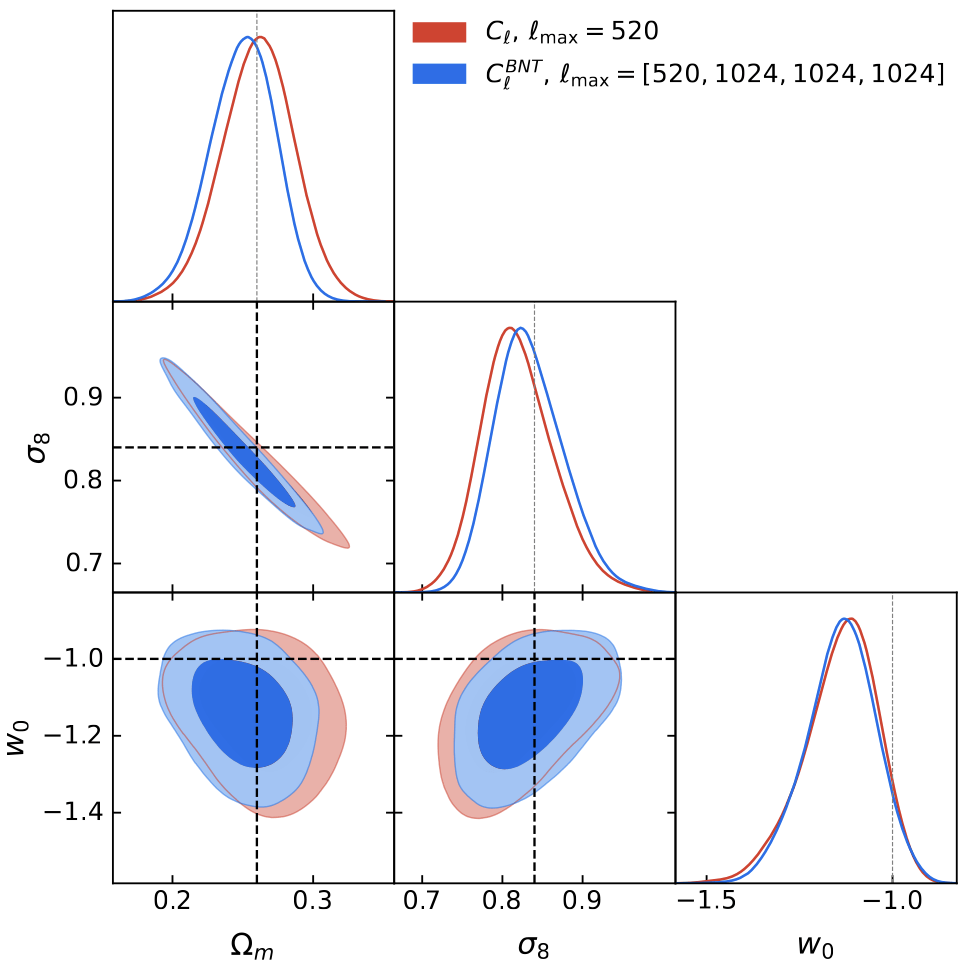
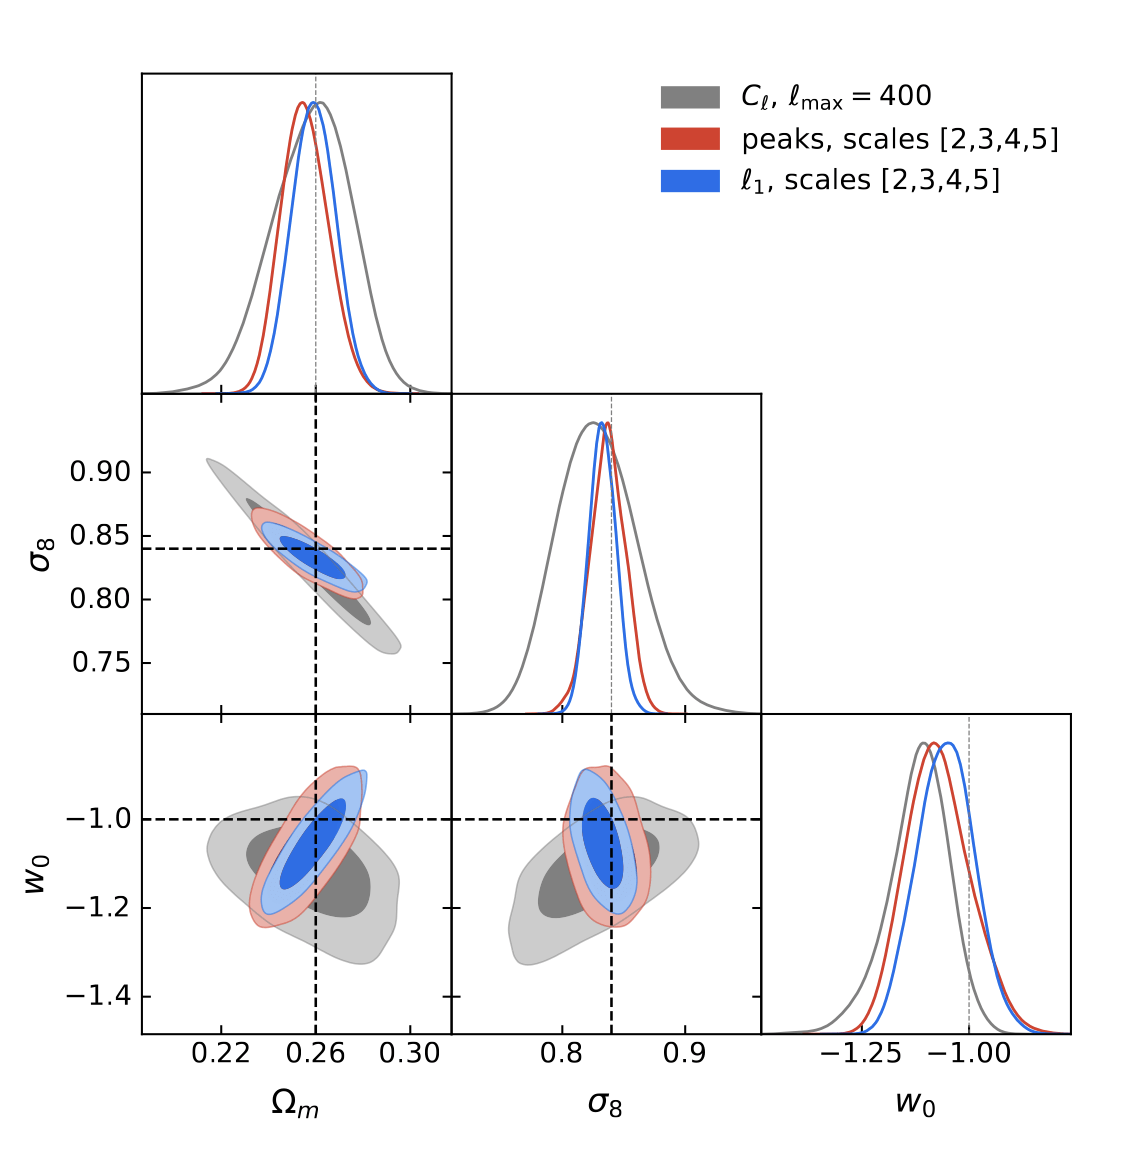
PS without scale cuts
PS with scale cuts
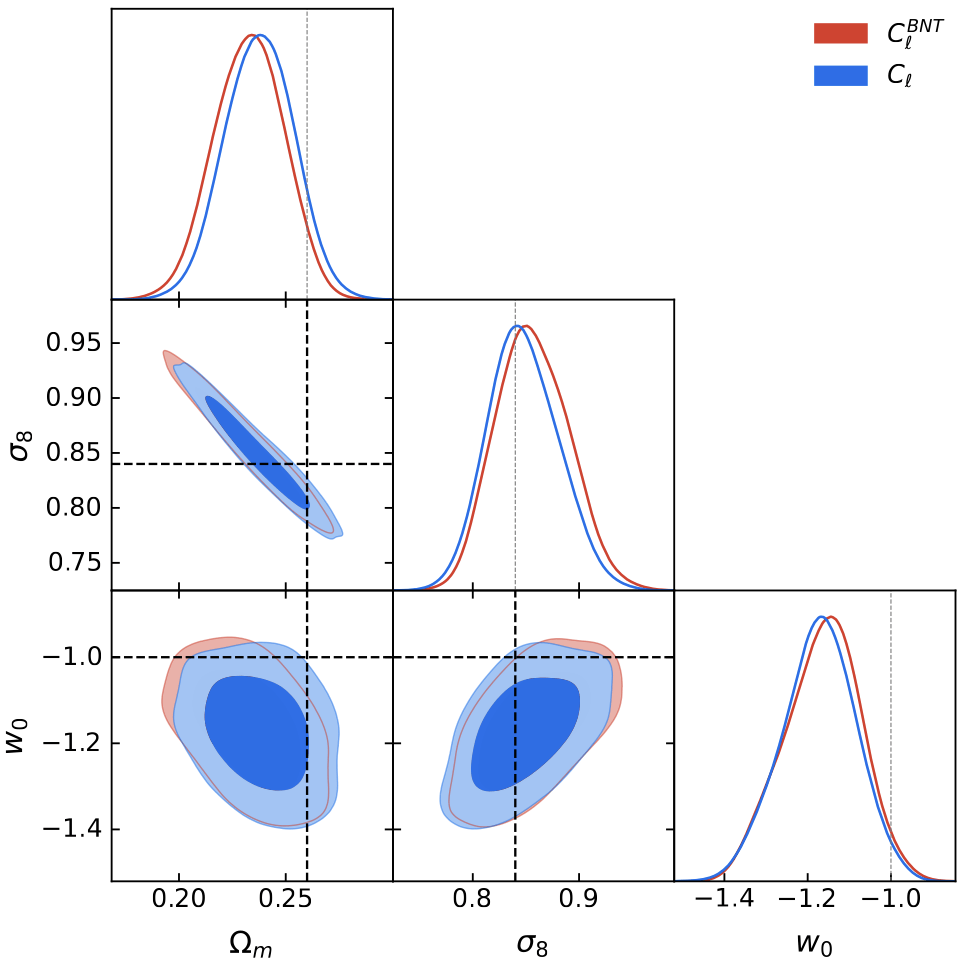
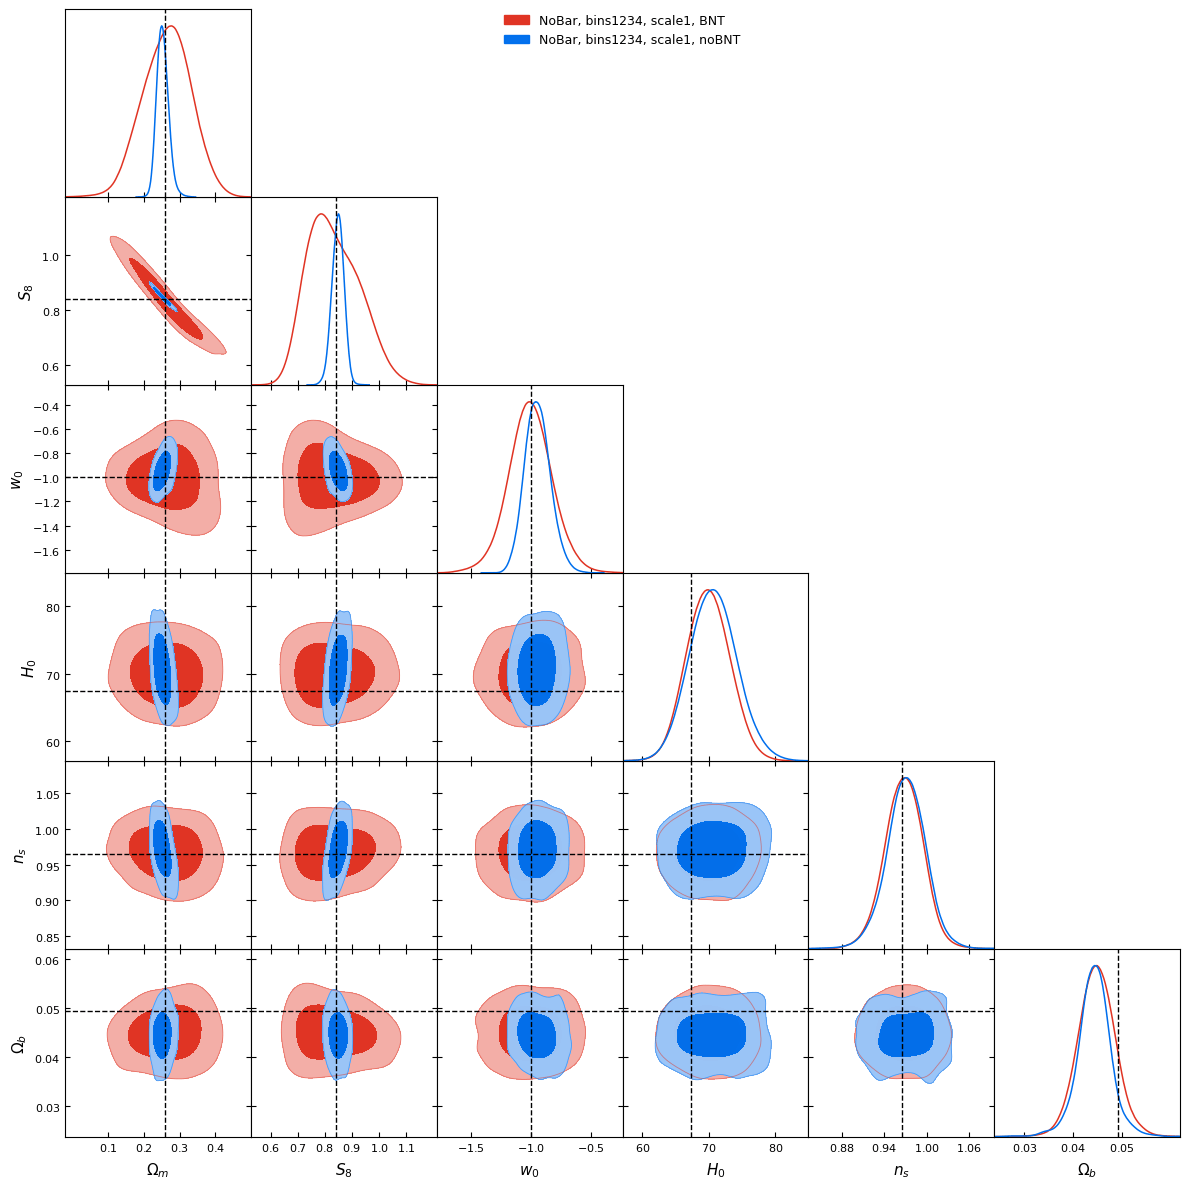
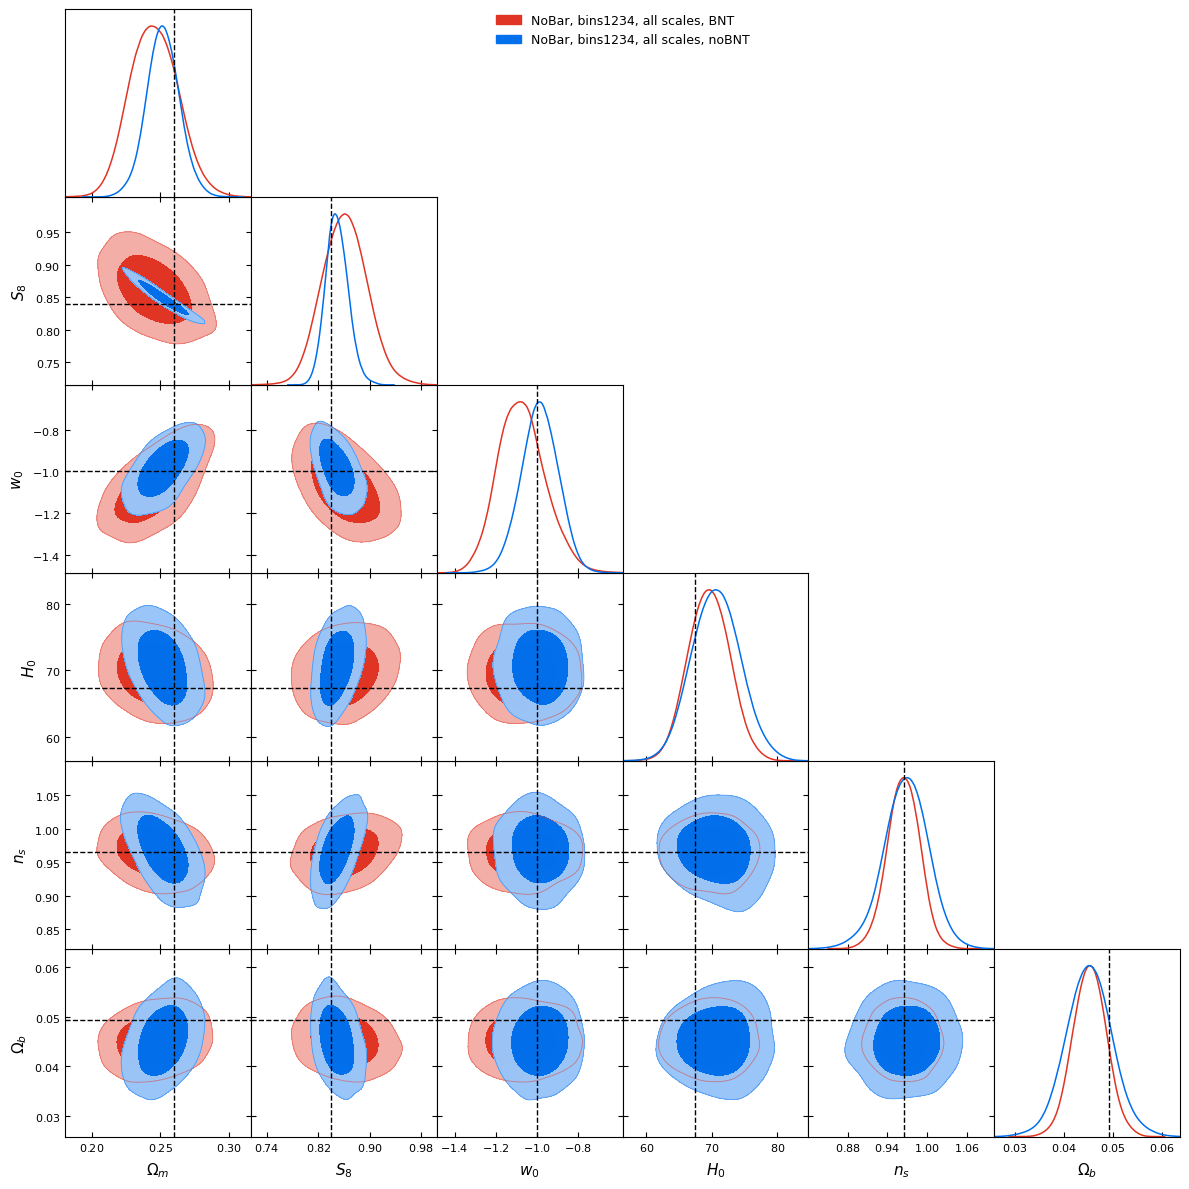
BNT vs Standard contours
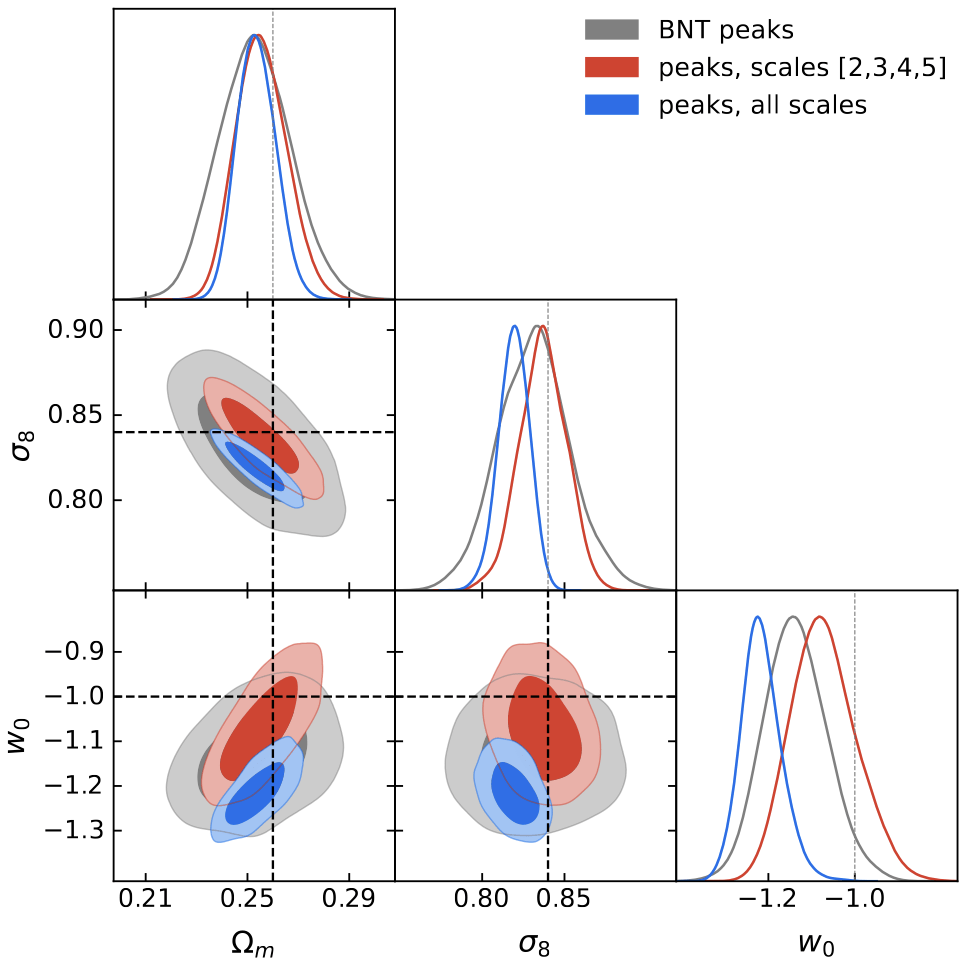
Peaks
l1-norm
Mass mapping and cosmological inference with higher-order statistics
Andreas Tersenov
ARGOS-TITAN-TOSCA workshop, July 8, 2025
Why this presentation may not be the best


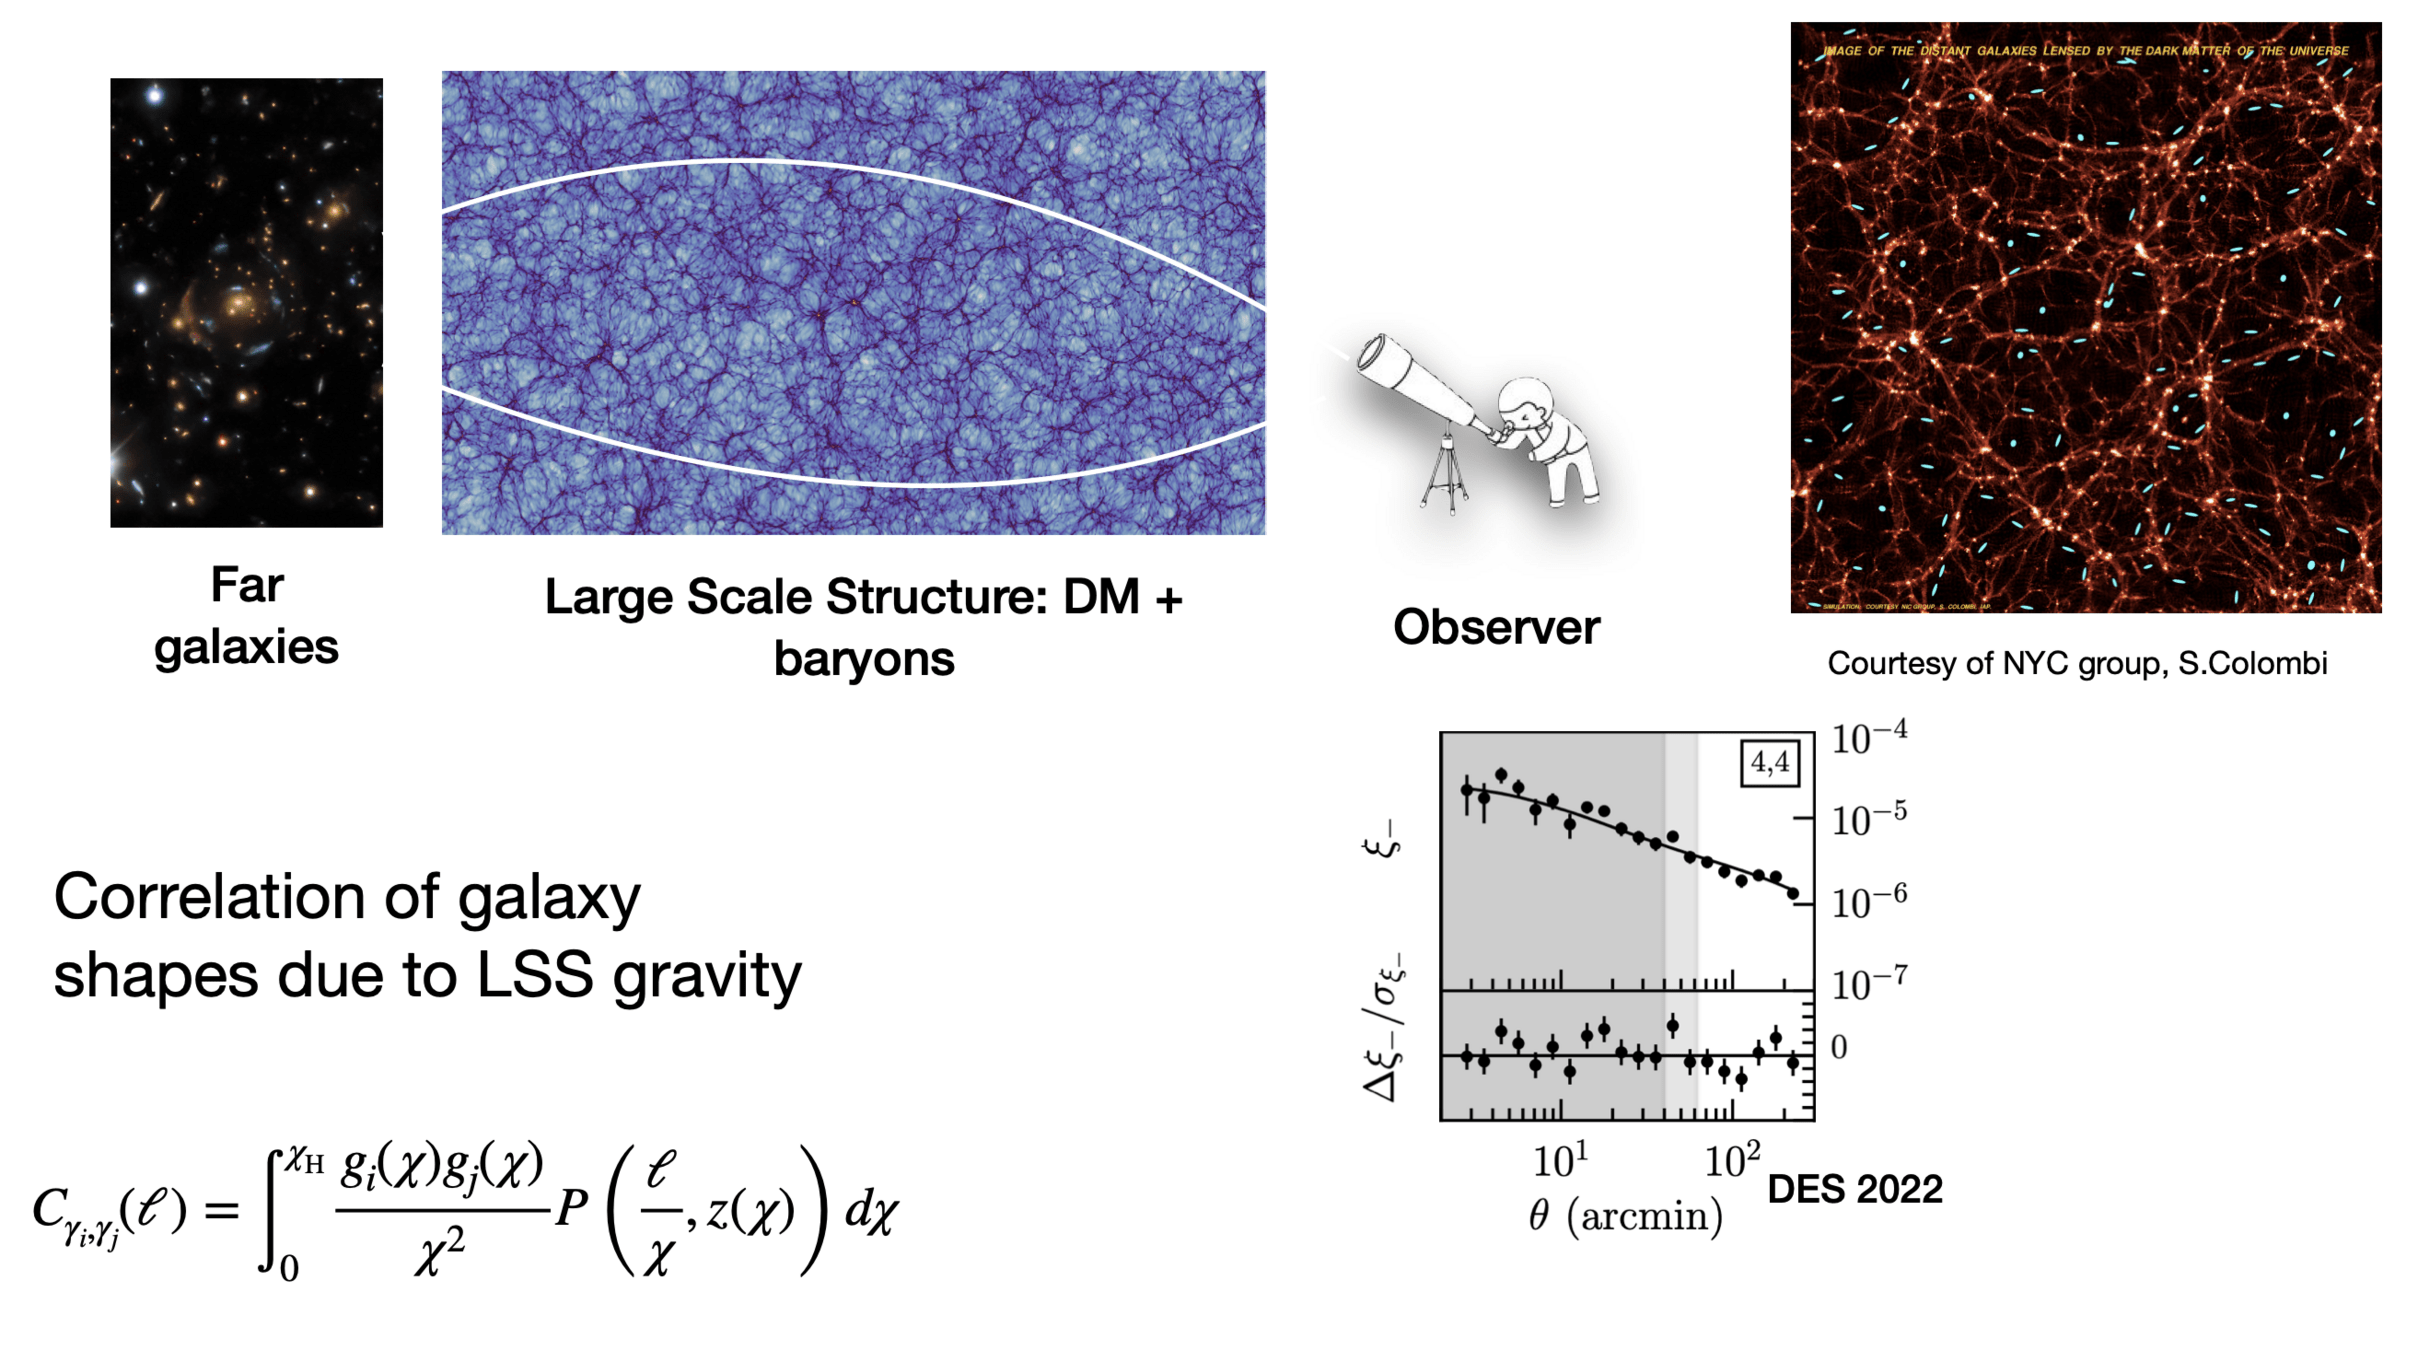
Weak Lensing - Relation between
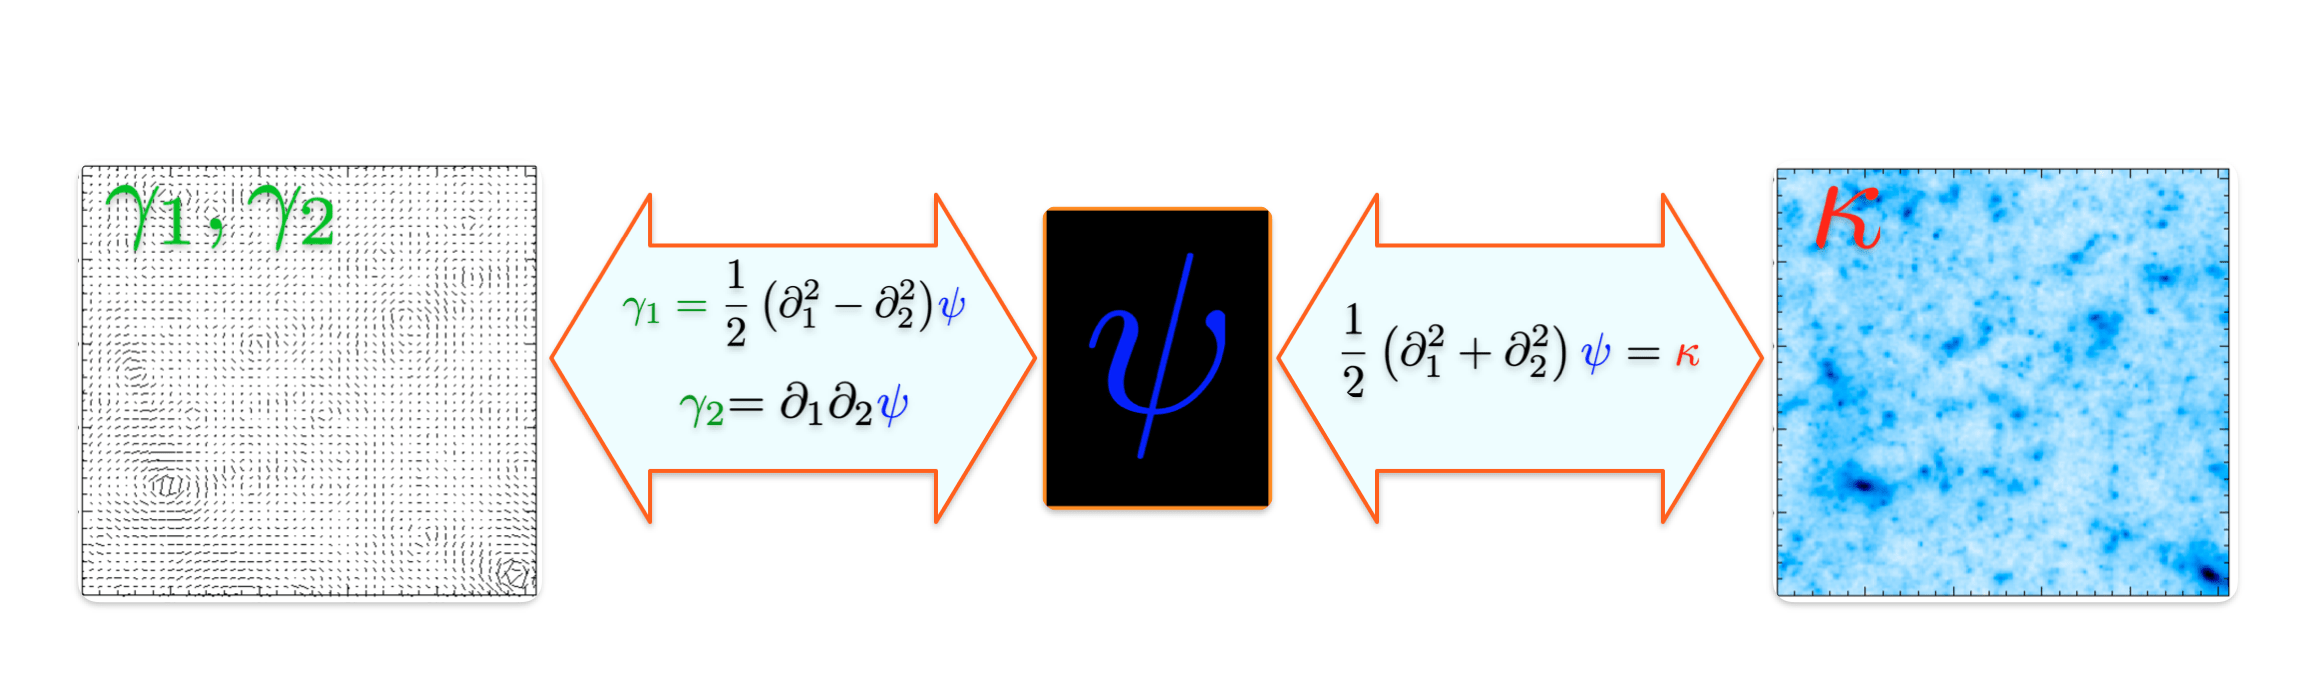
- From convergence to shear:
- From shear to convergence:
In practice...
- Shear measurements are discrete, noisy, and irregularly sampled
- We actually measure the reduced shear
- Masks and integration over a subset of ℝ2 lead to border errors ⇒ missing data problem
- Convergence is recoverable up to a constant ⇒ mass-sheet degeneracy problem
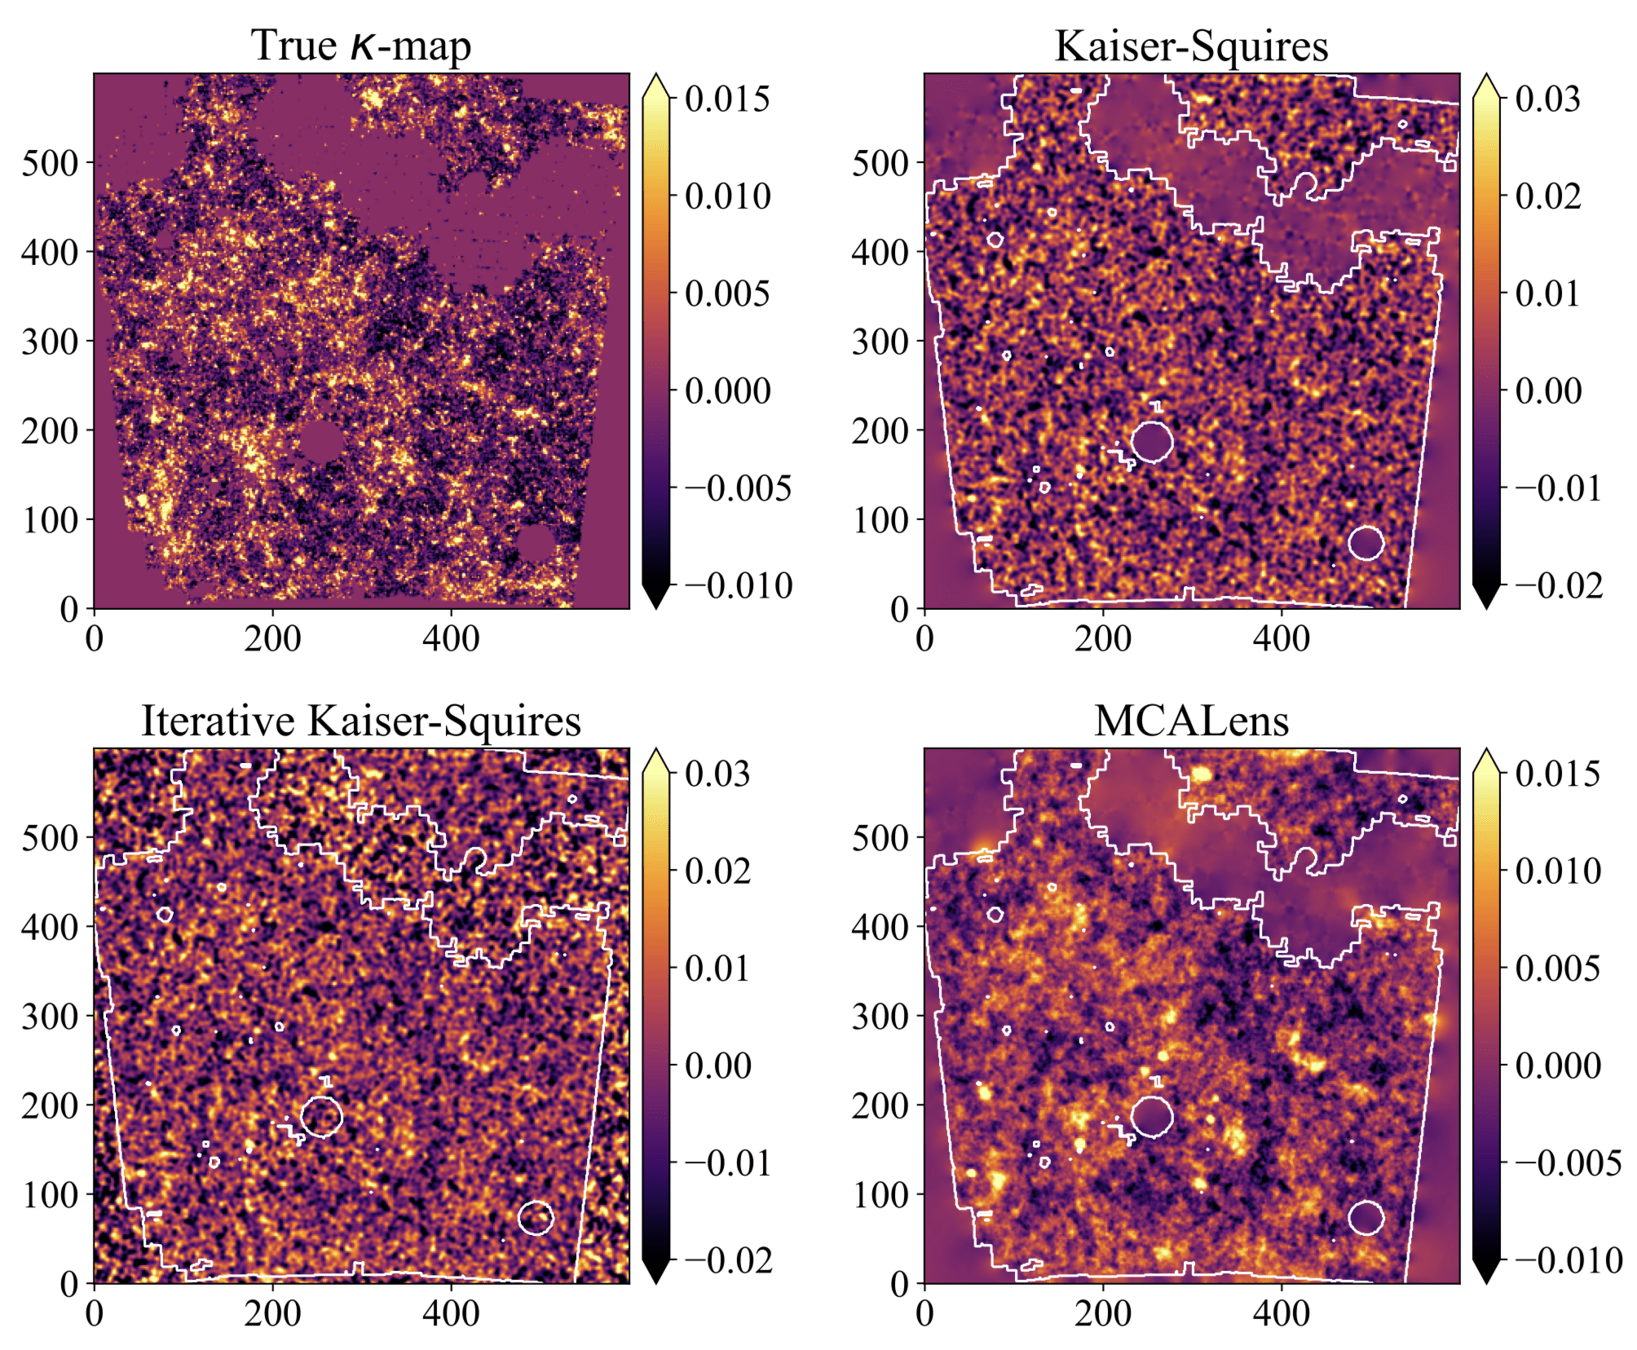
Mass mapping is an ill-posed inverse problem
Different algorithms have been introduced, with different reconstruction fidelities, in terms of RMSE
Motivating this project:
- The various algorithms have different RMSE performance
- In cosmology we don't care about RMSE of mass maps, but only about the resulting cosmological parameters
⇒ This should be our final benchmark!
So... does the choice of the mass-mapping algorithm have an impact on the final inferred cosmological parameters?
Or as long as you apply the same method to both observations and simulations it won't matter?
cosmoSLICS mass maps
For which we have/assume an analytical likelihood function
How to constrain cosmological parameters?
Likelihood → connects our compressed observations to the cosmological parameters
2pt vs higher-order statistics
The traditional way of constraining cosmological parameters misses the non-Gaussian information in the field.
DES Y3 Results
Impact of Baryonic Feedback on Cosmological Constraints from Weak Lensing
Andreas Tersenov
Deep CosmoStat Days, Feb 12, 2026
Higher Order Statistics: Peak Counts
=
+
+
+
+
- Peaks: local maxima of the SNR field
- Peaks trace regions where the value of 𝜅 is high → they are associated to massive structures
Multi-scale (wavelet) peak counts
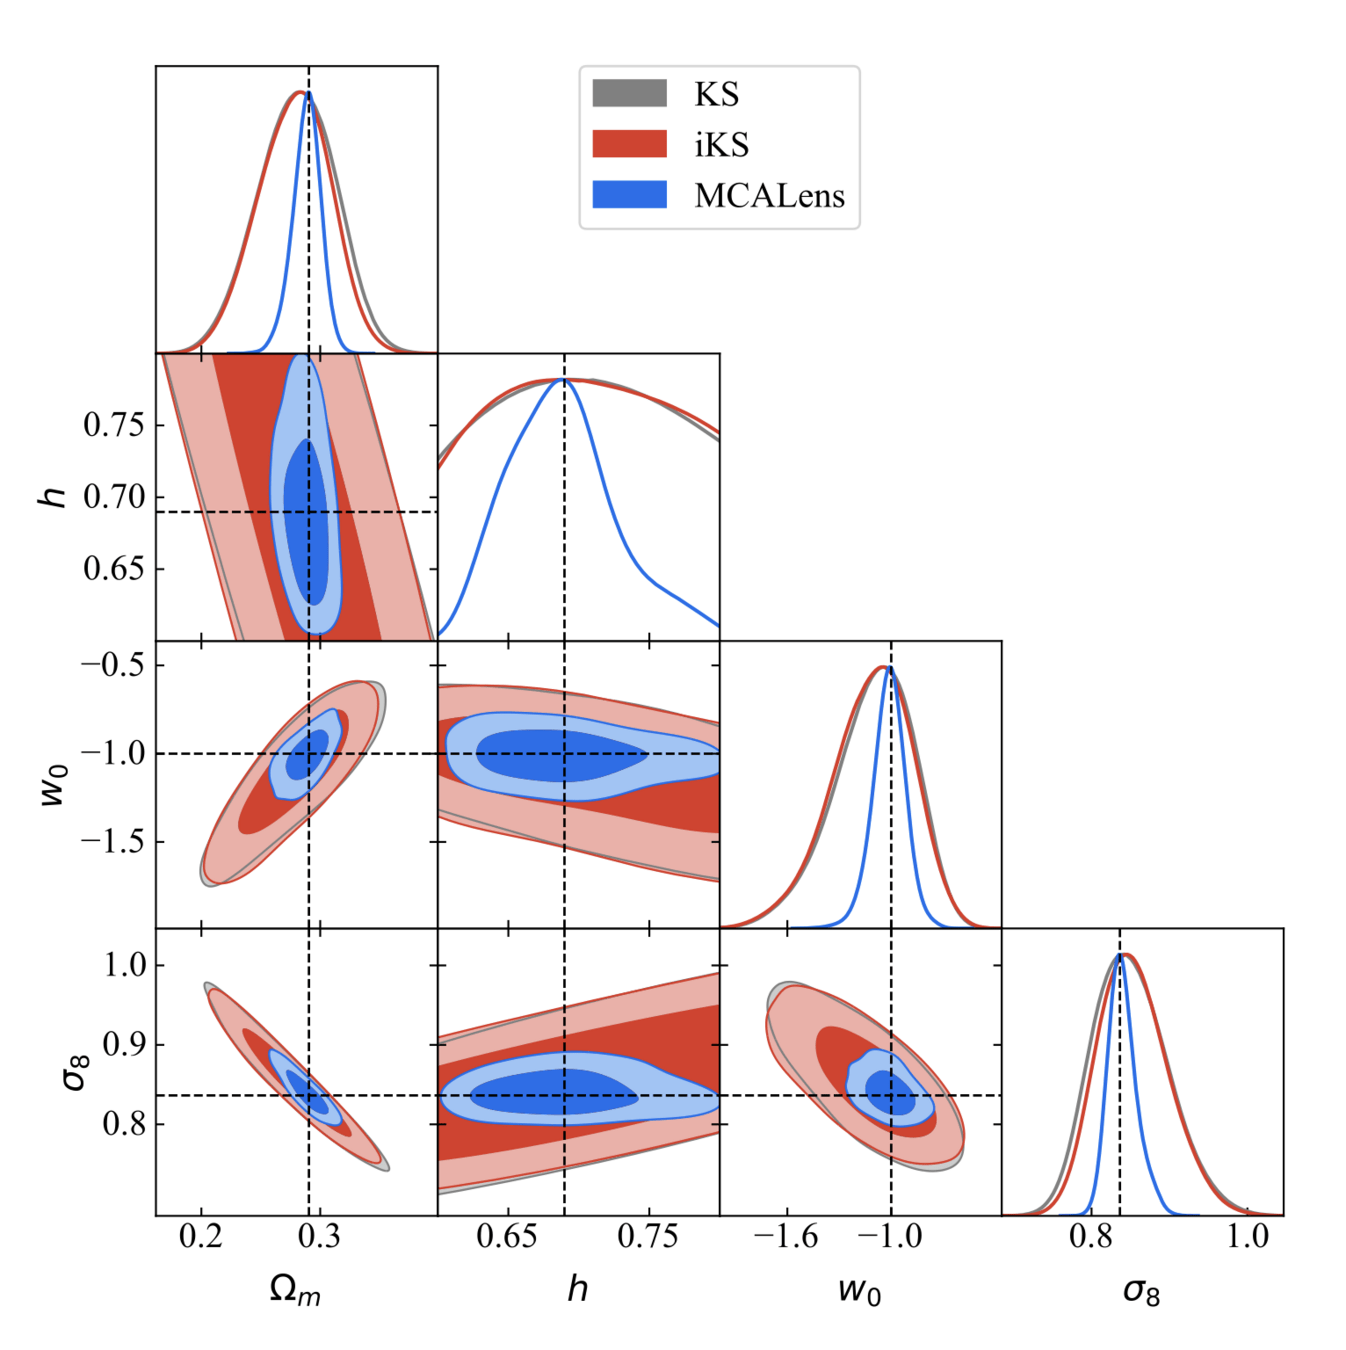
Results
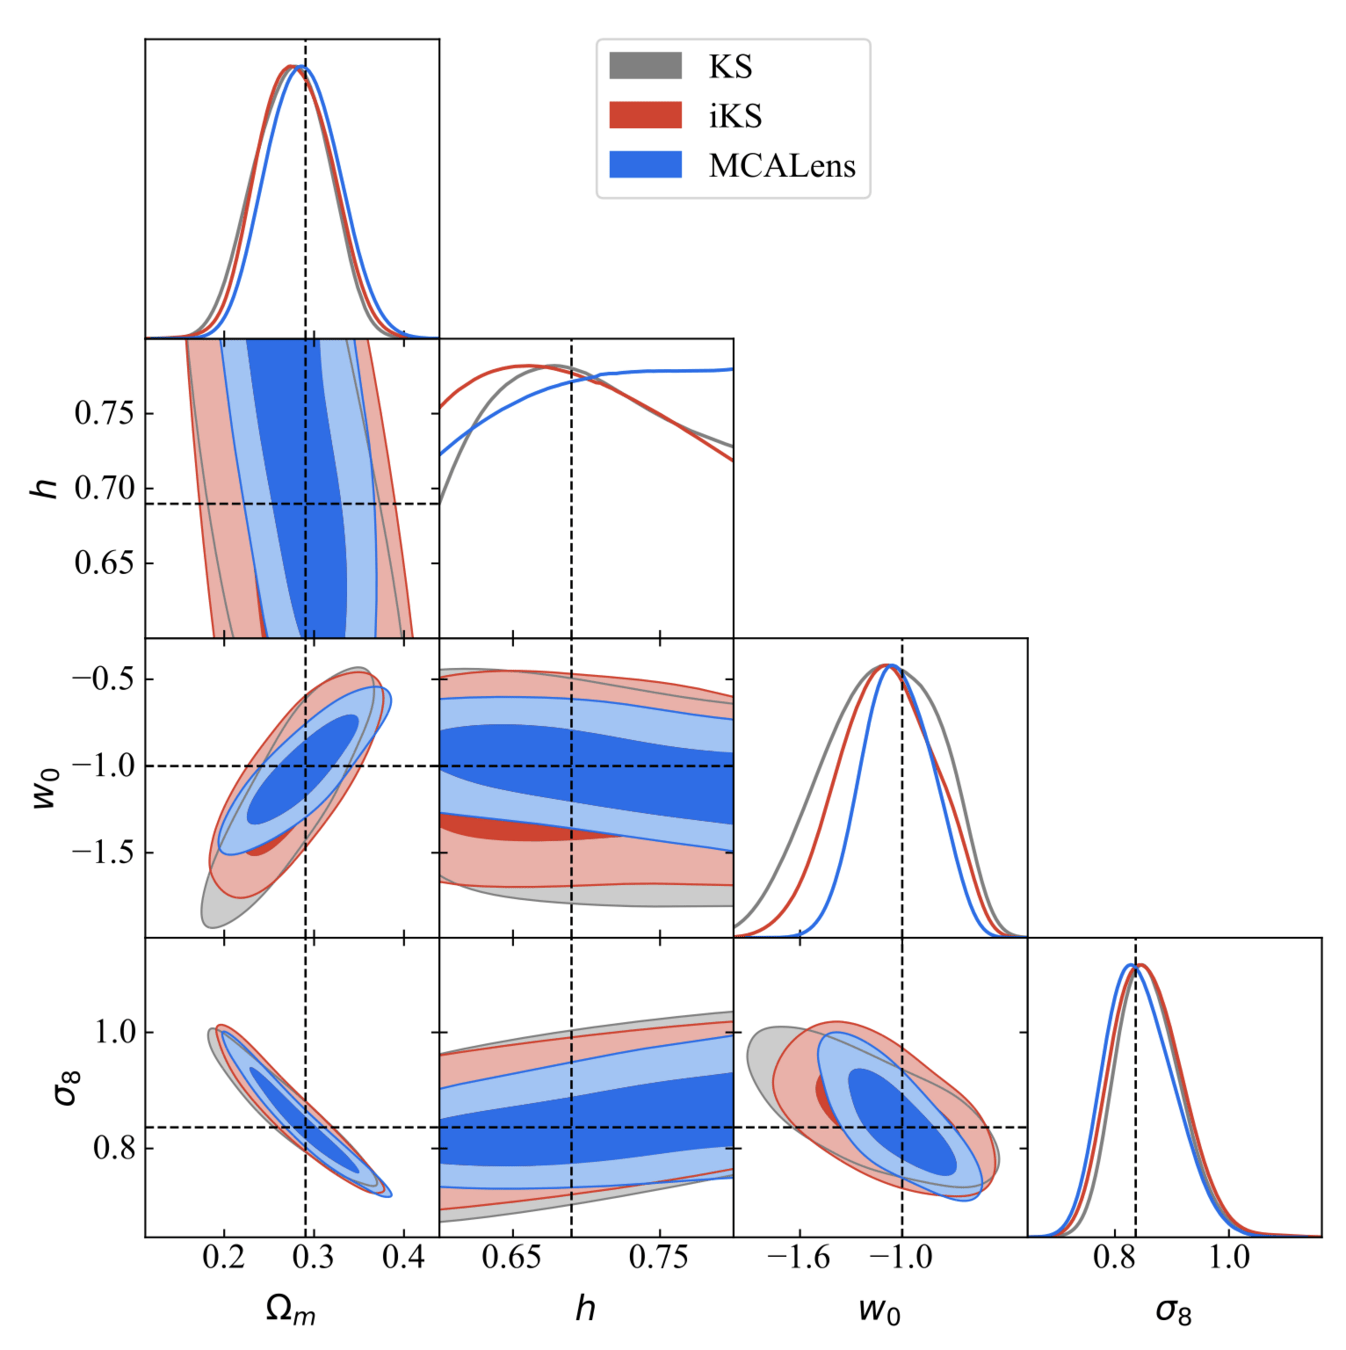
Mono-scale peaks
Multi-scale peaks
Where does this improvement come from?
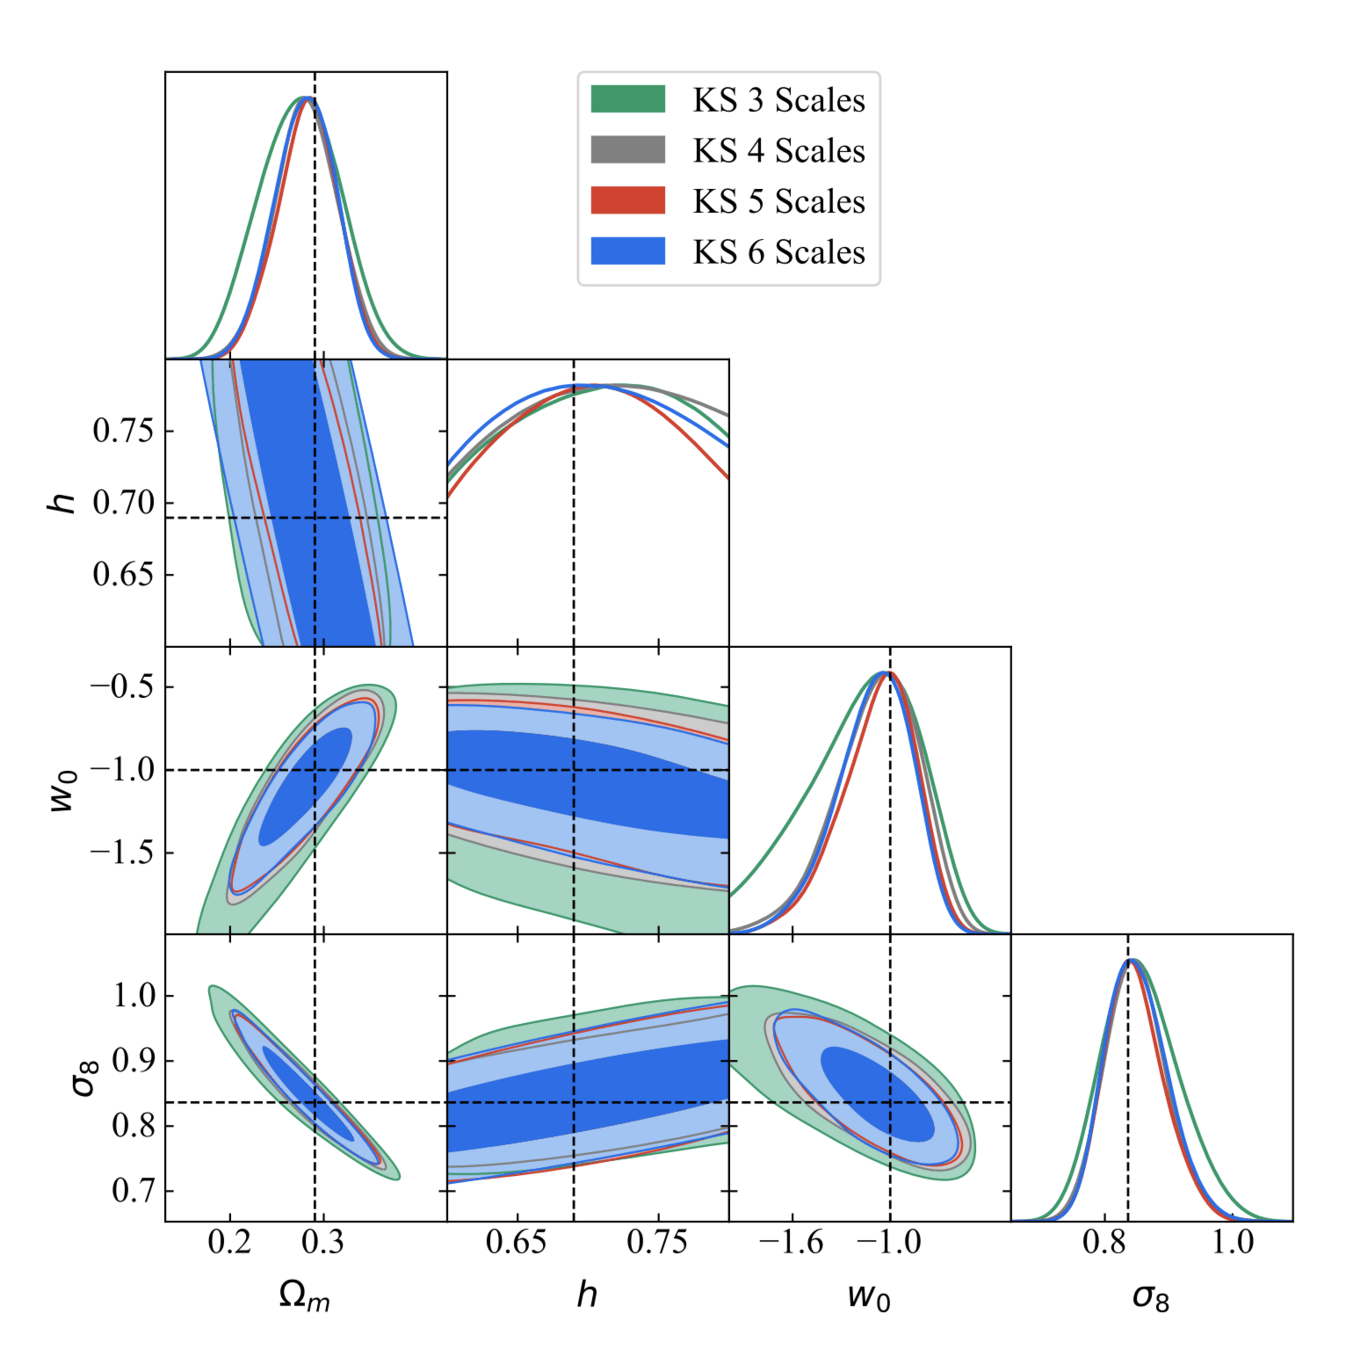
Kaiser-Squires
MCALens
Baryonic effects
- Effects that stem from astrophysical processes involving ordinary matter (gas cooling, star formation, AGN feedback)
-
They modify the matter distribution by redistributing gas and stars within halos.
-
Suppress matter clustering on small scales
- Depend on the cosmic baryon fraction and cosmological parameters.
-
Must be modeled/marginalized over to avoid biases in cosmological inferences from WL.
Baryonic impact on LSS statistics
baryonic effects in P(k)
Credit: Giovanni Aricò
Project: Testing impact baryonic effects on WL HOS
Idea - Explore two things:
- Information content of summary statistics as a function of scale cuts
- Testing the impact of baryonic effects on posterior contours
This will show:
- On what range of scales can the different statistics be used without explicit model for baryons
- Answer the question: how much extra information beyond the PS these statistics can access in practice
cosmoGRID simulations
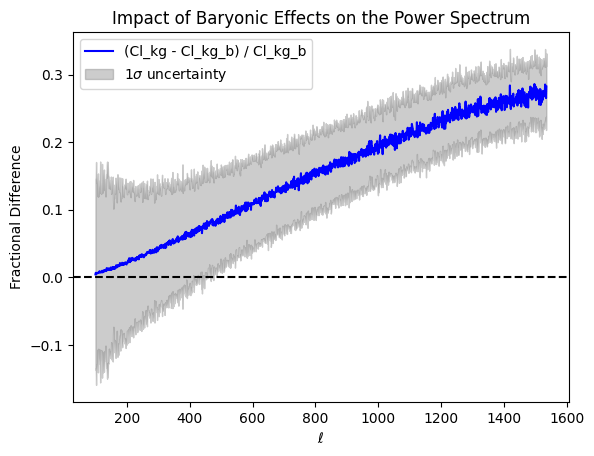
Power Spectrum
Wavelet l1-norm
Inference method: SBI
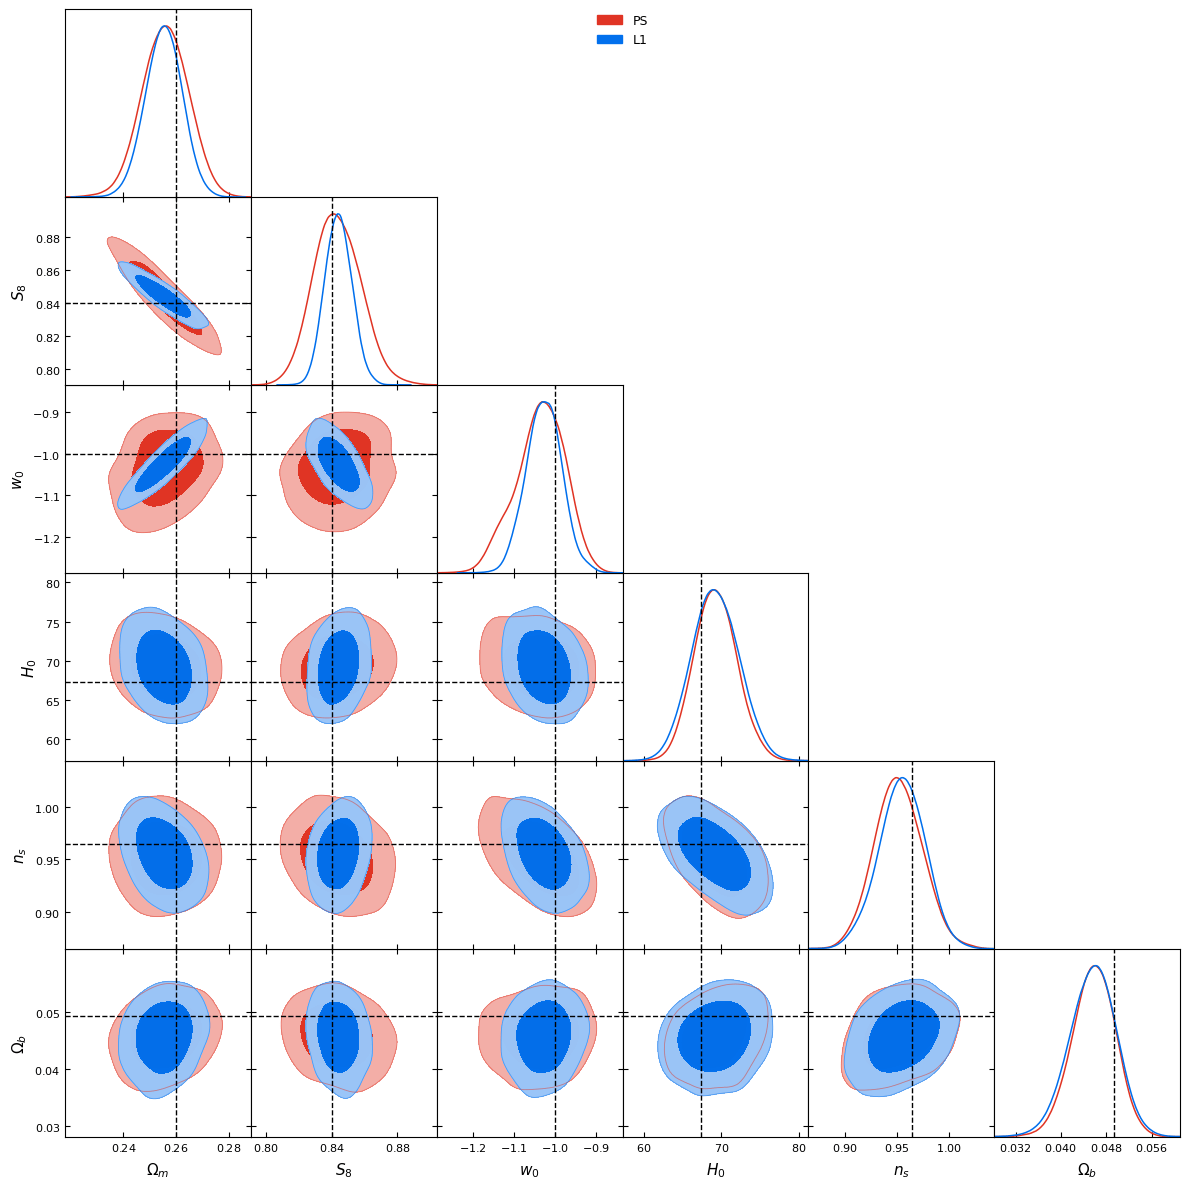
Power spectrum vs l1-norm (scale: ~10arcmin)
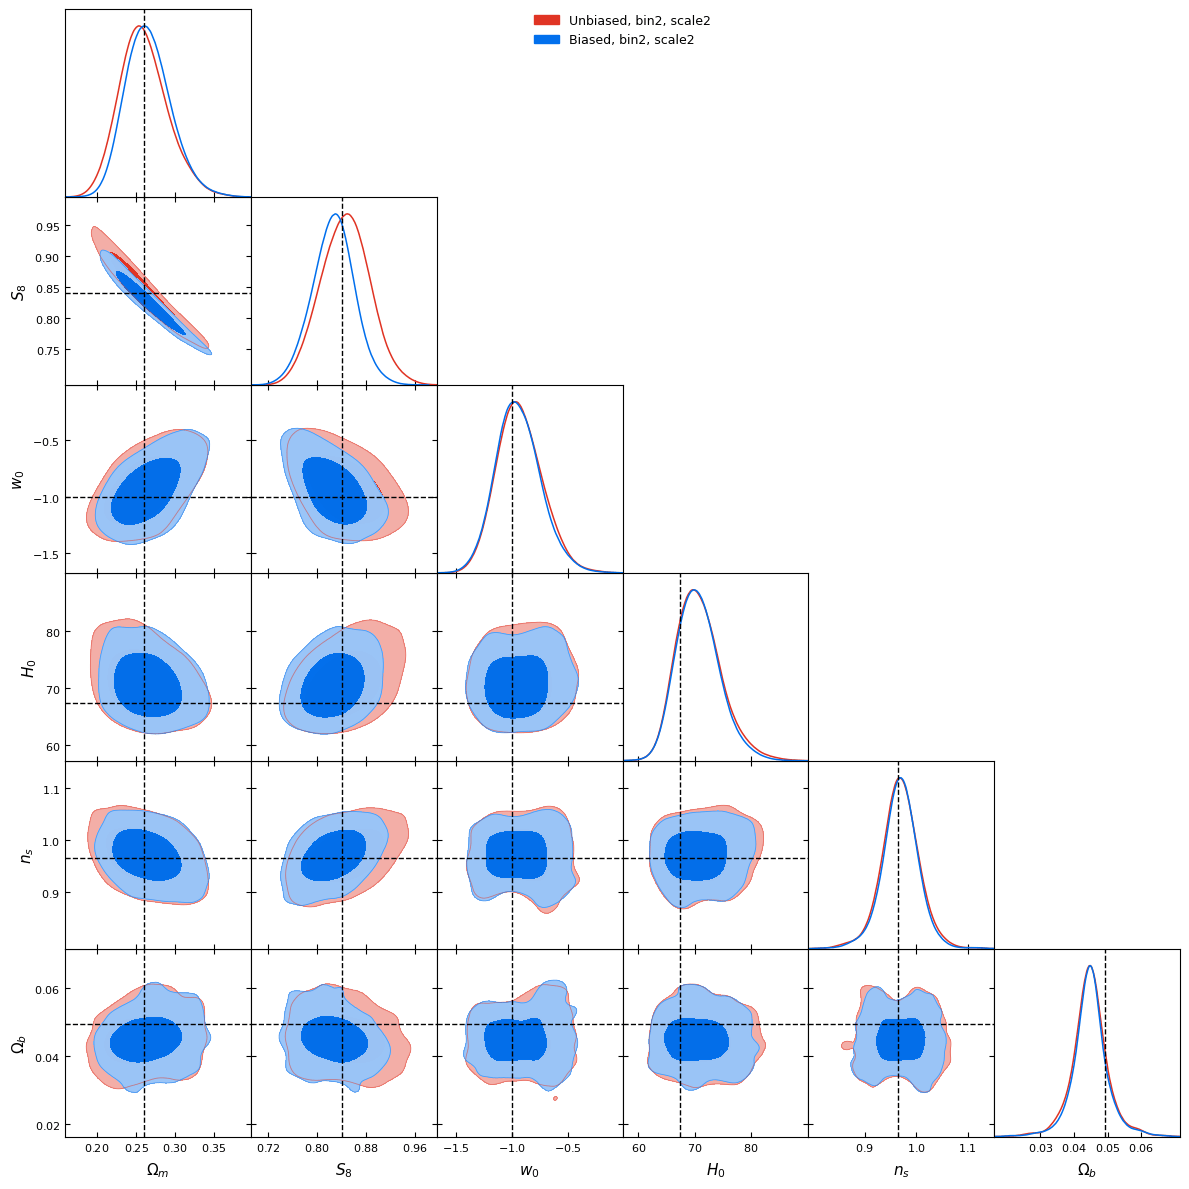
What about the baryonic effects? Do we have any bias?
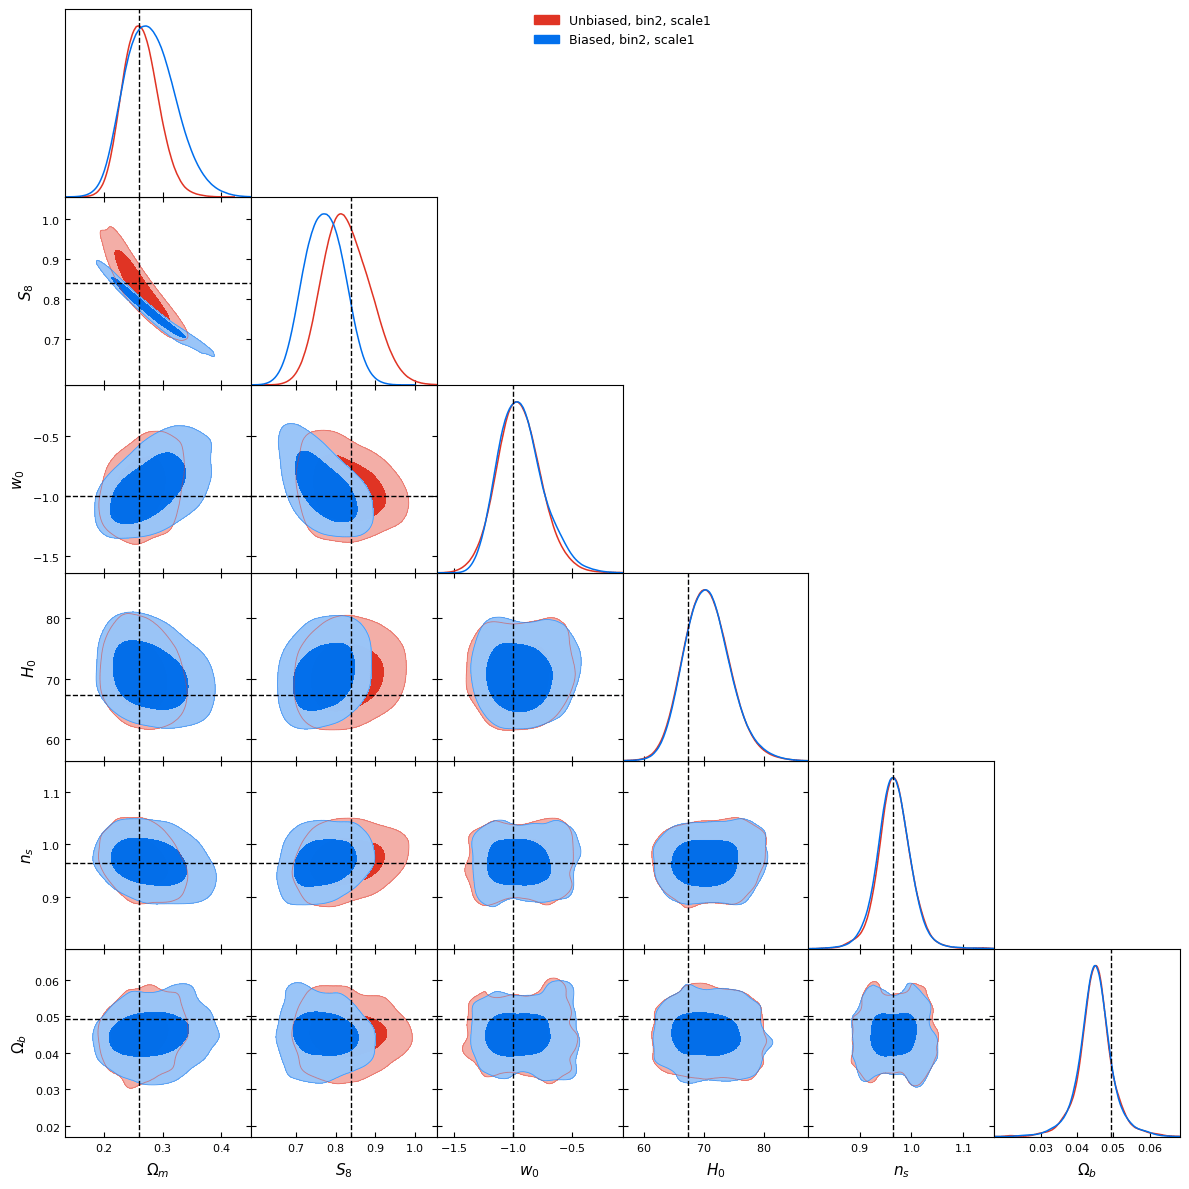
l1-norm, scale 1 (~10arcmin)
l1-norm, scale 2 (~20arcmin)
Weak lensing tomography
BNT transform
- When we observe cosmic shear, contributions come from mass at different redshifts.
- This creates projection effects: large and small-scale structures get mixed up.
- These effects make it harder to accurately analyze data and extract information
BNT transform
- BNT Transform: A method to “null” or remove contributions from unwanted redshift ranges.
- It reorganizes the weak-lensing data so that only specific redshift ranges contribute to the signal, making it easier to analyze.
- It focuses on isolating lensing contributions by sorting out overlapping signals.
How are statistics impacted?
What about contours?
Scale 1 (~7arcmin)
Multiscale
Why this reduction in constraining power?

no BNT
BNT
Hope: Neural Summaries (VMIM)
Hope: Neural Summaries (VMIM)