Here is the video for this talk:
https://www.youtube.com/watch?v=iqSbMjaYyIk
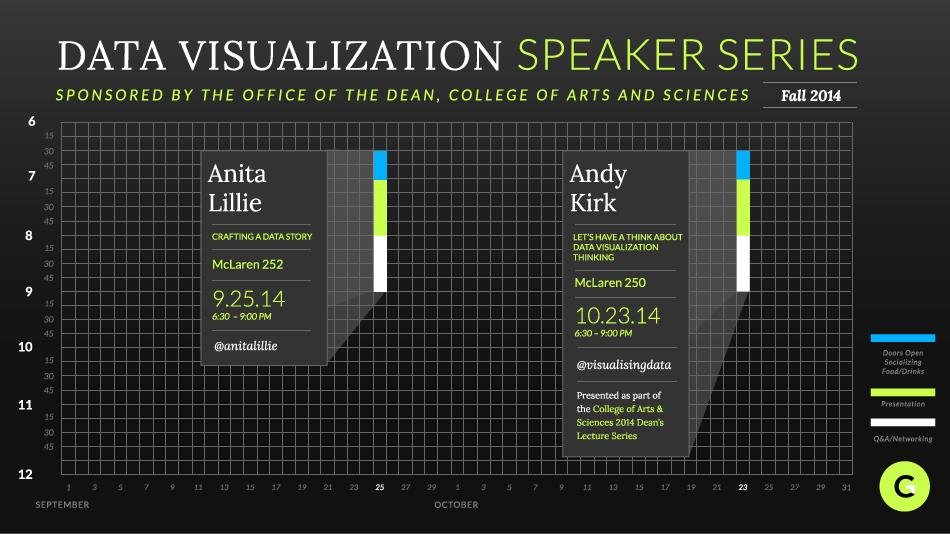
How to craft a data story
Anita Lillie
September 25, 2014
Data from this talk:
http://bit.ly/1Cig4zh
Who are we?


me
Where we live

Mountain View
I live in
What we like to do
"cat"
"lettering"
"making a zine"

2
2
1
Happiest age

Who am I?
- Previously: LinkedIn, Nokia, MIT Media Lab, Stanford
- Music, social networks, genetics, healthcare
- Data Scientist at Practice Fusion
I design and develop data interfaces.
What I'm not going to talk about
THINGS I LIKE TO TALK ABOUT
THINGS I DON'T LIKE TO TALK ABOUT
Big Data
Flan
Mountain biking
Previous work
Venn diagrams
Climbing
♥ Phil Collins ♥
What I am going to talk about
-
How to think about data stories
-
How to have empathy for your user
-
The creation process
-
Tests to check your work
Where I find inspiration...
The bulk aisle


Footsteps after a puddle


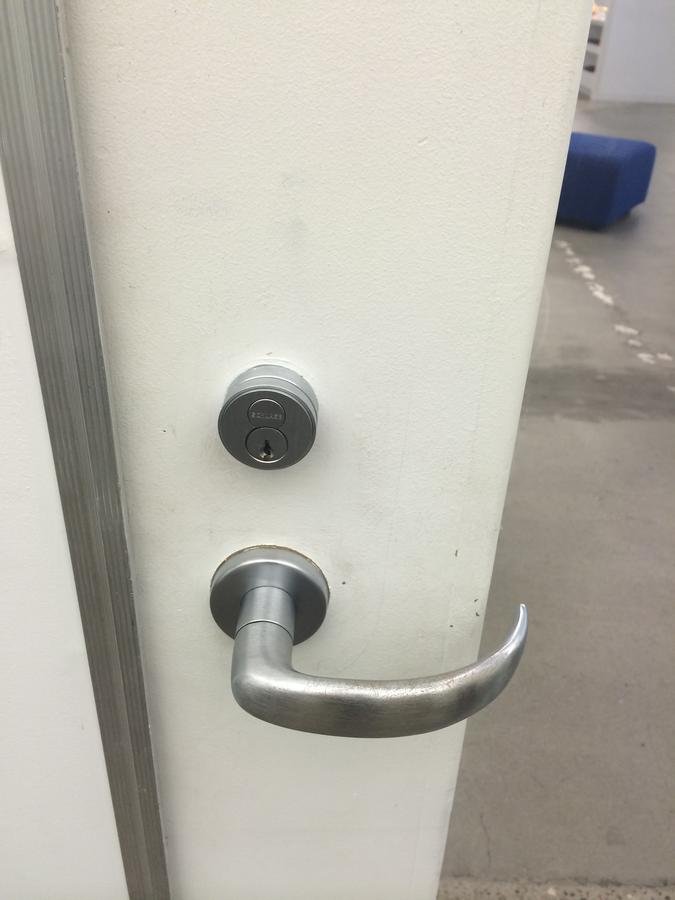
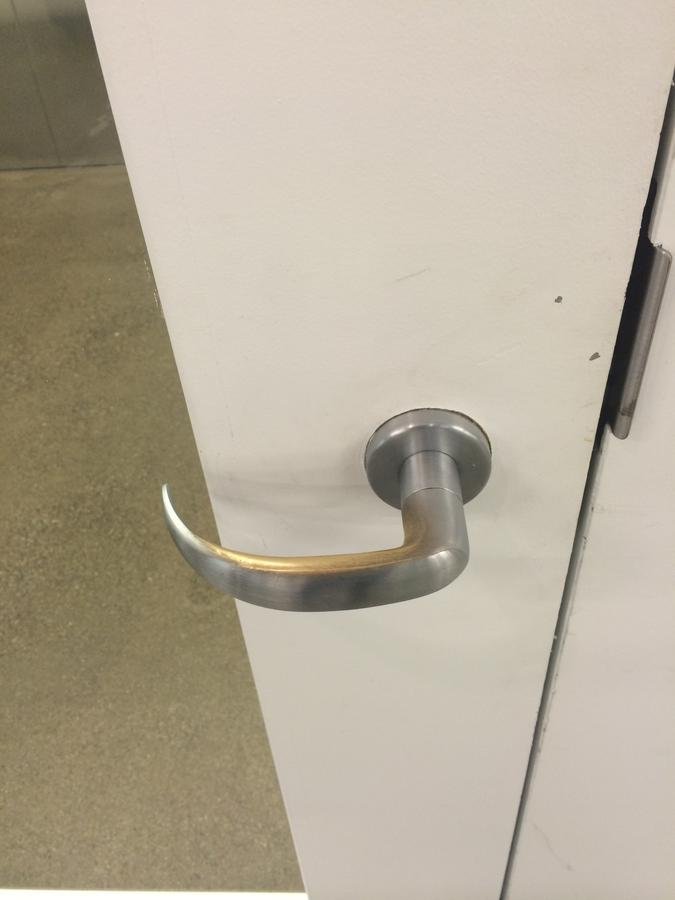
Wear on door handles
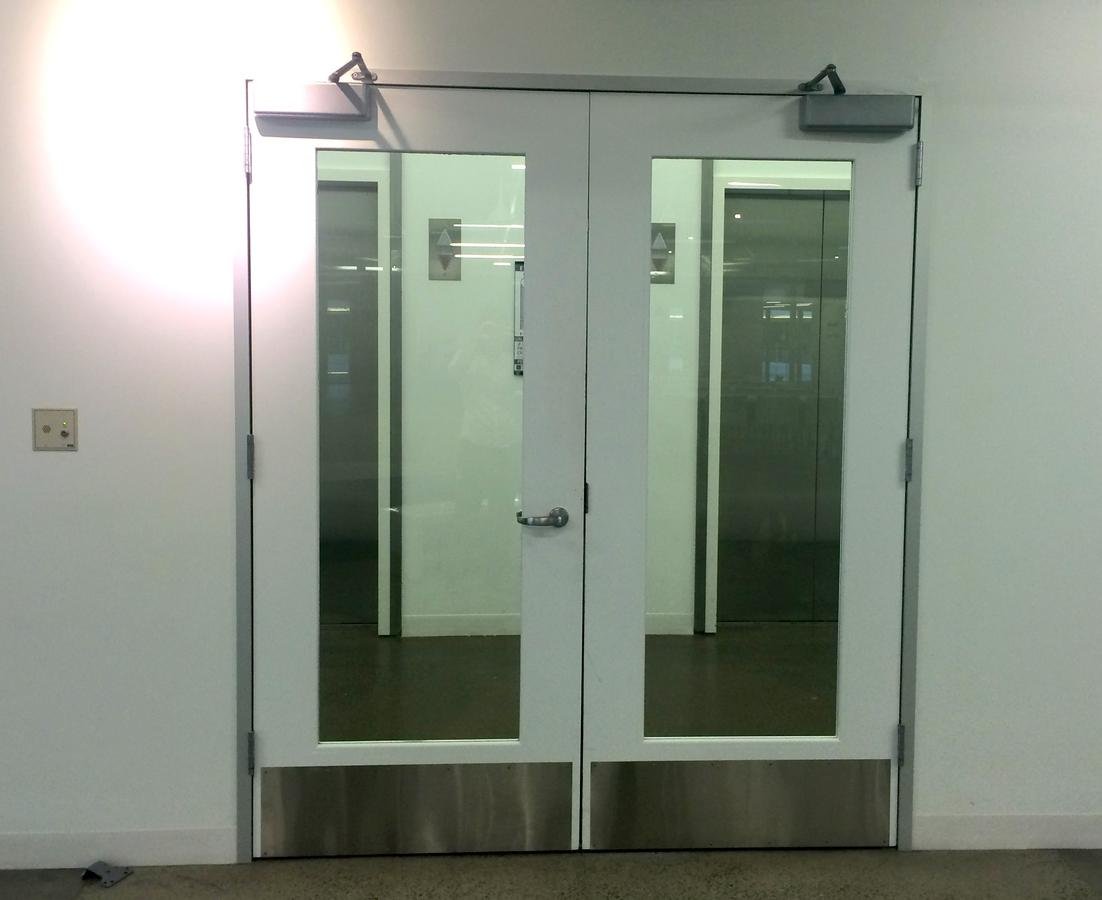
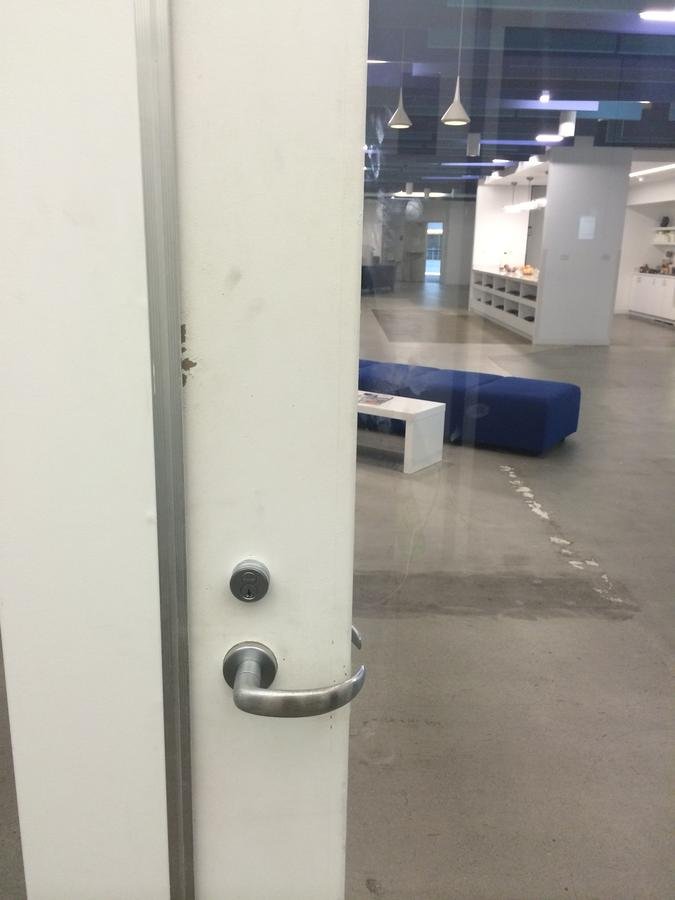
Push
Pull
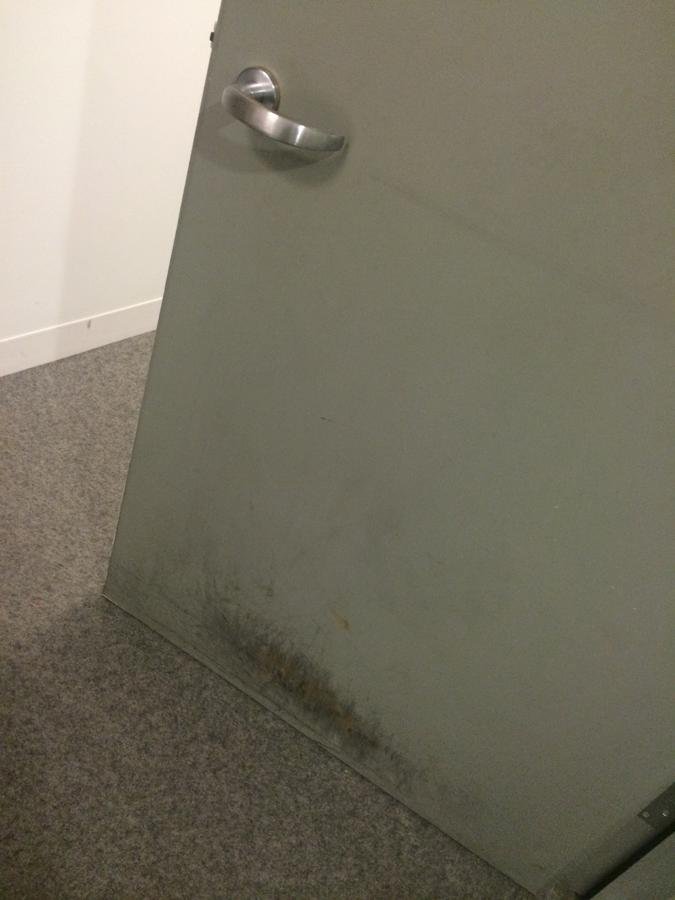
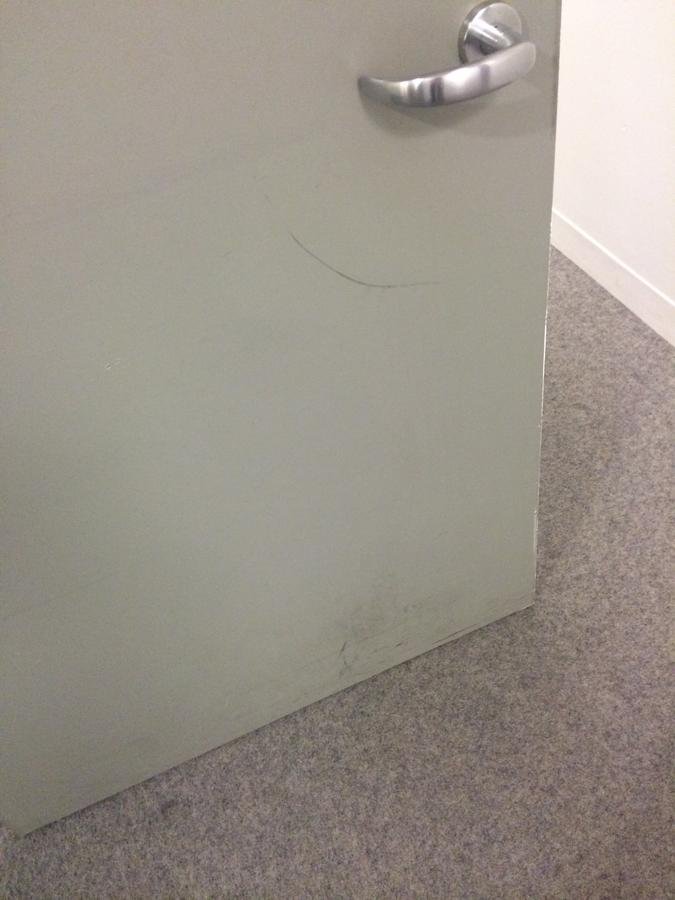
Wear on doors


Football fields


Tans.


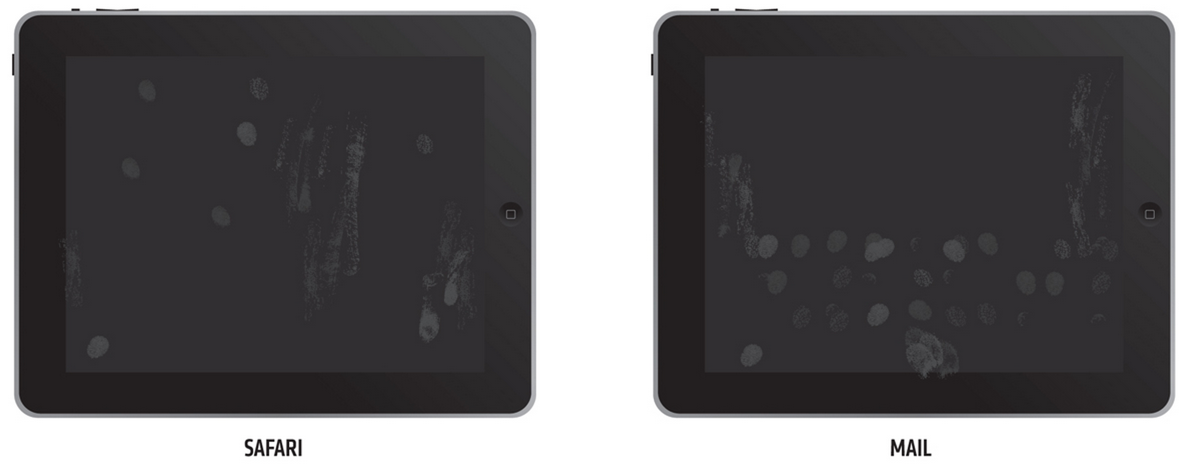
Fingerprints on an iPad
Carnegie Mellon fence

Carnegie Mellon fence

Carnegie Mellon fence


Evidence of something interacting with something else
...leaving its mark.
All of these examples are
Why physical metaphors?
- Human cognition is built for these physical things. We see these kinds of patterns easily.
- Thinking in this way helps you choose visual mappings that make sense.
- Making something mimic the real world gives it meaning.
Practice
backwards-engineering naturally-occurring visualizations.
- You will ask the right questions.
- You will come up with better data stories.
- You will tell them in a more intuitive way.
My Process
My Process
- Define my audience
- Understand the data
- Lots of ideas for questions and messages
- Explore the data (...more ideas)
- Plan out possible stories
- Select a few key messages to tell one story
- Overall story design
- Make it pretty


Iterate and test constantly.
Principles
- Be honest. Be direct.
- Keep it simple
- Remember your audience
- Use vis for a reason
- Make it real and relate-able
- Explore the real data early
- Show appropriate context
- Make it pretty at the end
- Iterate!
Testing your work
Squint test
Squint at your work so you can't read any of the words. What patterns do you see in the data? What questions do you ask?
If you don't see any patterns, it's not right yet.


The test doesn't always apply...
10-second test
Pretend to wipe your brain clean. Or grab someone new.
Look at your work for only 10 seconds. What messages do you see?


What's your user's
Next Question?
Wipe your brain clean again. Or grab a new person.
Look at the vis for long enough to get an understanding of it. What is the next question you ask?
Is it related to your story? Is it a question born of curiosity rather than confusion? Does it reflect a new perspective?
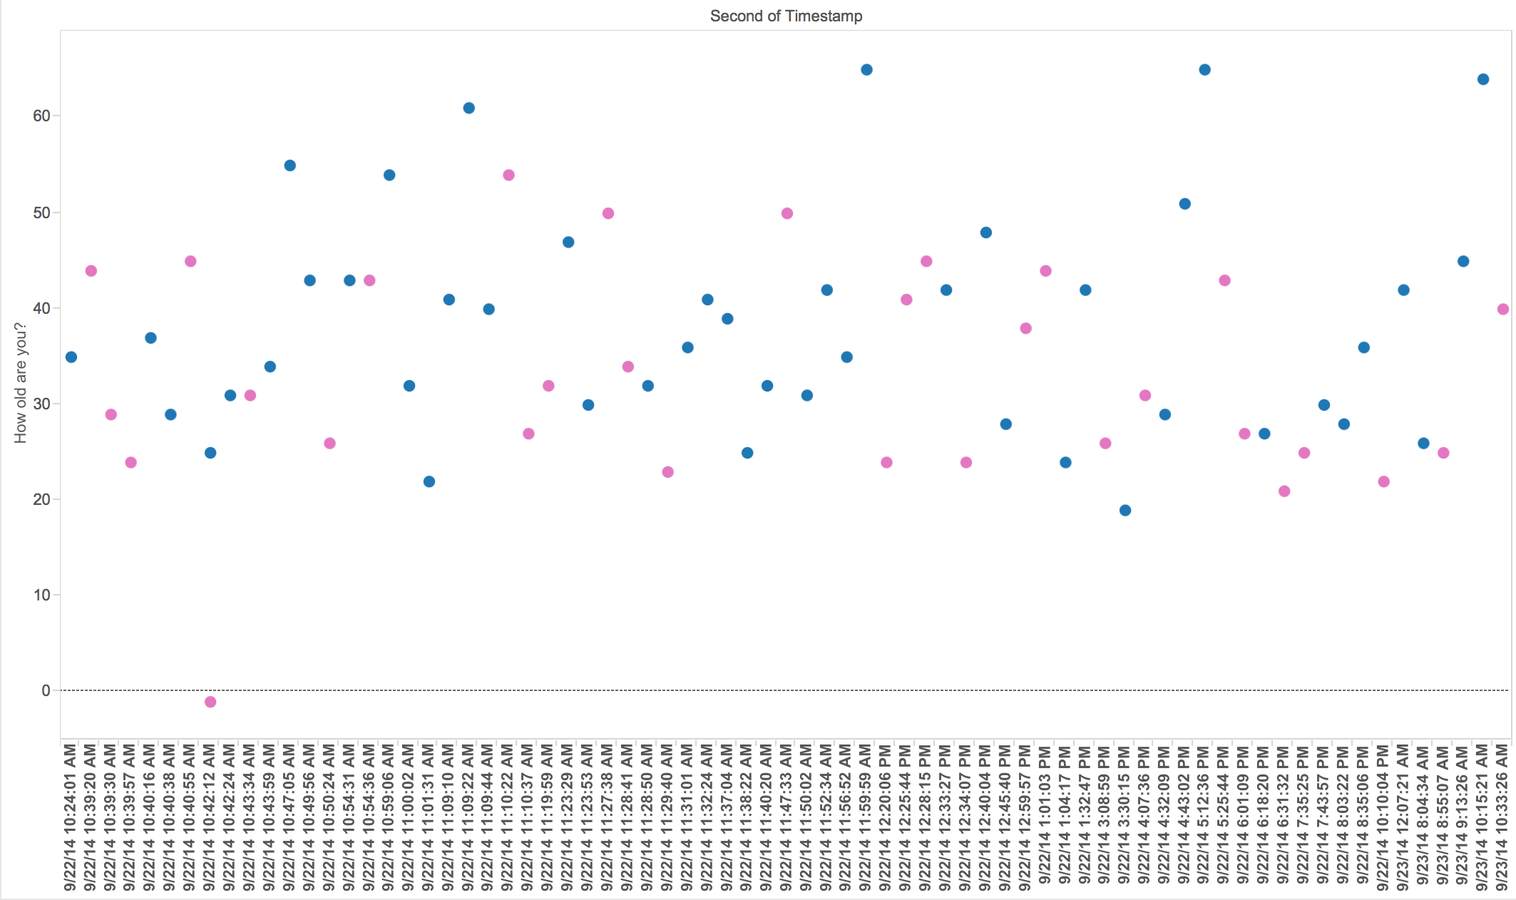
Our data

Our data

What stories could we tell?


Explore this data yourself!
Survey data: http://bit.ly/1Cig4zh
Hobbies data: http://bit.ly/1DAiJ9d
Contact me
@anitalillie
anitalillie@gmail.com
http://www.linkedin.com/in/alillie/
Tools
- Exploring data:
- Tableau
- R
- Excel
- Design
- Illustrator
- Front-end programming
- JavaScript (D3)