Matrix Product States
A brief introduction to theory and application for ML
Building Blocks
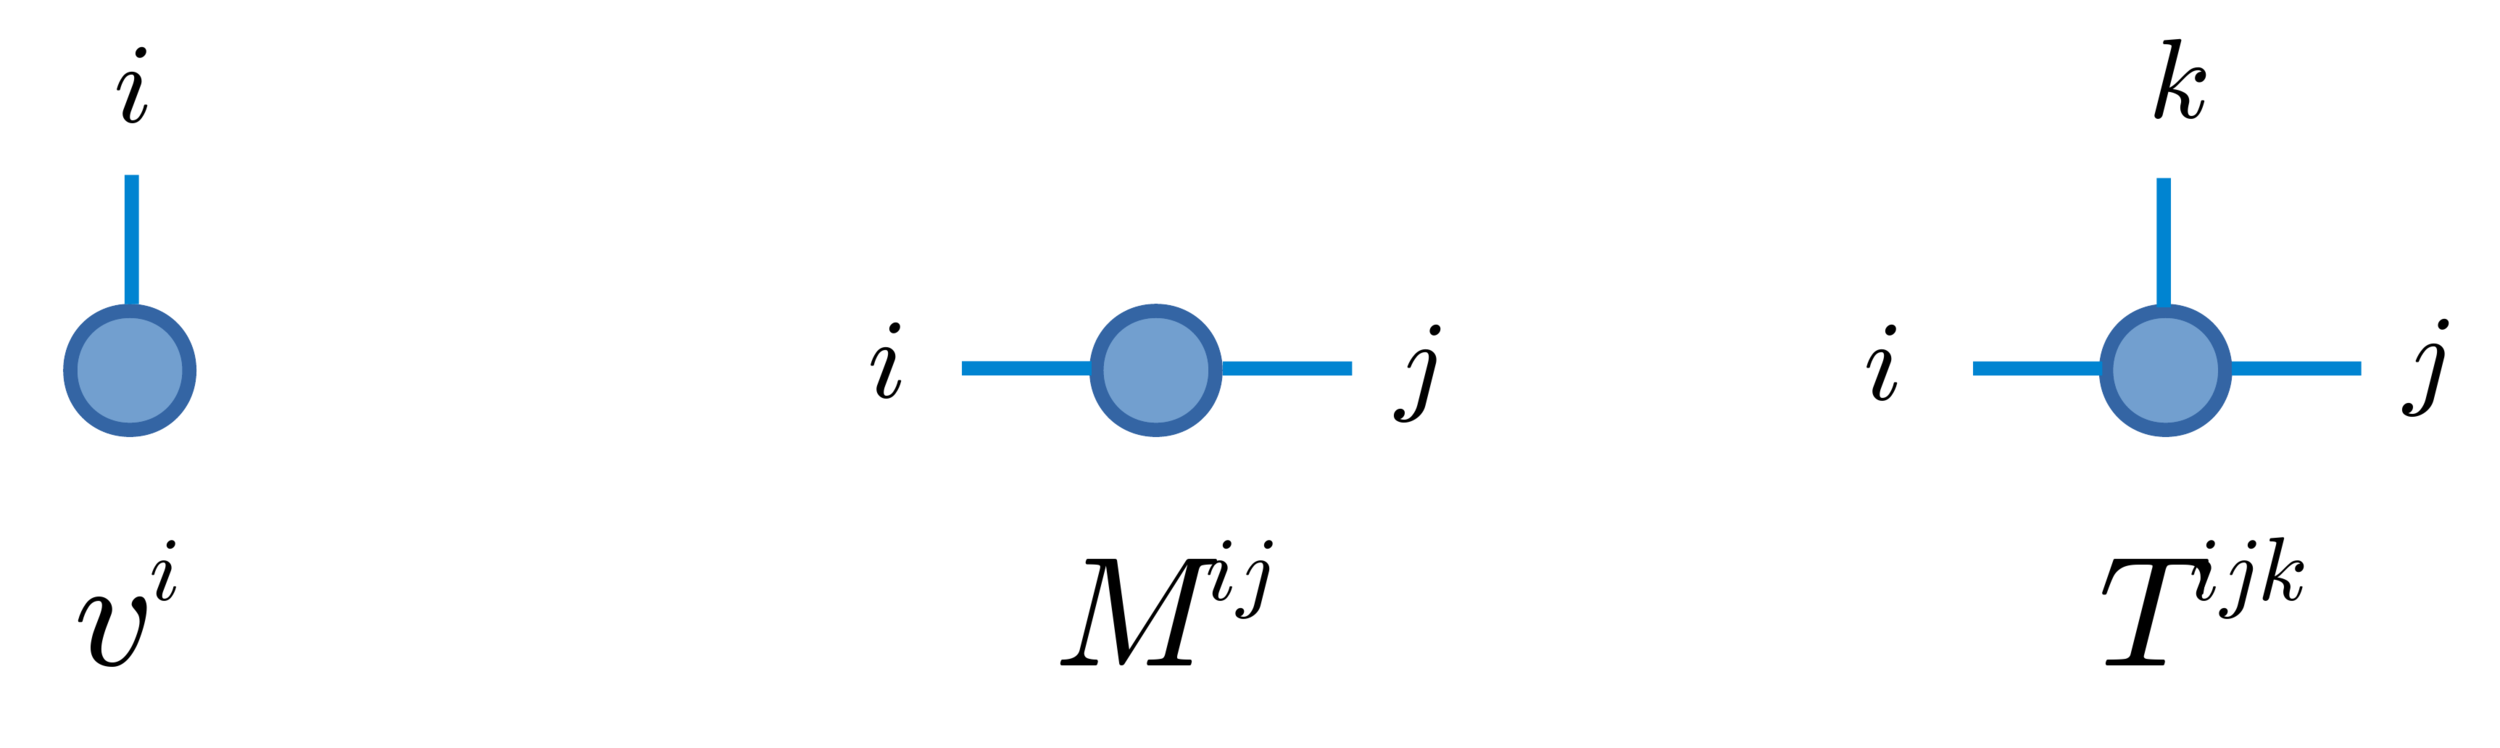
Graphical Representation of a vector, matrix and a rack-3 tensor
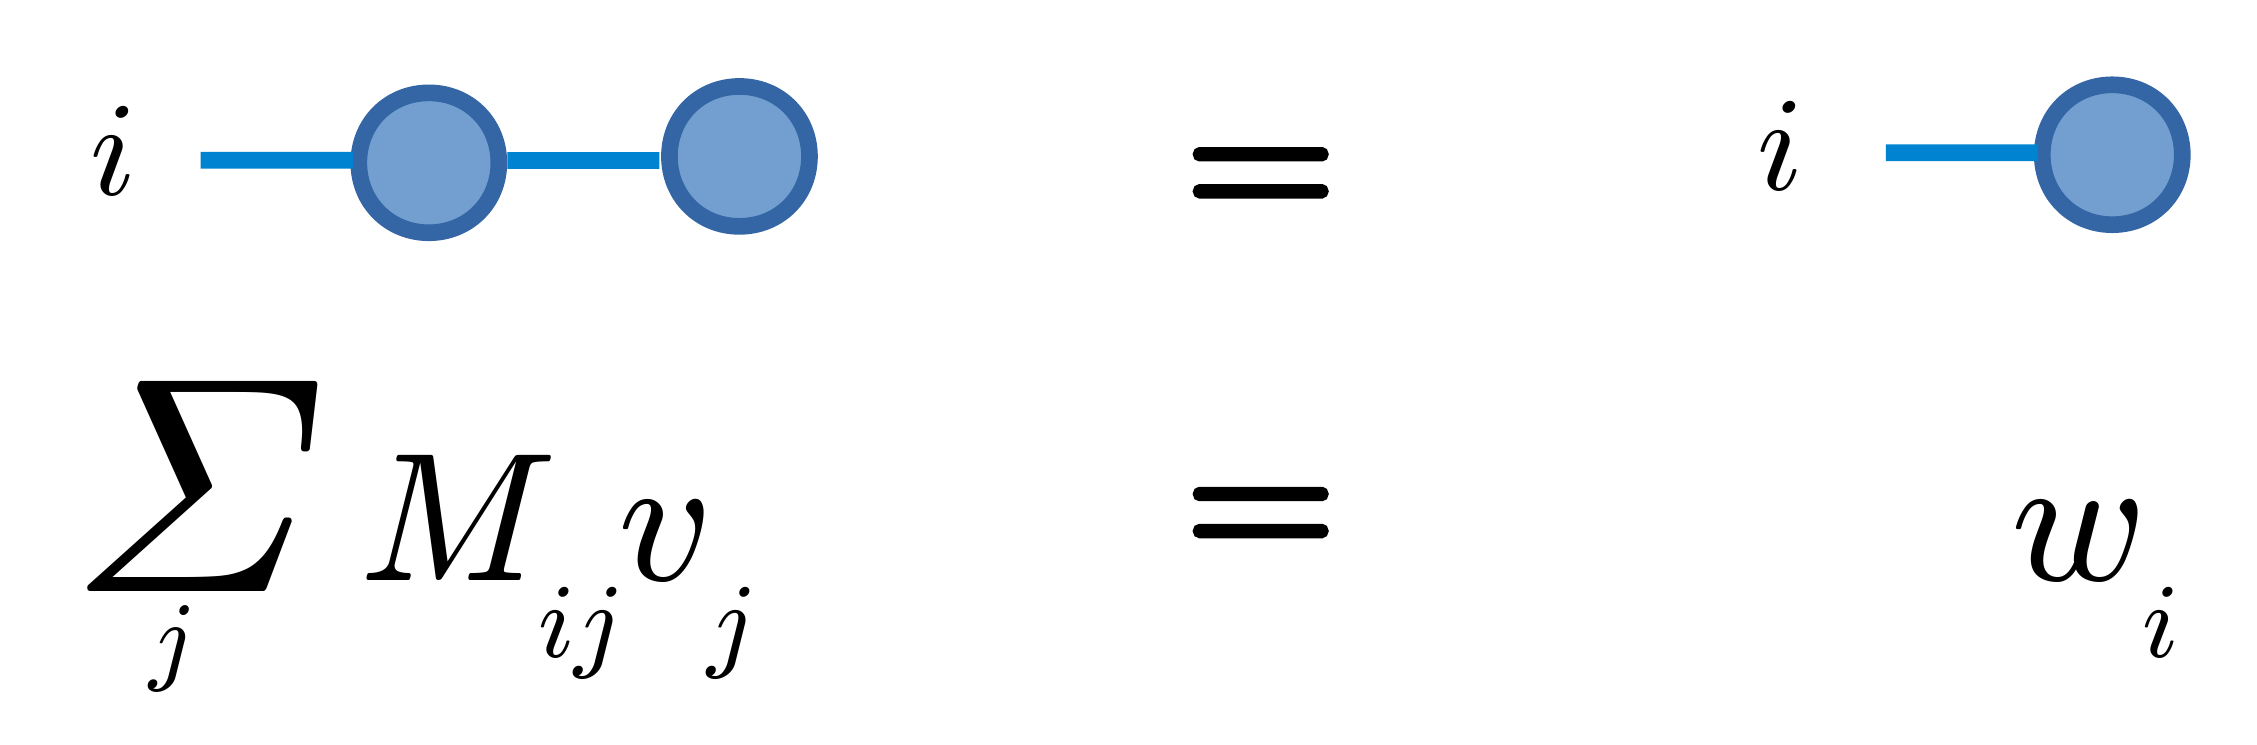
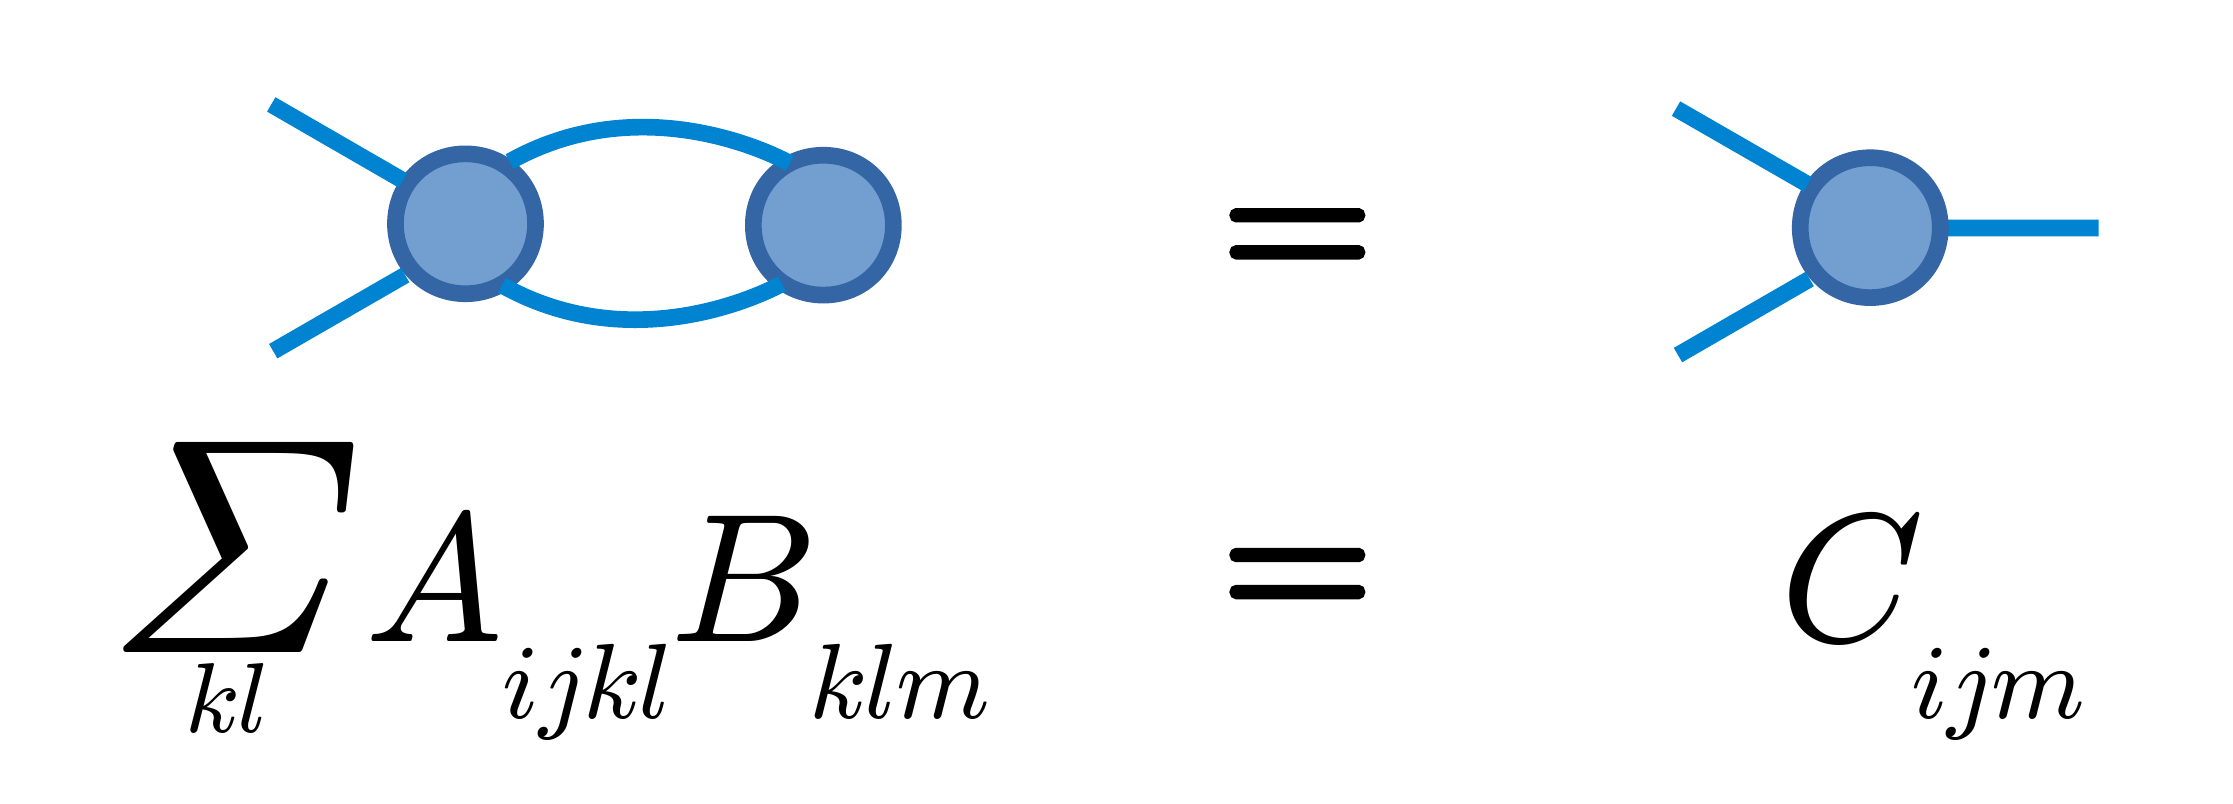
Tensor Contraction

Singular Value Decomposition
M=USV^\dagger
\left|\Psi\right>=\sum_{n_1n_2n_3}\psi^{n_1n_2n_3}\left|n_1n_2n_3\right>
A quantum State
\psi^{n_1n_2n_3}
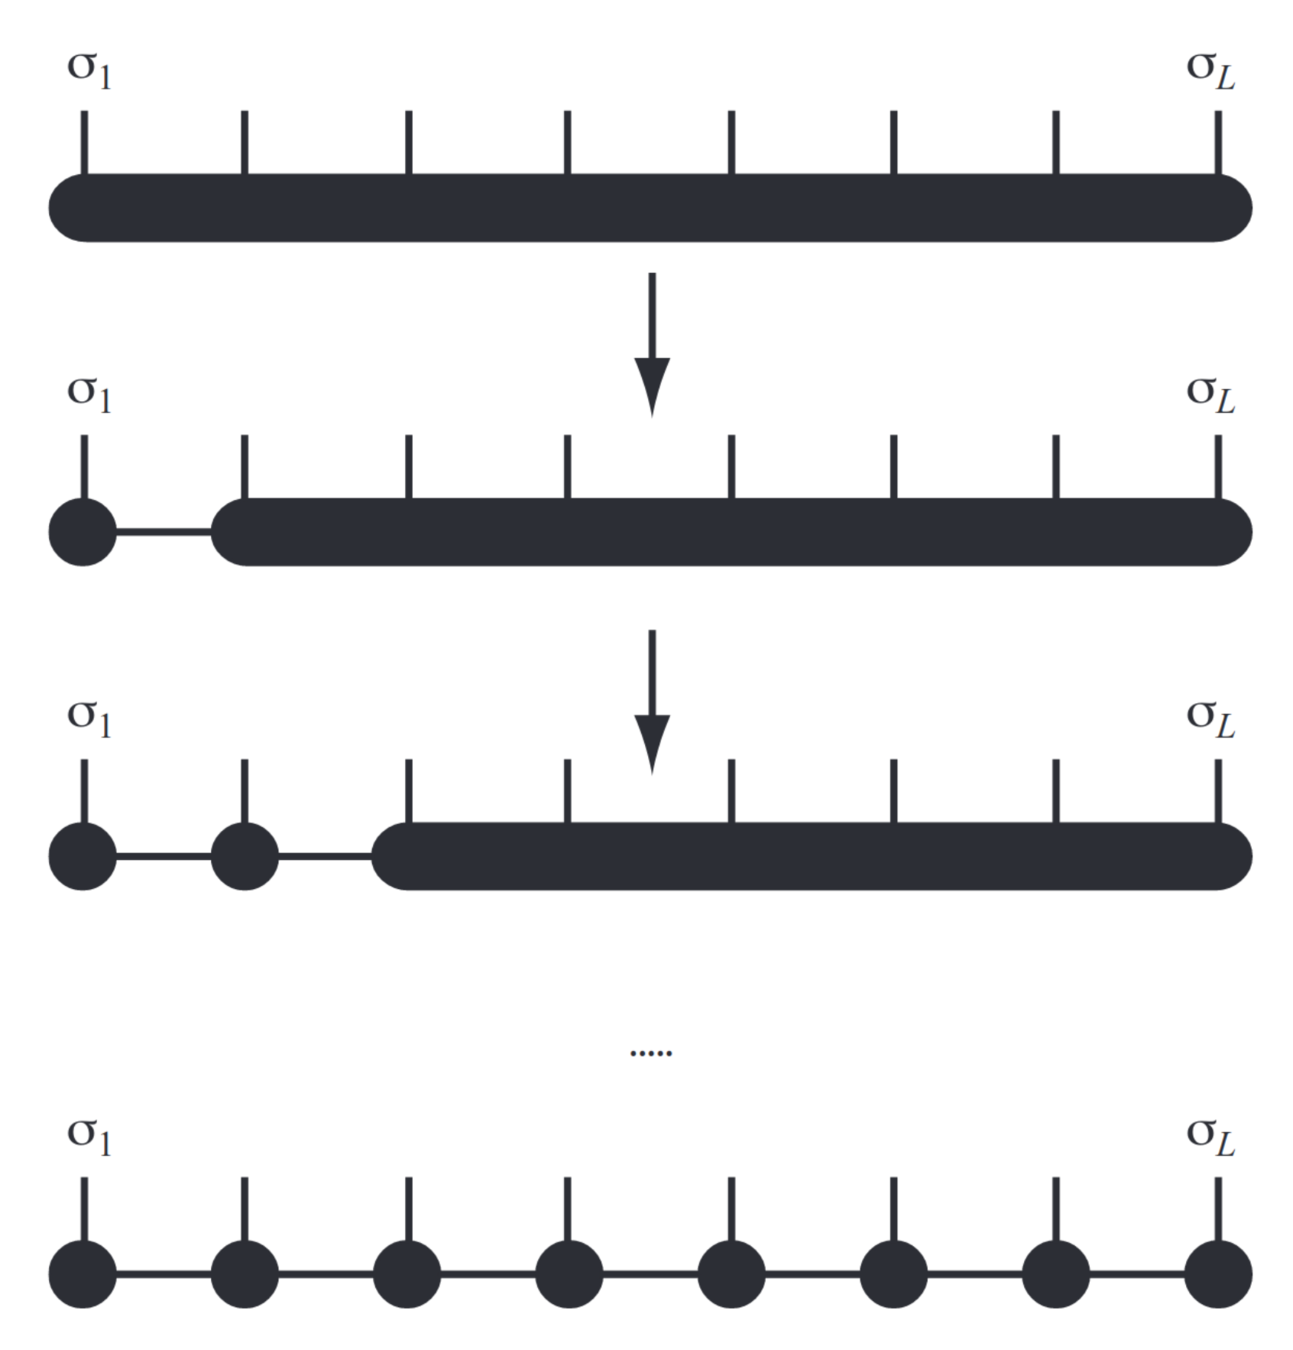
\psi^{n_1n_2n_3\dots n_l}=\sum_iA^{n_1}_{i_1}A^{n_2}_{i_1i_2}A^{n_3}_{i_2i_3}\dots A^{n_l}_{i_l}
n_2
n_3
n_1
n_2
n_3
n_1
i_1
i_2
MPS from general state
ML with MPS
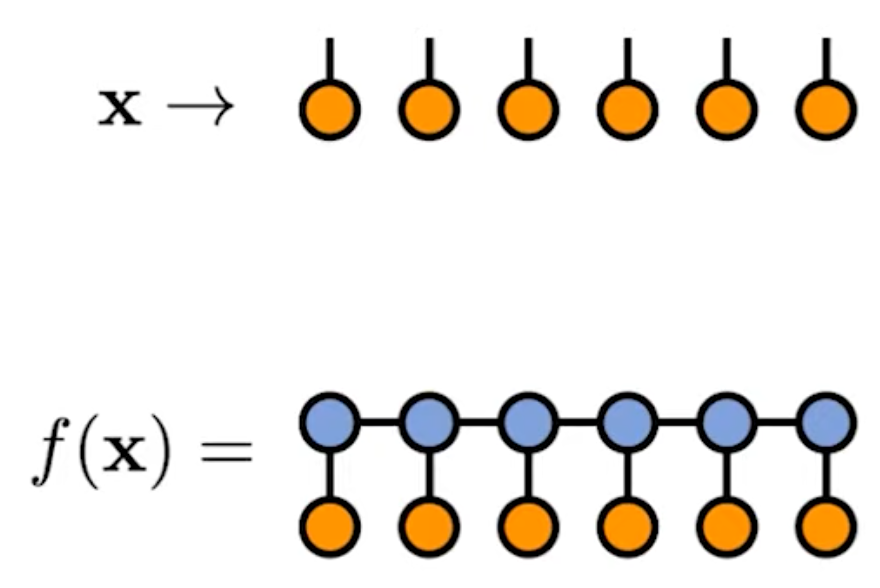
- Map data to tensor product features
- Evaluate MPS model
- Optimise
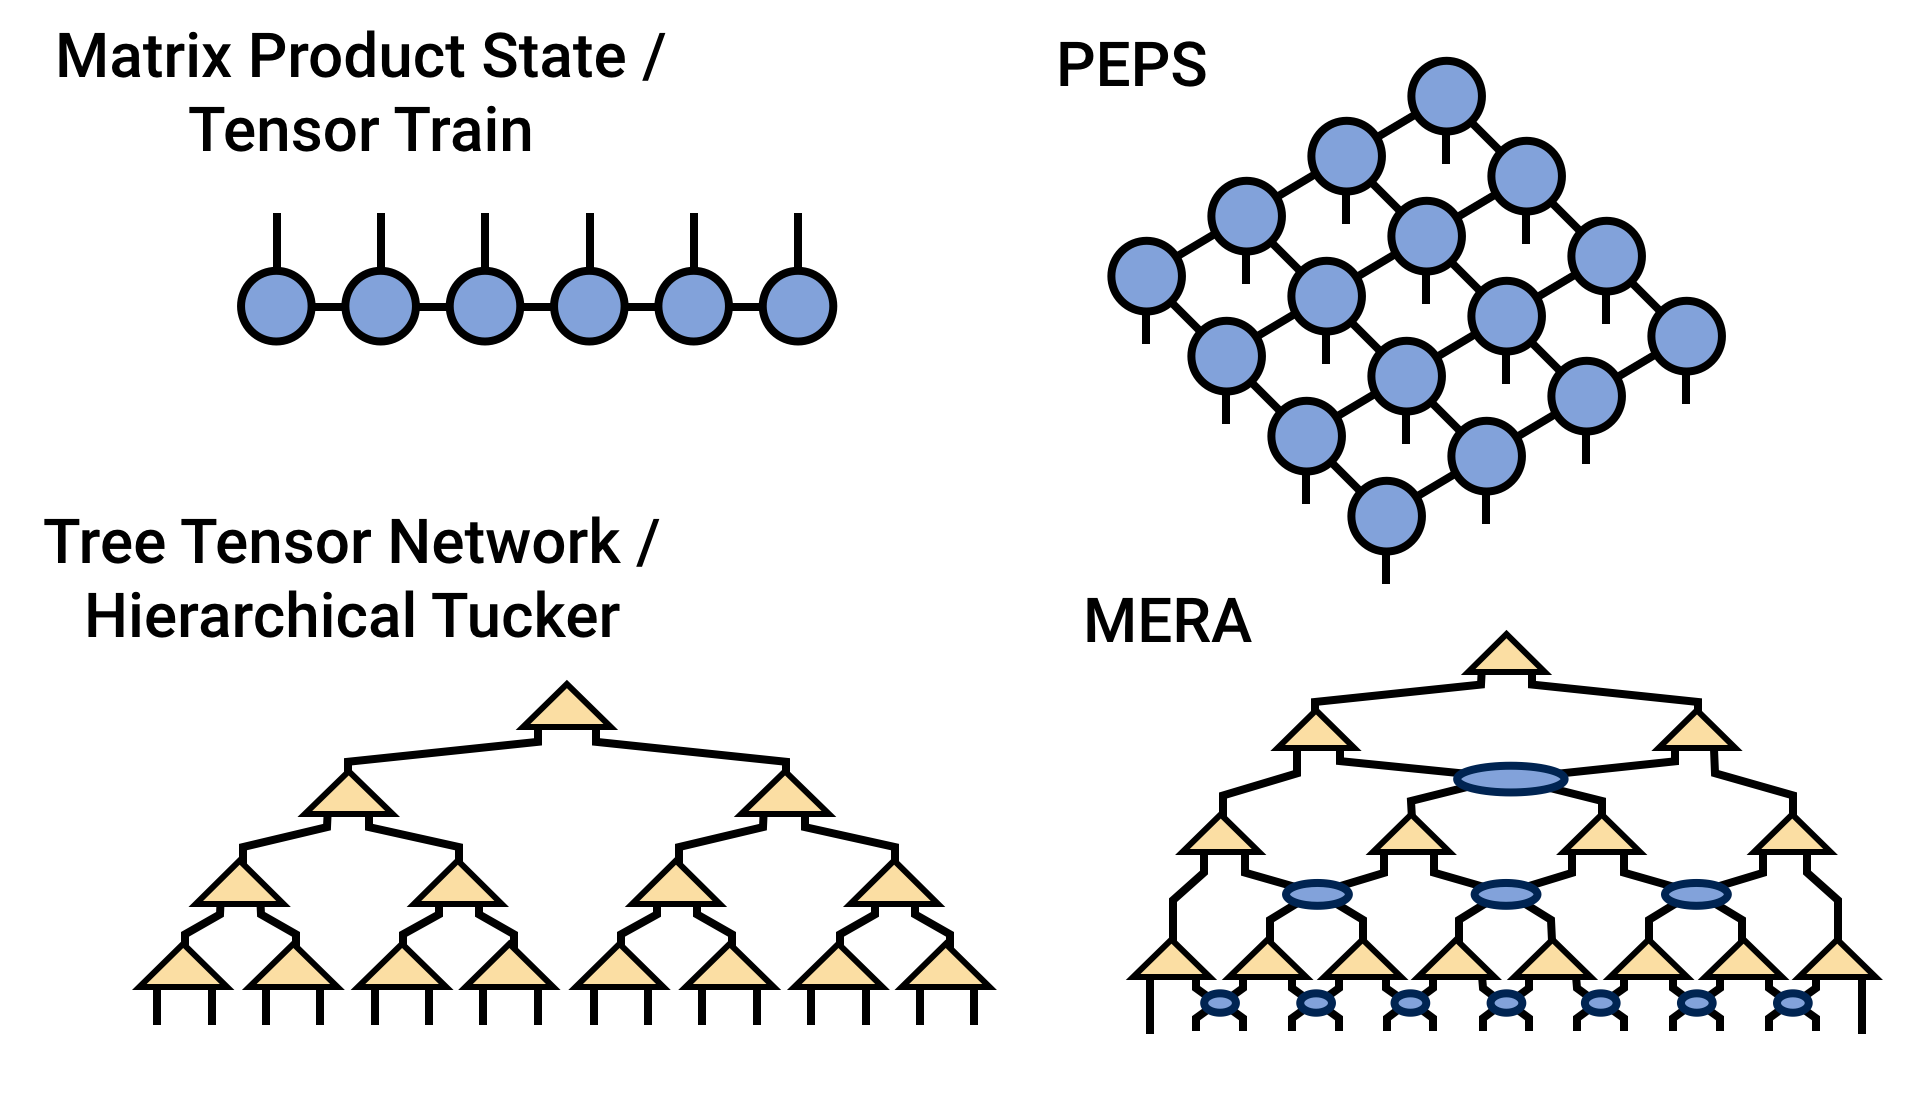
Other Tensor networks
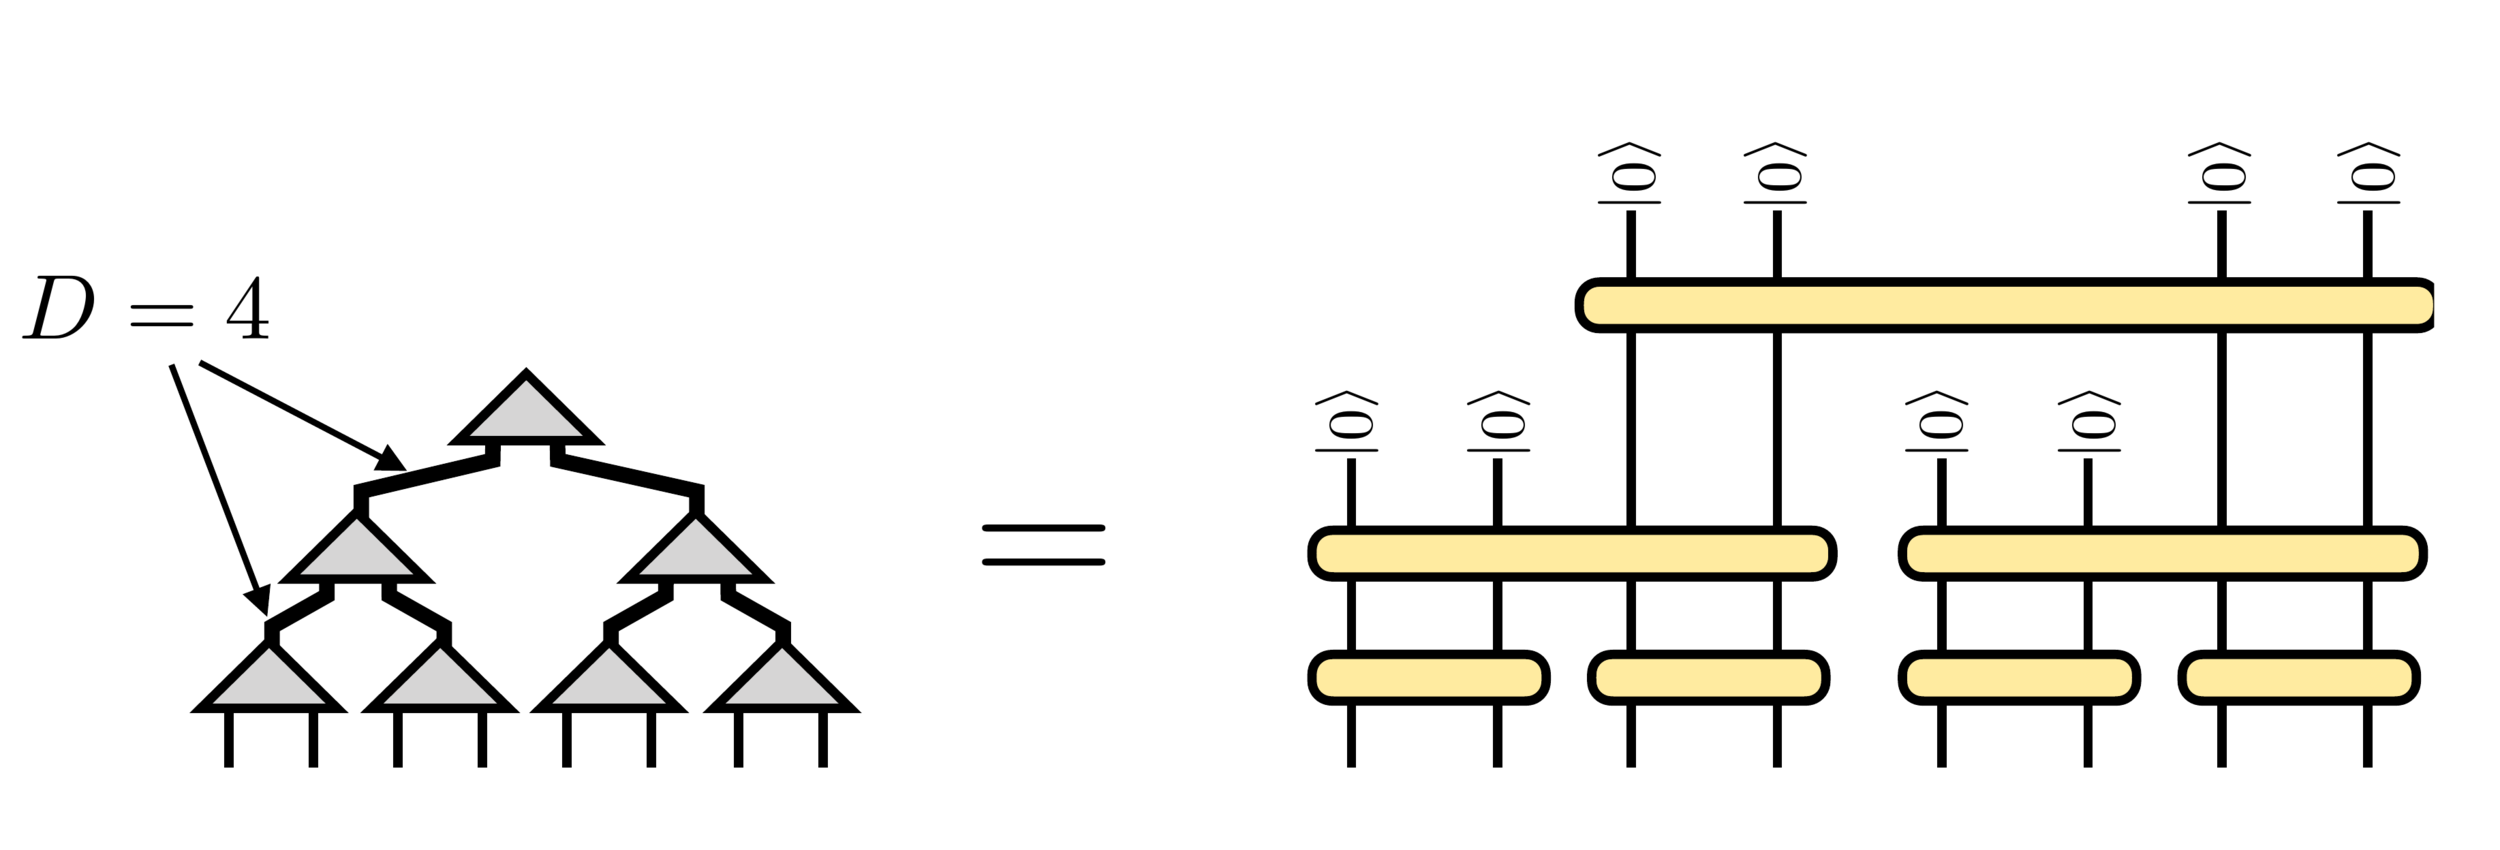
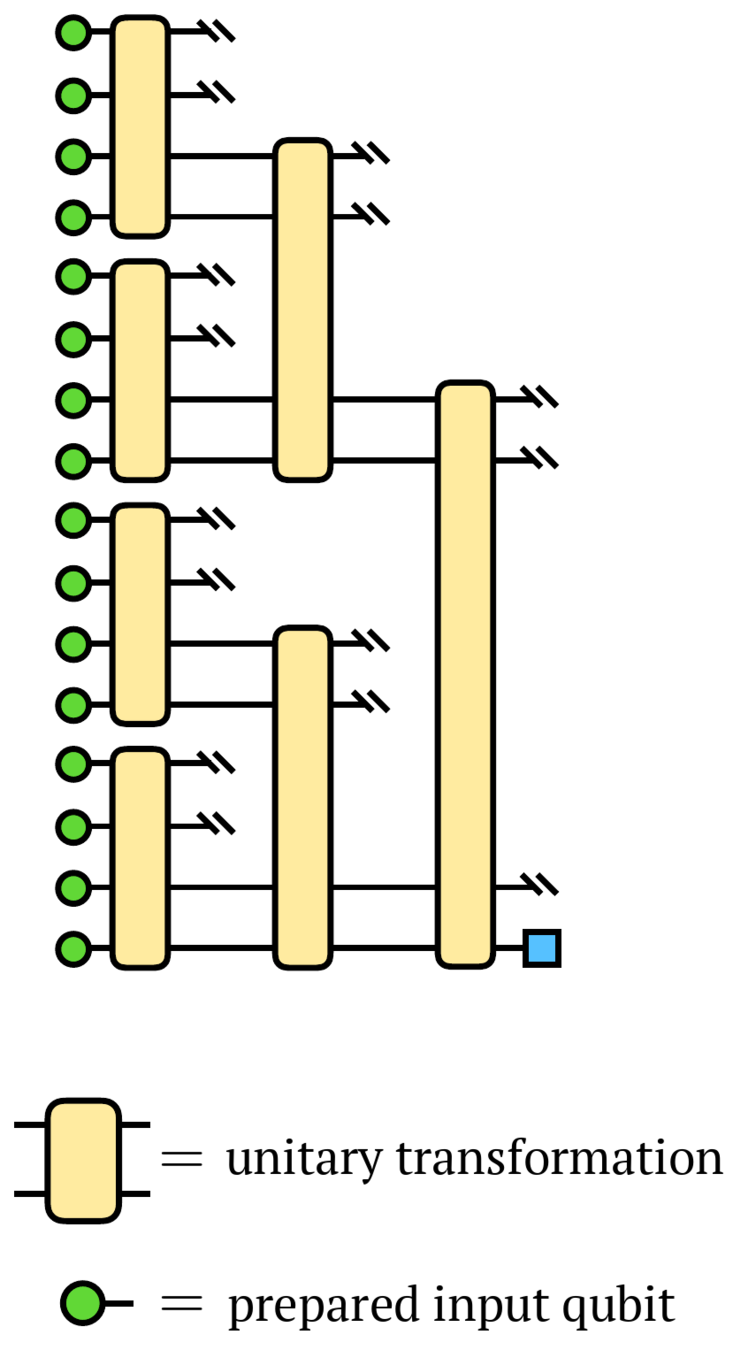
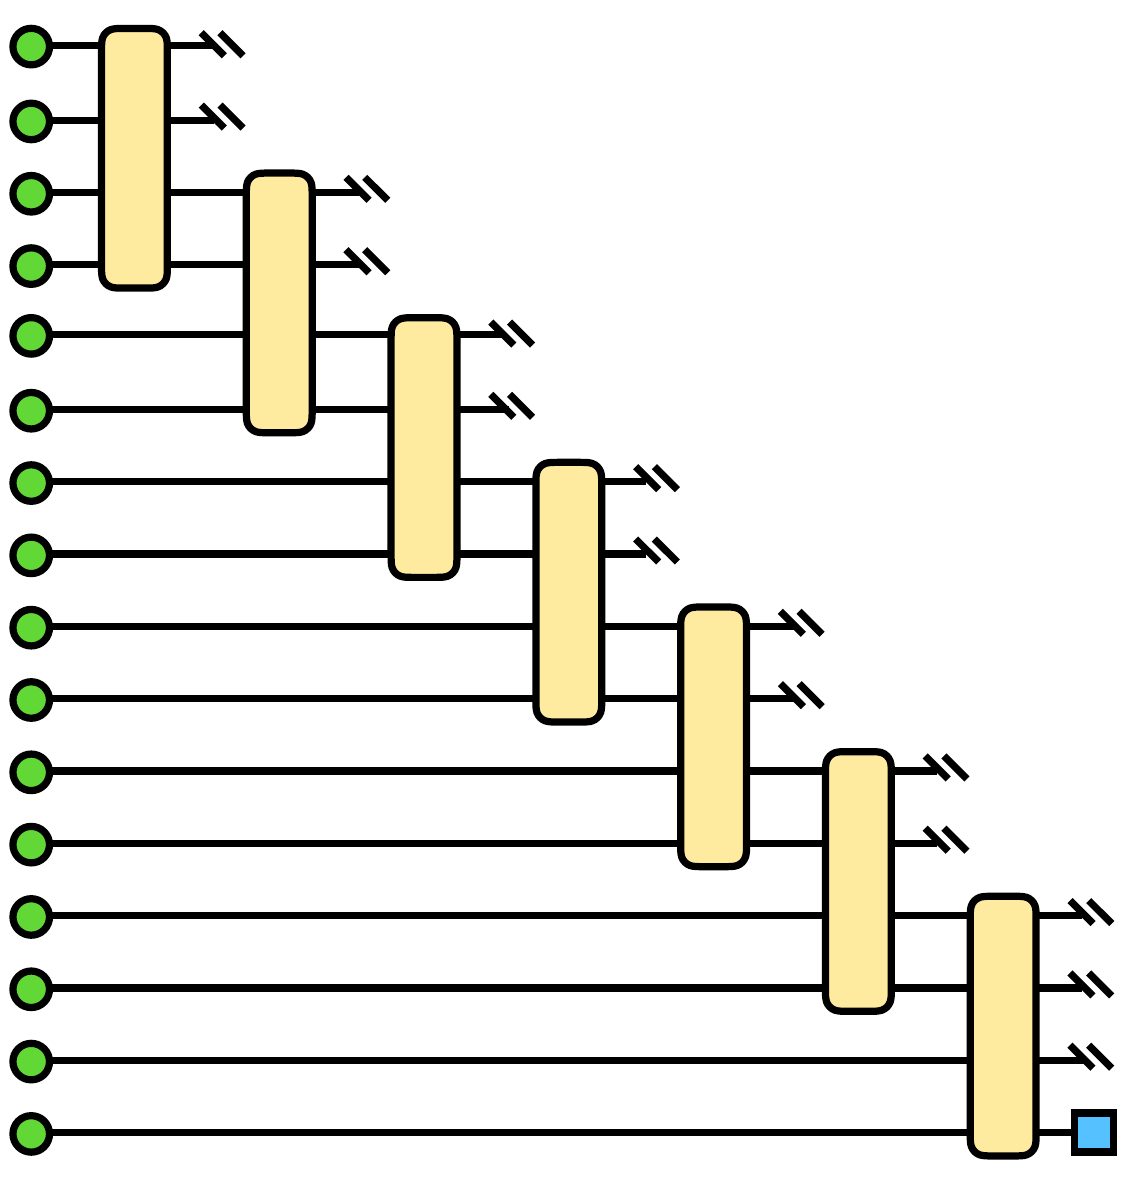
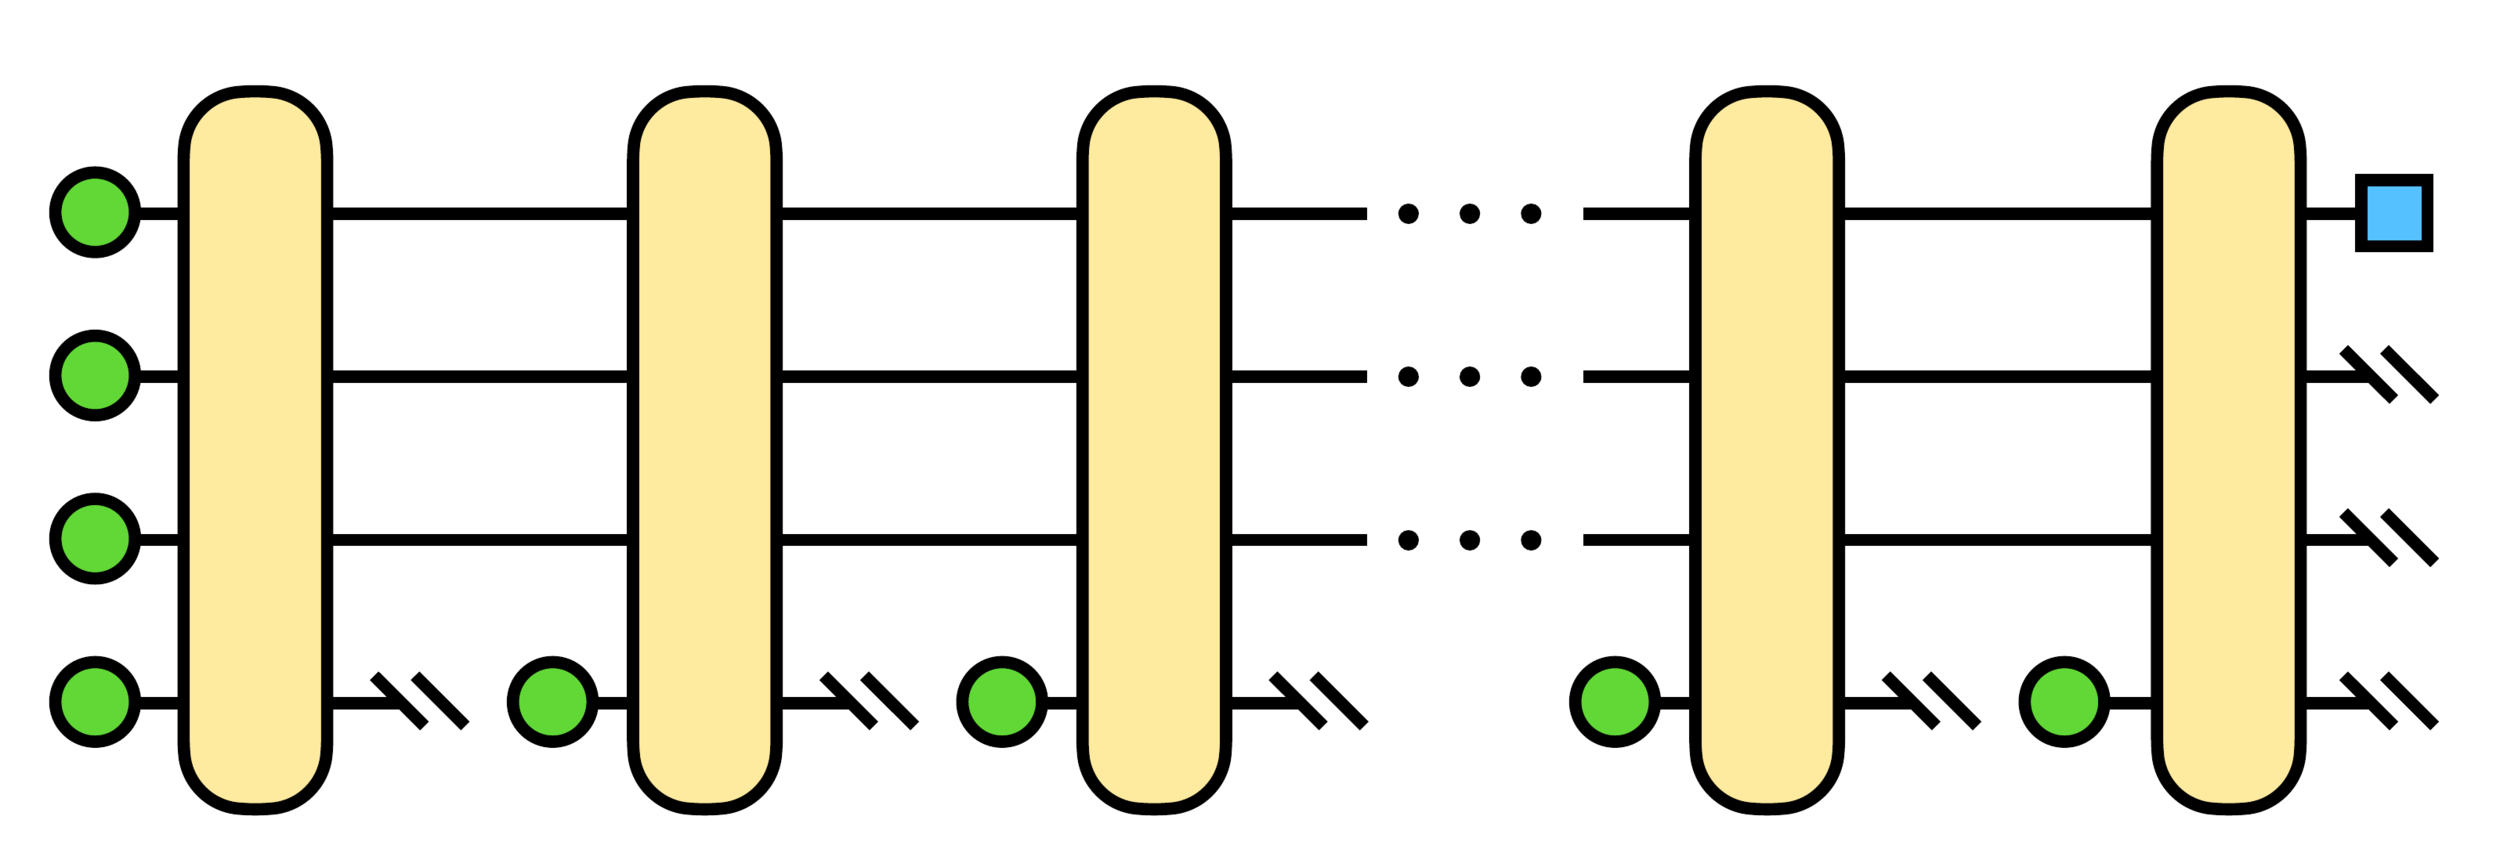
MPS as Quantum Circuit
| Dataset | MPS | MPS + VQC(3) | FRQI (4) + QMPS (2) | QMPS (2) (with PCA -> 4) |
|---|---|---|---|---|
| Digits (0/1) | 0.888 (10) | 0.9954 (10) | 0.995 (10) | 0.996 (10) |
| Fashion (0/1) | 0.908 (10) | 0.955 (10) | - | 0.852 (10) |
| Digits (0-5) | 0.217 (10), 0.874 (100) | - | - | - |
| Fashion (0-5) | 0.494 (10), 0.800 (100) | - | - | - |
| California Housing | 1.5331 (10) | 1.1672 (10) | N/A | - |
| Gear Box | 0.8286 (2, 100/10), 0.9000 (20, 100), 1.000 (20, 1000) |
0.77 (2, 10), 0.83 (2, 100), 0.87 (20, 100) |
N/A | 0.89 (10) |
Question 1
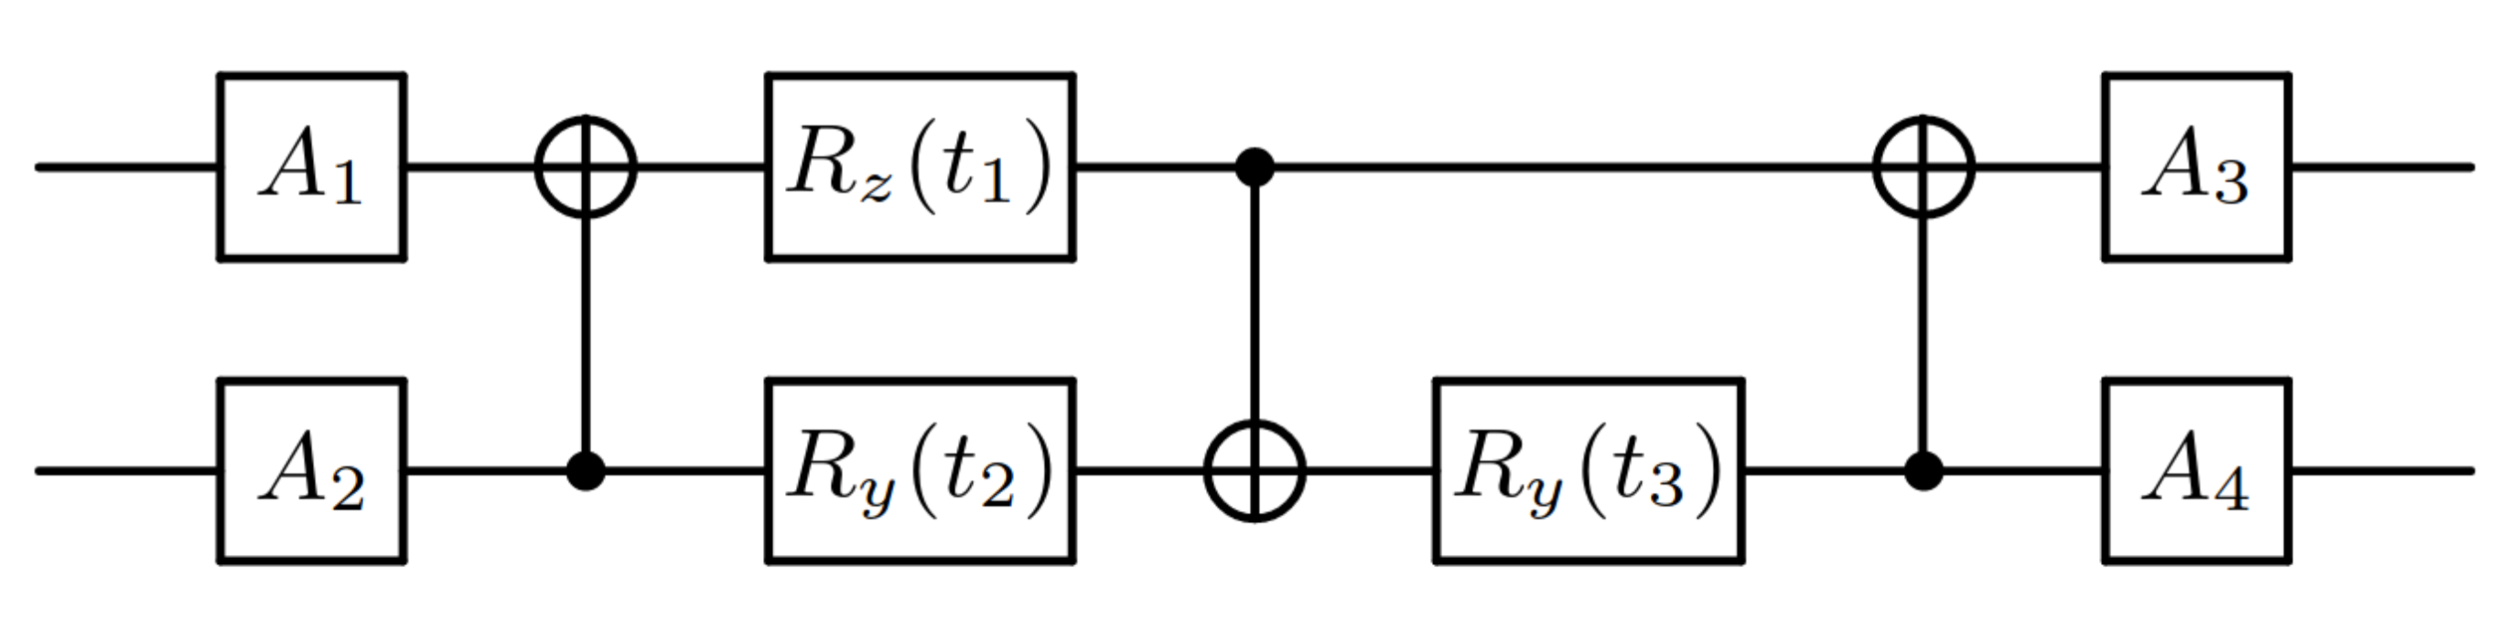
What are these unitaries?
Question 2
Best way to get regression values from QC?
Question 3
Best way to get multiple values from QC?