Girls Who Code @ Xoom
Web Development Session
Open your Chrome Bookmarks and select Girls Who Code @ Xoom to open and view this presentation locally


High Level Overview
Today we are going to:
- Download, install, and run a simple Node.js web application that creates a Google Visualization Map of all of the countries that Xoom serves.
- Add the ability to render maps of individual countries
- Customize the map stylistically
- Add a real-time traffic layer to the map
- Integrate the Google Places API to the individual country map view to add find places functionality
----
My goal for our session together:
-
For you to have a model for, and to feel empowered to spin up your own web application that retrieves data and utilizes it in some way.
- Node.js is unique in making this very easy to do, especially for web developers.
Overview of our sample Node application
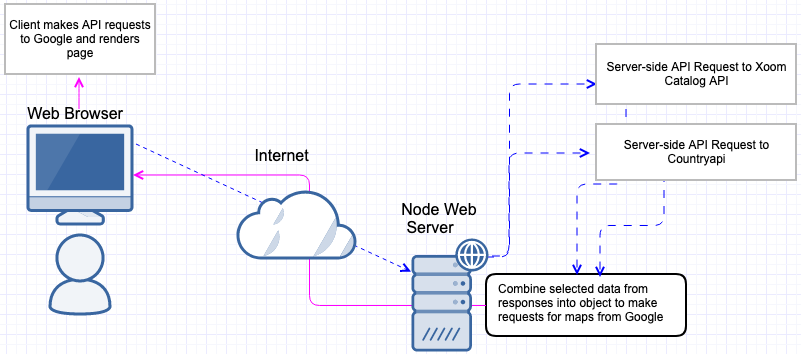
Node.js is
- A free, publicly-available, and open source web server environment
-
Node.js can
- Generate dynamic page content
- Create, open, read, write, delete, and close files on the server
- Collect form data
- Add, delete, modify data in your database
Why use Node.js?
- Node.js allows you to run javascript on the server
- Since web developers already write javascript on the client, we can adapt to writing javascript on the server with a small learning curve and spin up a whole web application without needing assistance from a back-end developer
Client
Also referred to as the Front-End
An entity requesting a resource in a network.
A common client is a web browser requesting a web page from a web server.
Server
Also referred to as the Back-End
A server is a computer that provides data to other computers.
A web server is a server that runs software and can serve its content to the WWW. Node.js is the web server that we'll be using to run our sample application locally.

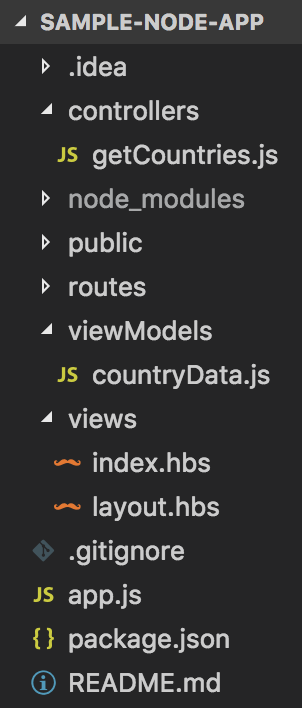
Controller (Server-side Javascript)
controllers/getCountries.js makes our 2 API calls and sends the response from each call into the model
Model (Server-side JavaScript)
viewModels/countryData.js selects particular data from the response of each API call and organizes it into an object that the View will use
View (Client-side JavaScript)
/views/layout.hbs, /views/index.hbs
- HTML, CSS, client-side JavaScript
- Calls Google Visualization, Map and Places libraries
Model-View-Controller Architecture
API: Application Programming Interface
- An API is a messenger between two applications.
- An API delivers a request from Application A to Application B, then returns the response from Application B to Application A
- APIs are what allow you to use one of your social media accounts to sign up for a completely separate service; for example, signing up for Spotify with your Facebook account.
- The web is run on APIs: over 15,000 are publicly available.
- APIs are powerful for streamlining delivery of data and reuse of data.

API request #1: https://api.xoom.com/v2/catalog/currency-channels
- Xoom's Catalog API provides data on the countries that we service.
-
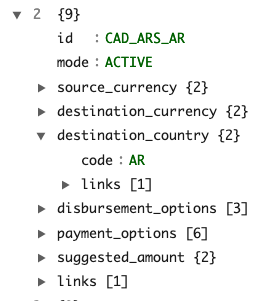
It returns data in a format known as Javascript Object Notation (JSON).
-
JSON is built on universal data structures that usable by virtually all modern programming languages:
- A collection of name/value pairs
- An ordered list of values or array
-
JSON is built on universal data structures that usable by virtually all modern programming languages:
Here is a sample entry for Argentina from the Catalog API:

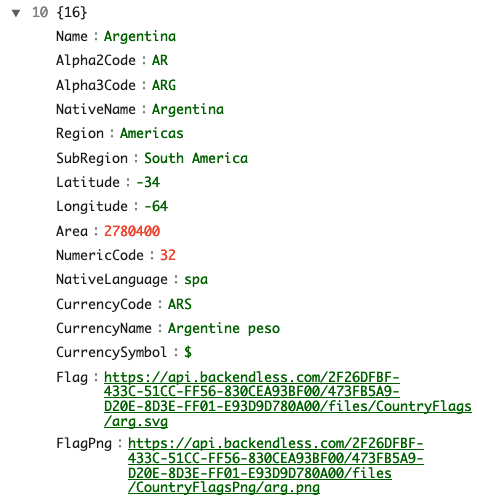
API request #2: http://countryapi.gear.host/v1/Country/getCountries
- This API provides additional country-specific information
- We will be using Latitude, Longitude, Flag, and Name.
Here is a sample entry for Argentina:

Let's download and run our sample web application!
- Open the terminal in the dock at the bottom of your desktop and run the following commands in order.
- This first command will download the application from the source code and version control repository GitHub:
git clone https://github.com/girlsWhoCodeXoom/sample-node-app.git
cd sample-node-app
npm install
node app.js
Browse to http://localhost:3000
There are several volunteers in the room so if you have any question as you're going along just raise a hand :)
To render the maps, we are using the Google Charts Map Component:
https://developers.google.com/chart/interactive/docs/gallery/map
Let's open /view/layout.hbs and to see how we're drawing the maps to the page:
Within a self-executing function we load the Google Charts map package and set drawWorldMap as the callback function
- drawWorldMap()
- Sets the customizable Google map display options
- Creates the Google map and data objects
- Loops through our custom object created by the model from the API responses in order to write out the latitude and longitude of every country that Xoom provides service to into an array that is passed to Google so that a world map can be drawn with a marker for each country
- Call the Google draw method with our array of latitude and longitude data and options
- We'll add a 'select' event listener for whenever any individual country marker is clicked in order to render an individual map for that country
Group Exercise - Please open /views/layout.hbs
Click command-S in your editor to save the change and then refresh your browser window.
1. Add the ability to click a marker on the world map to render an individual map of that country.
-
At the bottom of the drawWorldMap function, remove the // in front of
//addListenerToWorldMap(worldMap, worldMapDataTable);
2. Add a real-time traffic layer to the individual country map.
-
In the drawCountryMap function, remove the // in front of the following two lines:
//var trafficLayer = new google.maps.TrafficLayer();
//trafficLayer.setMap(countryMap);
3. Enable Google Places search within the individual country maps.
-
At the bottom of the drawCountryMap function, remove the // in front of
//addPlaces(countryMap);
4. Add a custom color scheme to the individual country map
-
In the countryMap declaration of the drawCountryMap function, remove the // in front of
//styles: mapStyles
Thank You!
I am so happy that you are here at Xoom today, and that we are able to share and collaborate with you.
It is my wish that whatever you take away from your experience here at Xoom serves you well.
