Kibana
What is Kibana?
Kibana is an open source analytics and visualization platform designed to work with Elasticsearch
Easily visualize data pushed into Elasticsearch from Logstash, ES-Hadoop, Beats, or third- party technologies like Apache Flume, Fluentd, and many others.
Kibana is used to search, view, and interact with data stored in Elasticsearch indices.
Enables to create and share dynamic dashboards that display changes to Elasticsearch queries in real time.
What is Logstash?
Logstash is an open source tool for collecting, parsing, and storing logs for future use.
Kibana is a web interface that can be used to search and view the logs that Logstash has indexed.
Both Kibana & Logstash are based on Elasticsearch.
Elasticsearch, Logstash, and Kibana, when used together is known as an ELK stack.
Features
Kibana gives shape to any kind of data, structured and unstructured, indexed into Elasticsearch.
It also benefits from Elasticsearch's powerful search and analytics capabilities.
Capabilities to analyze data intelligently, perform mathematical transformations, and slice and dice your data as you see fit.
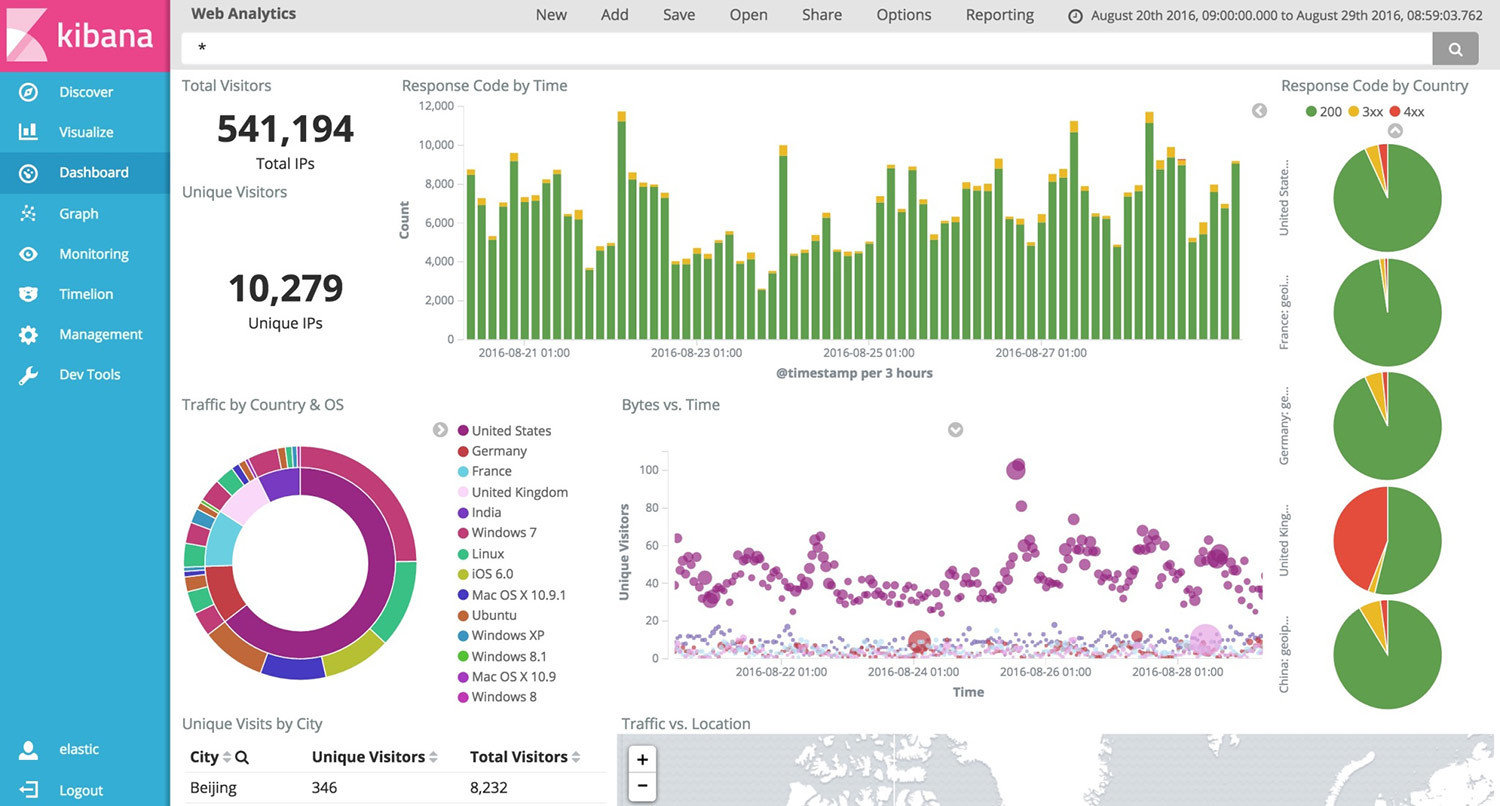
Give shape to your data to better understand large volumes of data, easily create bar charts, line and scatter plots, histograms, pie charts, and maps.
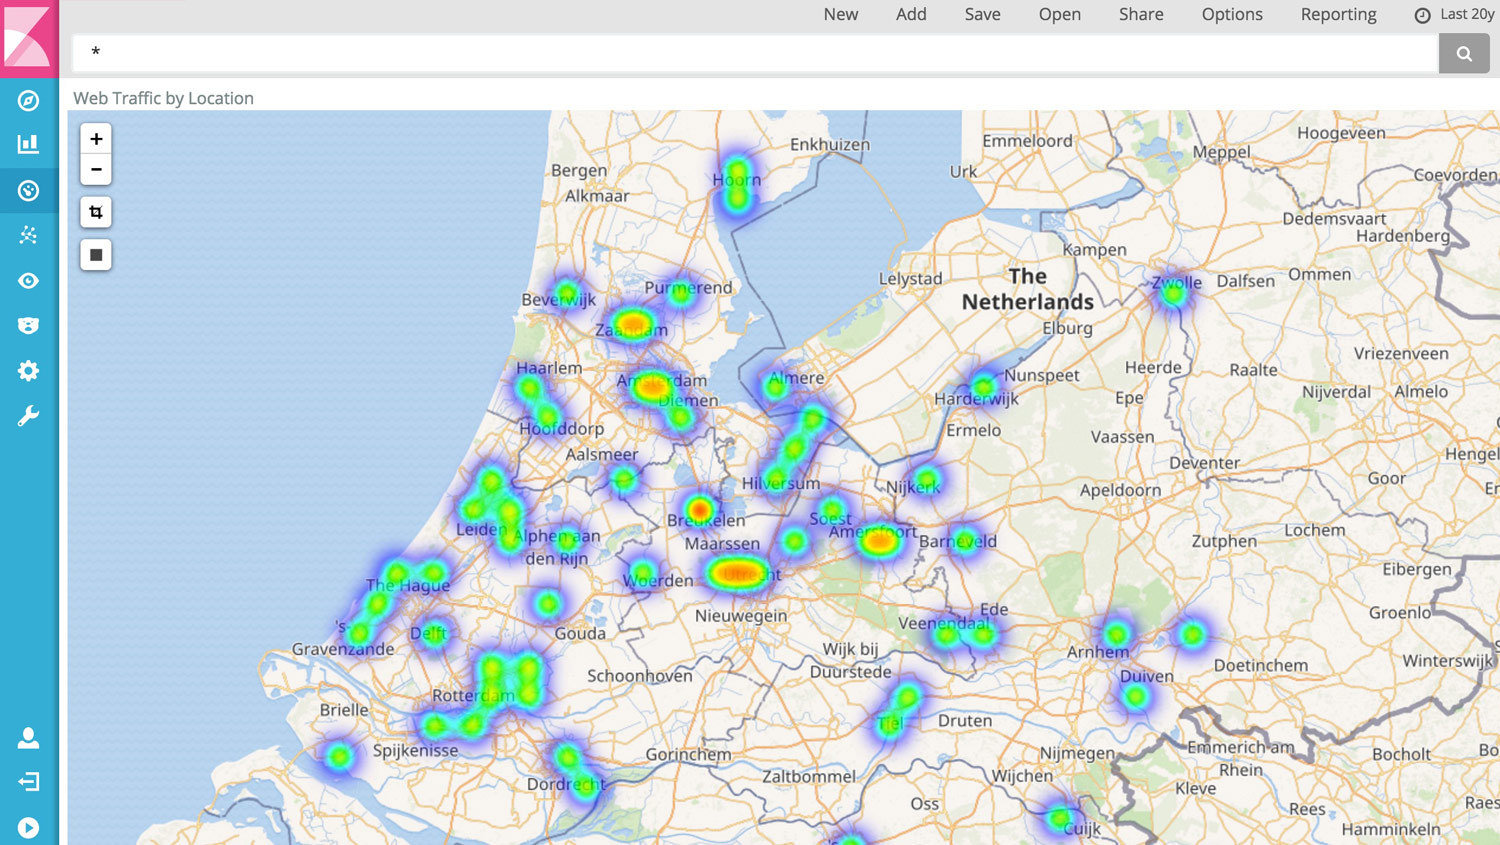
Visualize & Explore
Leverage our tiled map service to visualize geospatial data.
Visualize & Explore
Timelion lets us perform advanced time series analysis on our Elasticsearch data.
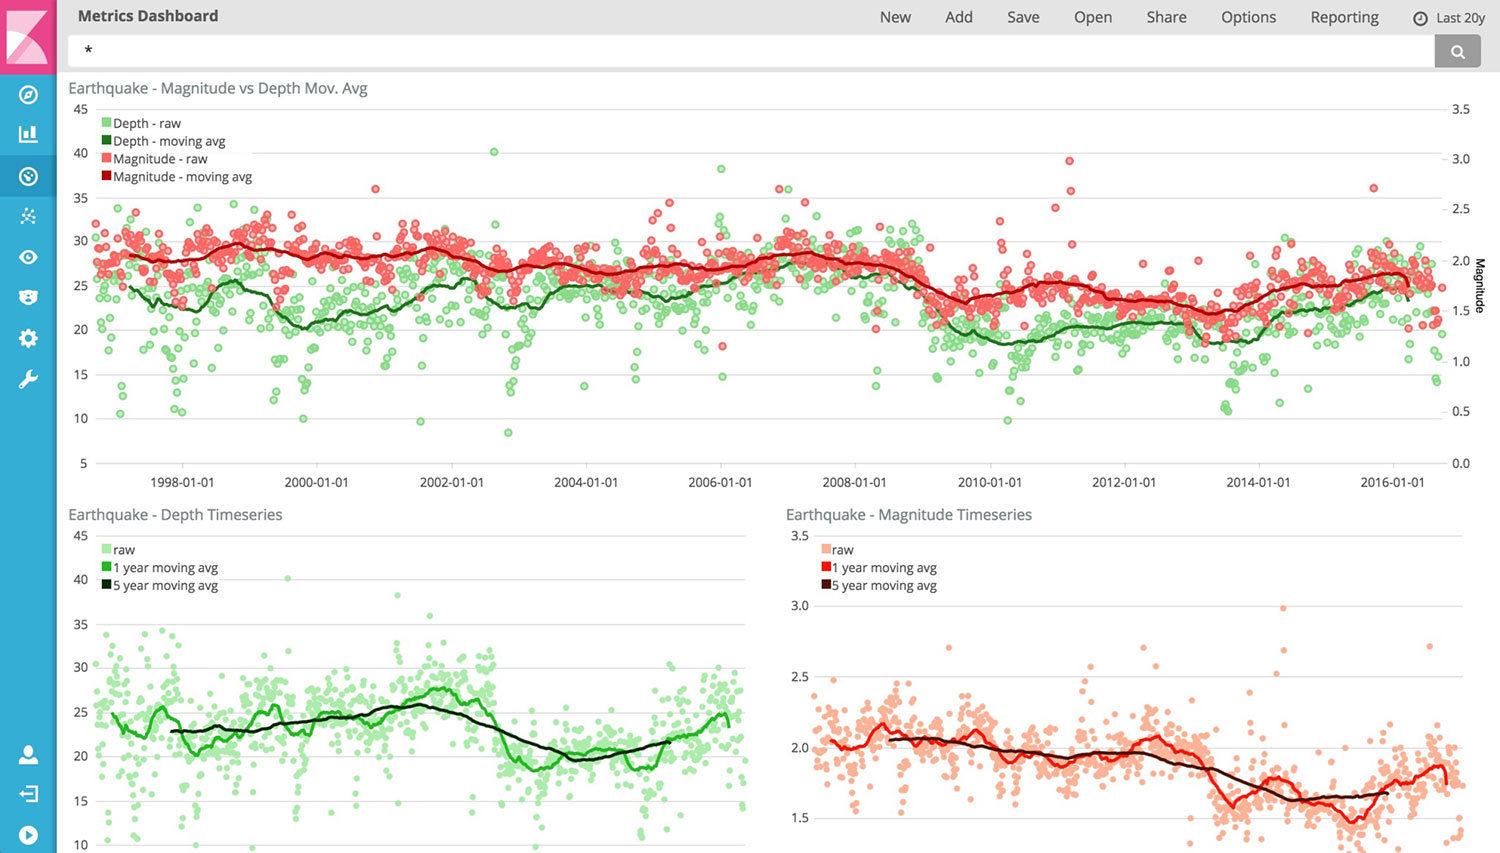
Visualize & Explore
Take the relevance capabilities of a search engine, combine them with graph exploration.
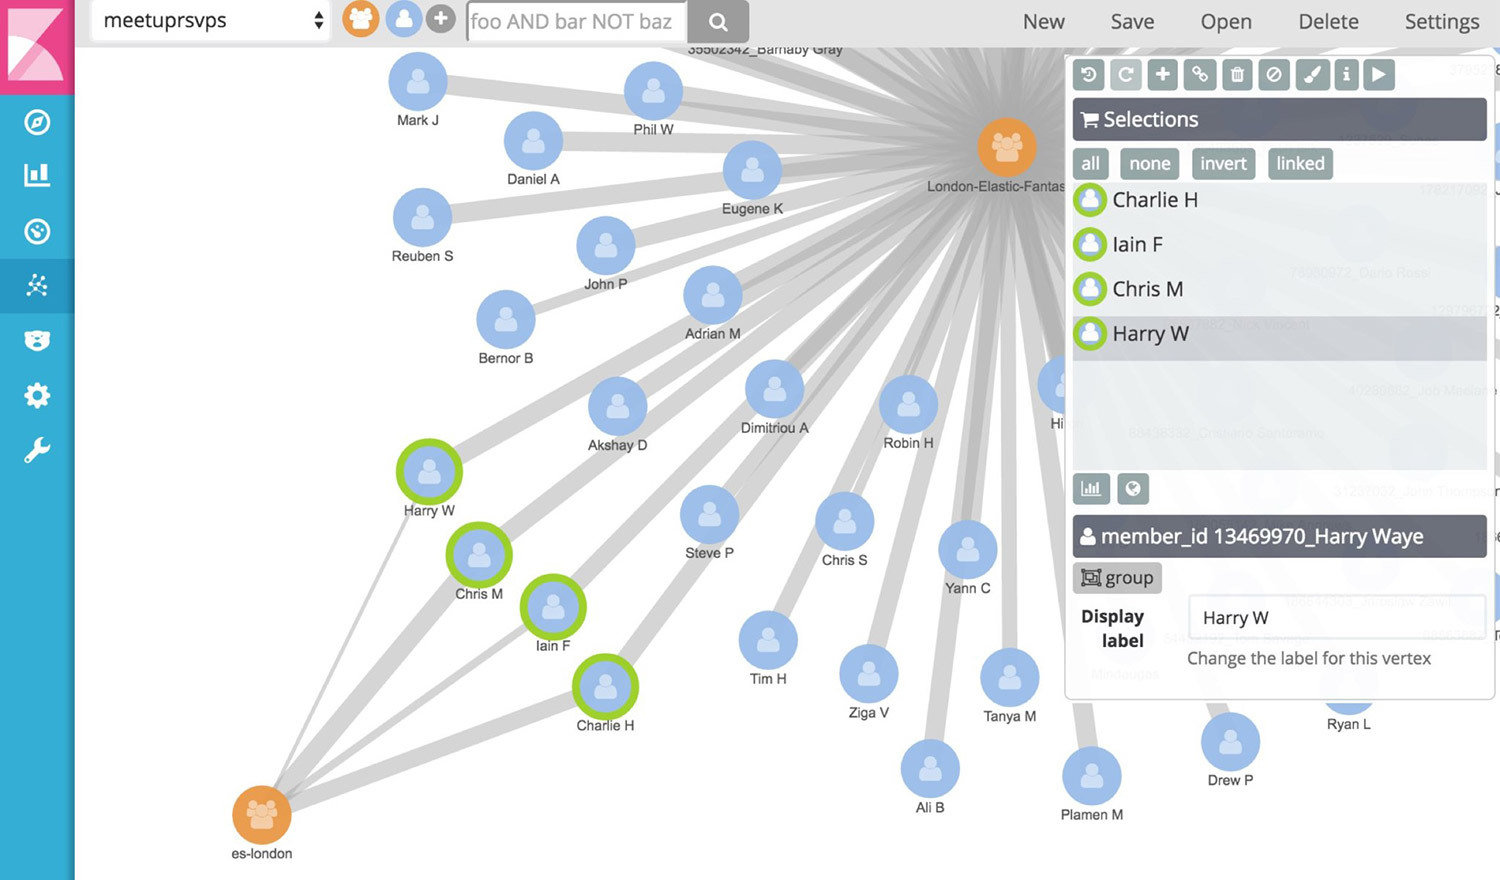
Search Syntax
The search syntax is pretty self-explanatory, and allows boolean operators, wildcards, and field filtering.

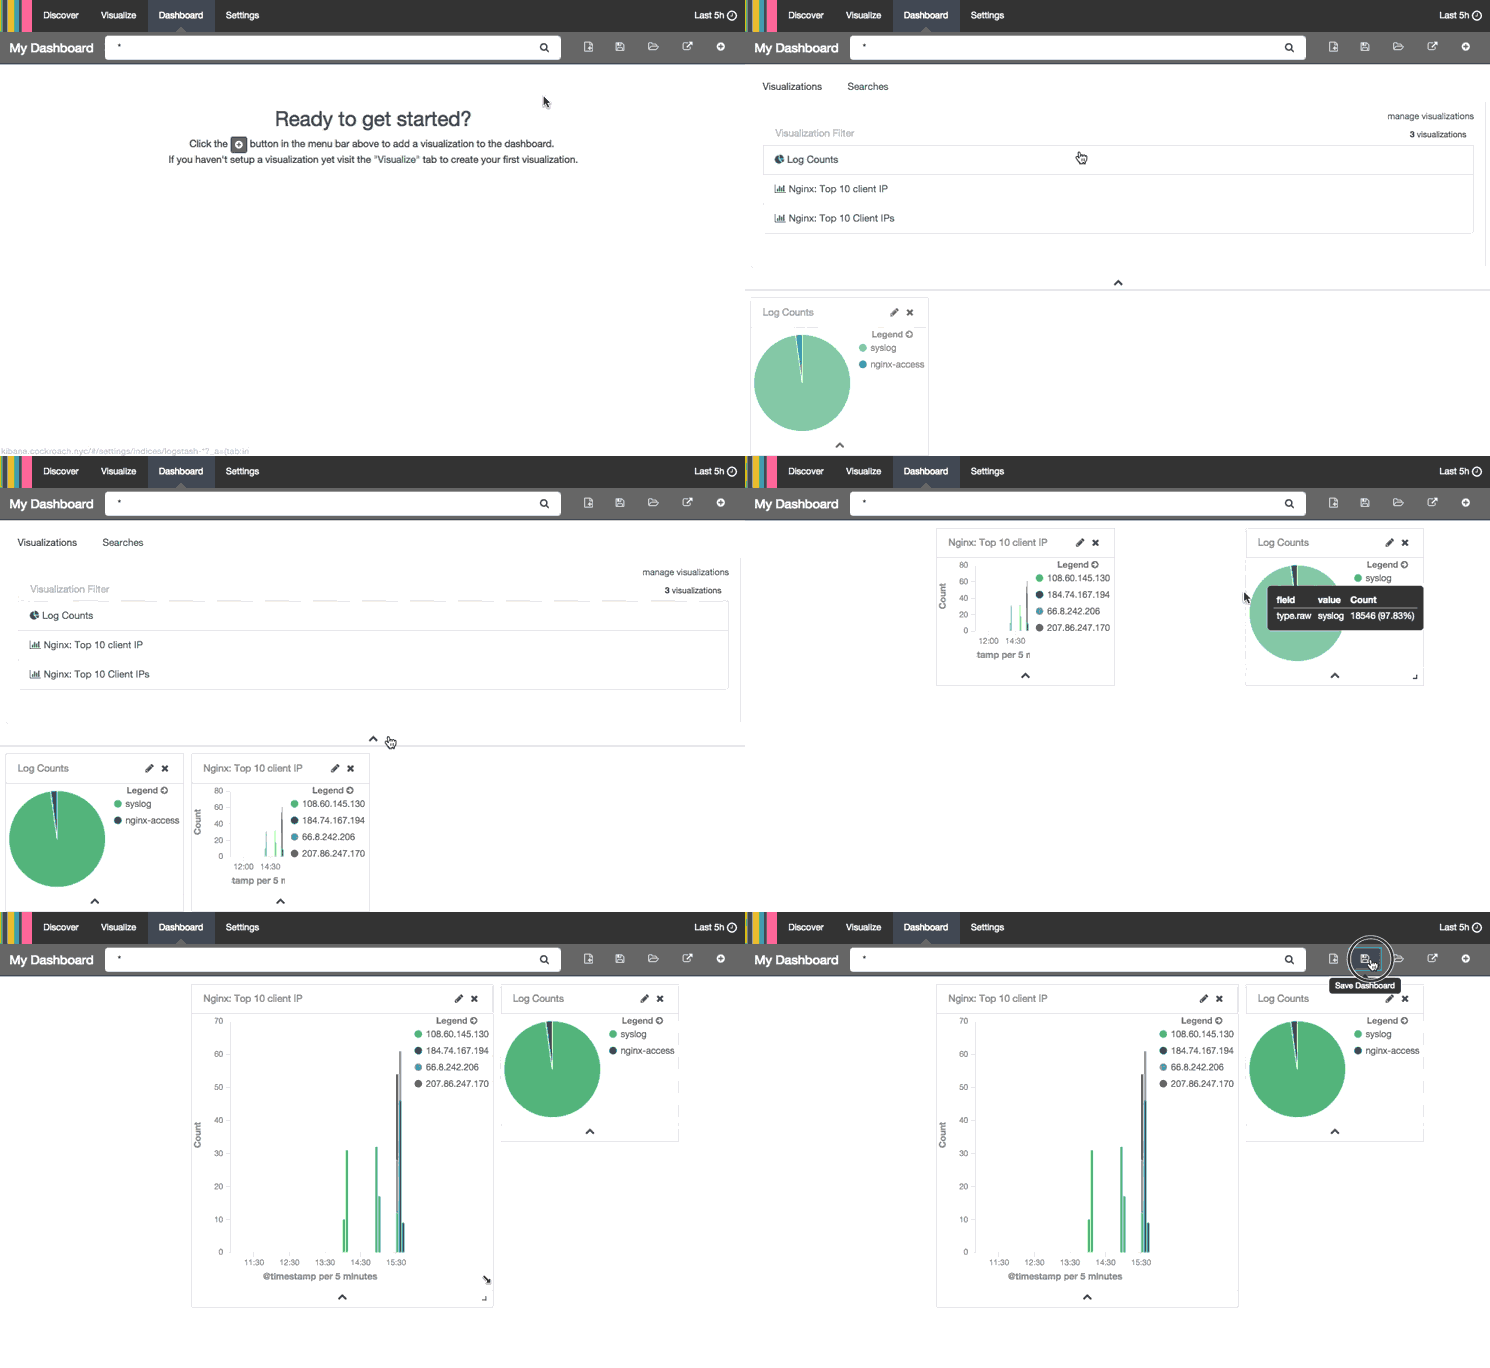
Dashboard
Combine multiple visualizations onto a single page, then filter them by providing a search query or by selecting filters by clicking elements in the visualization.
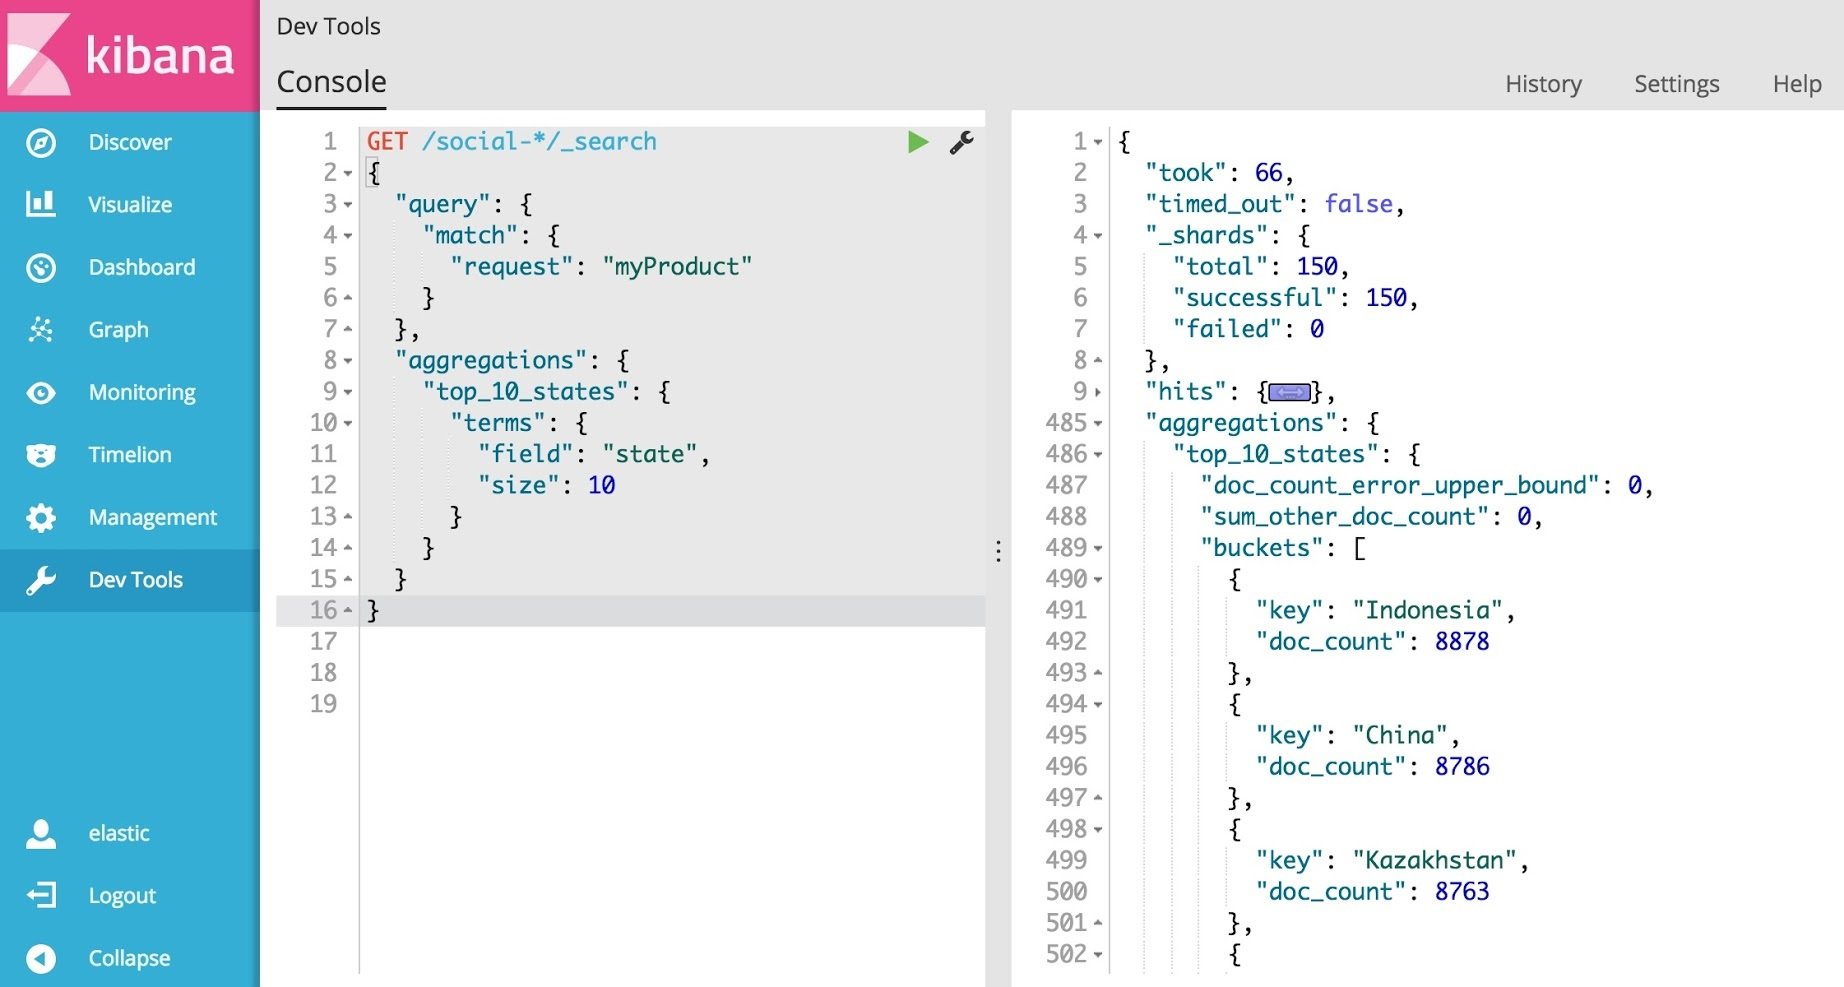
Dev Tools
Offer ways to develop Elastic Stack. Console bypass typing in the terminal and tinker with your Elasticsearch data using slick features like tab completion, a JSON parser, and Elasticsearch and API awareness
