Digital Mapping Ecosystems
DLF 2018 Workshop
http://bit.ly/dmedlf2018
(following along with the slides)
3:45 - 4:00 ------------ Introduction(s)
4:00 - 4:20 ------------ CARTO
4:20 - 4:30 ------------ break
4:30 - 4:55 ------------ Mapbox
4:55 - 5:20 ------------ GitHub
5:20 - 5:40 ------------ Feedback and Discussion
Provisional Schedule
CARTO
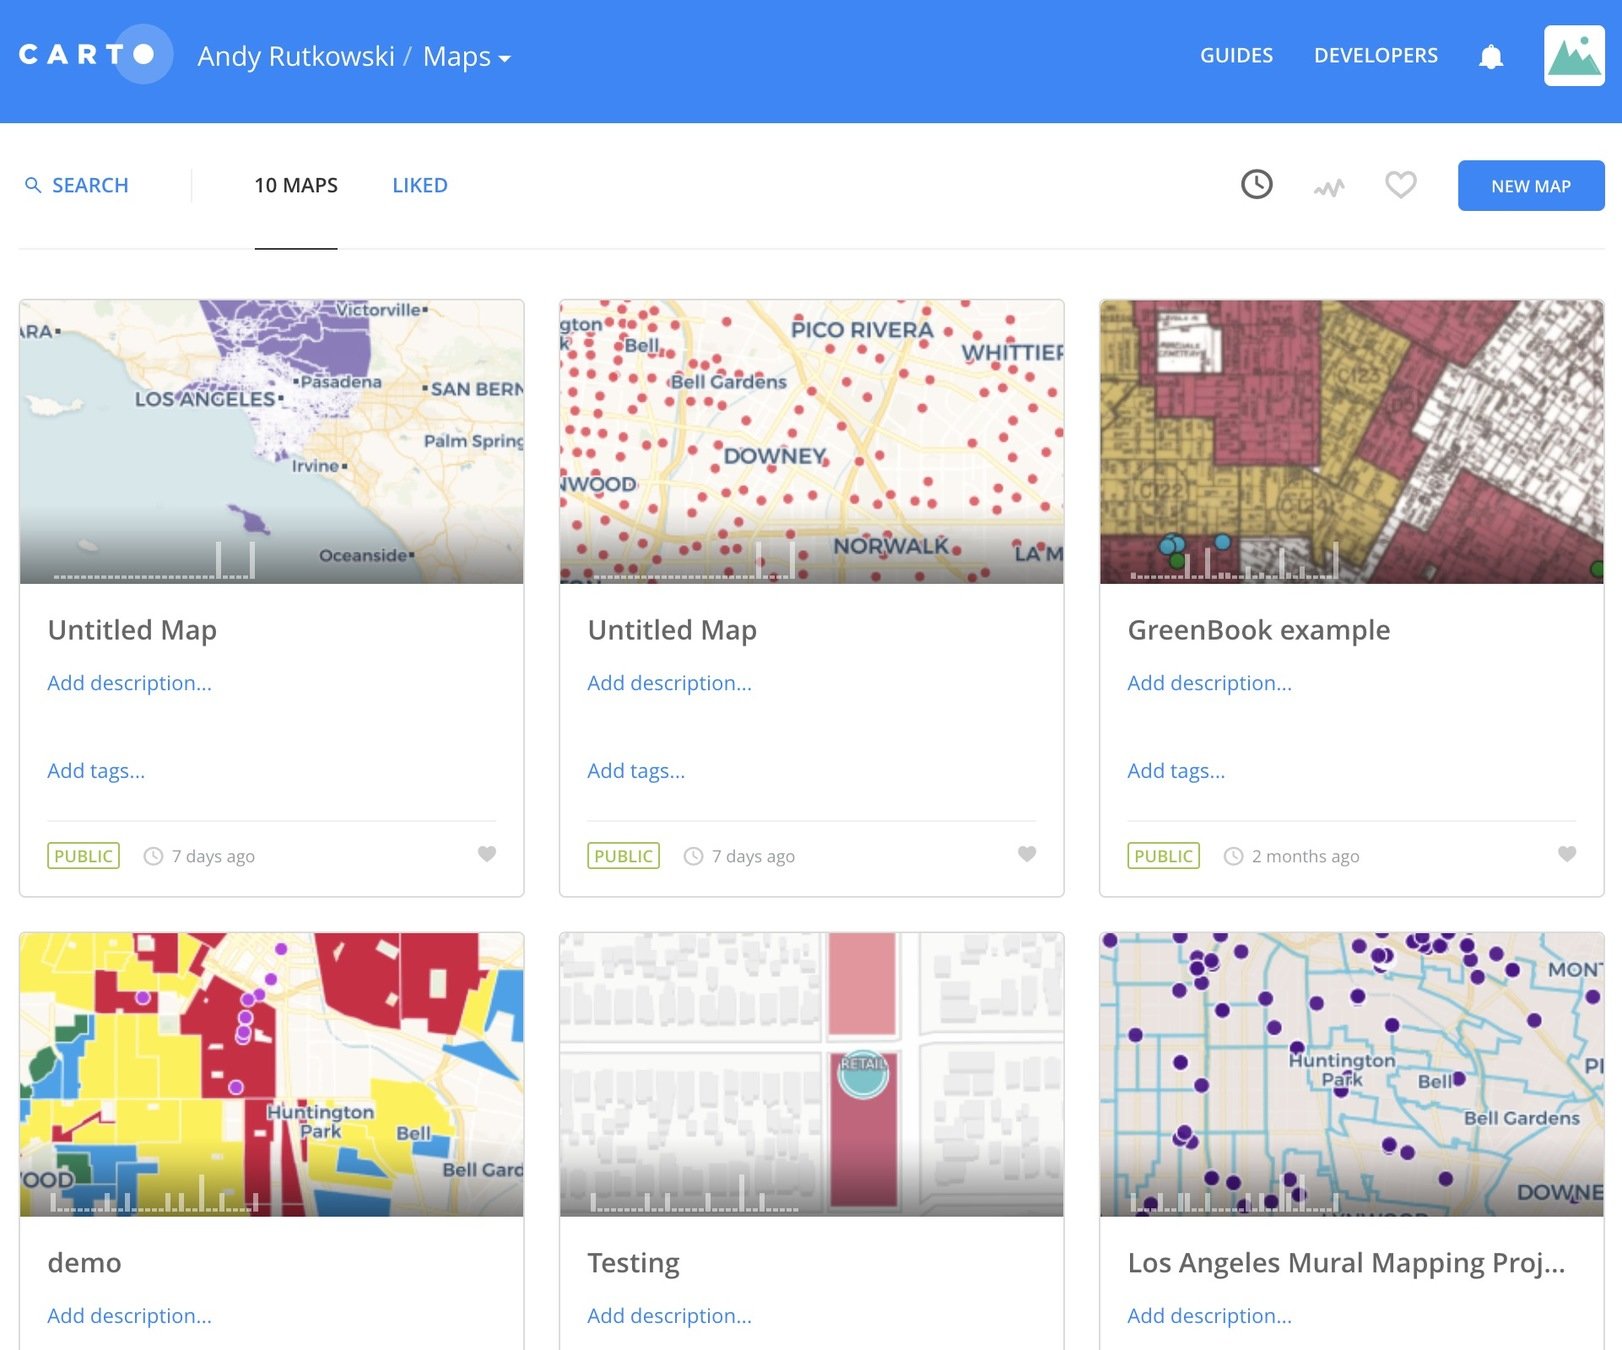
NEW MAP
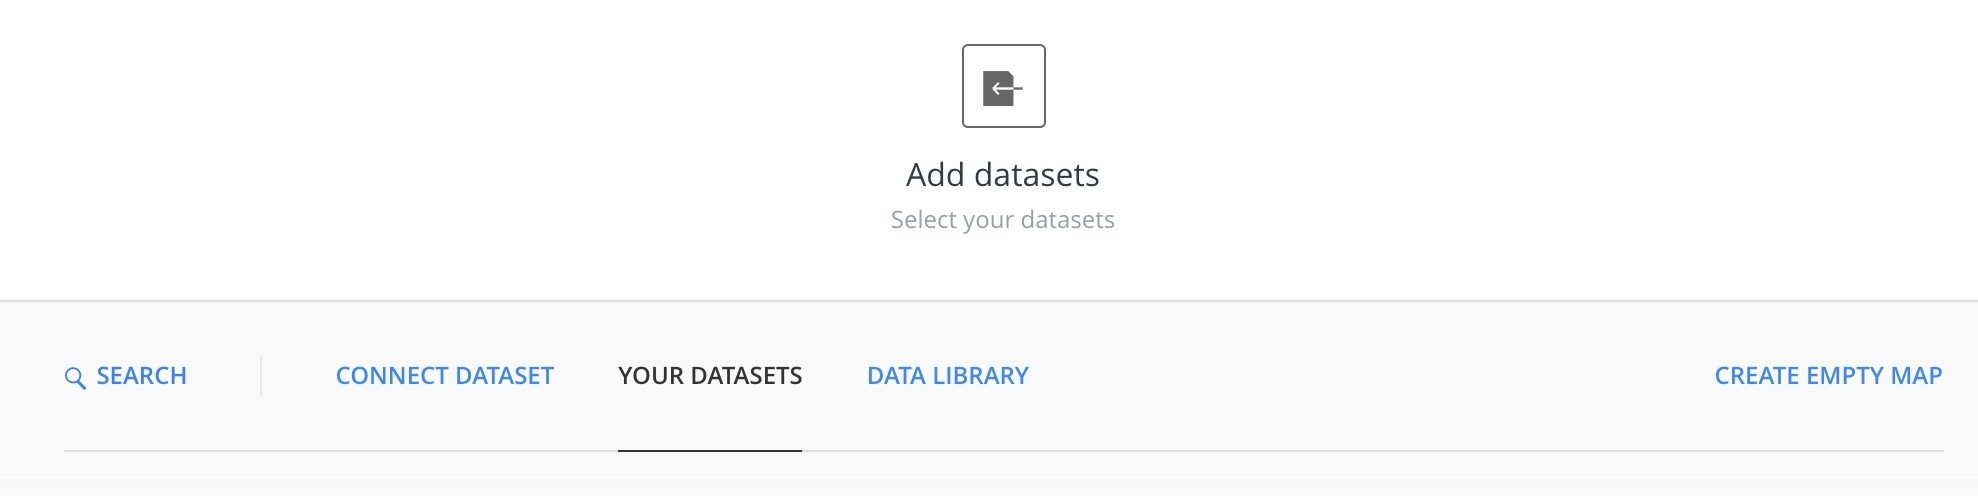
Connect a dataset

upload a file
lets start with the CSV files
39 GreenBook
47 GreenBook
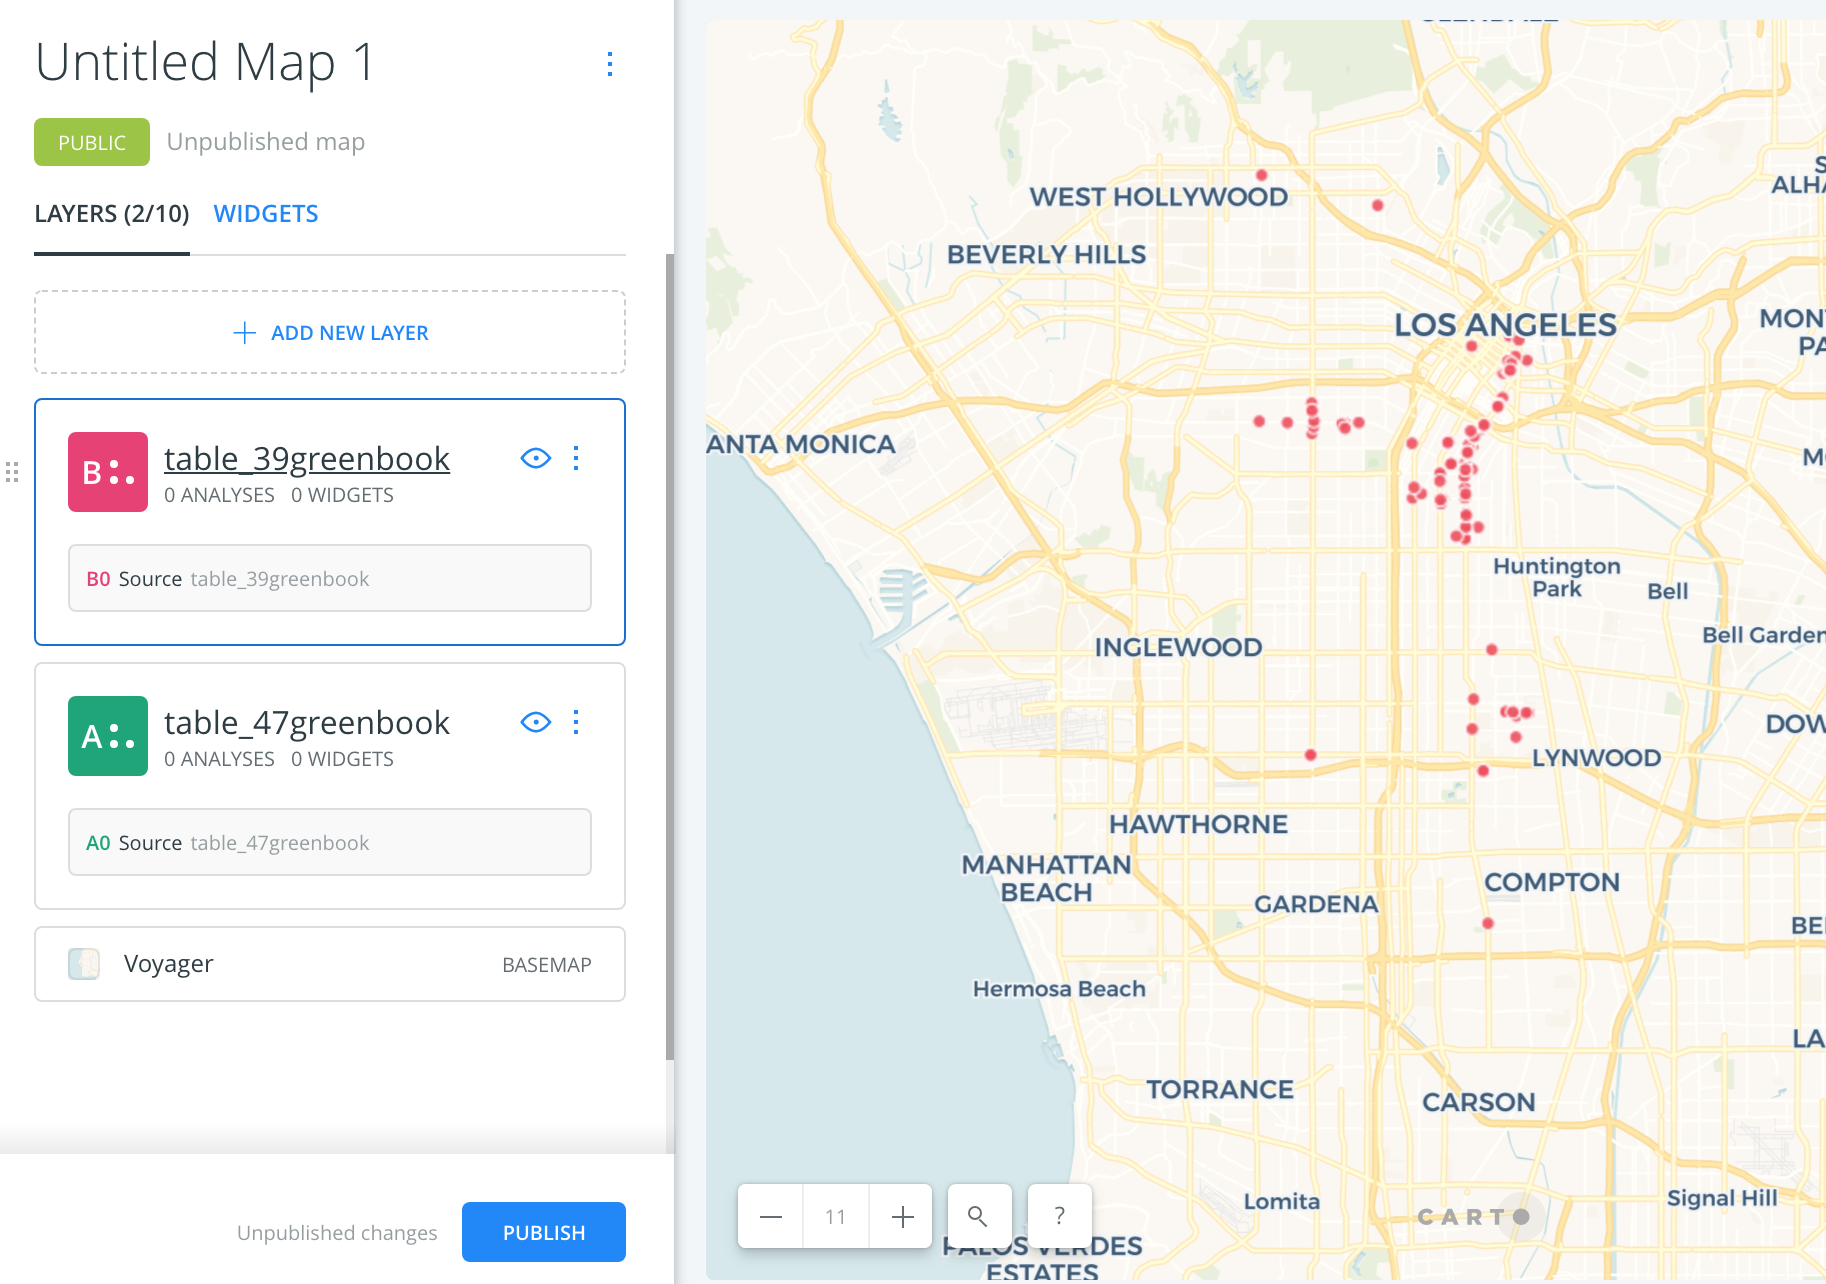
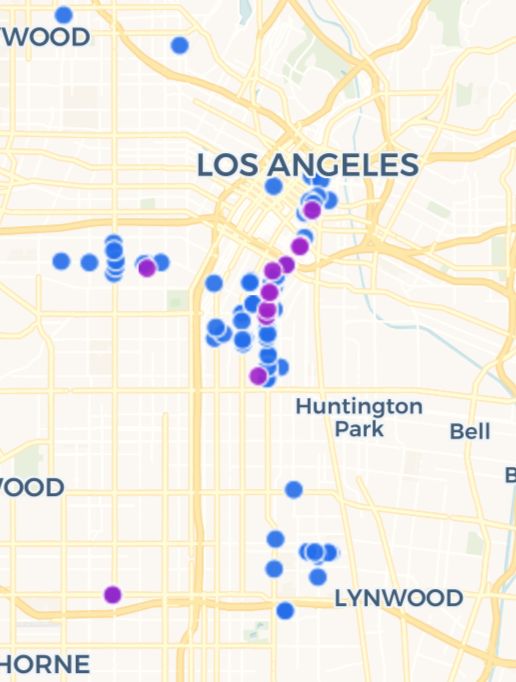
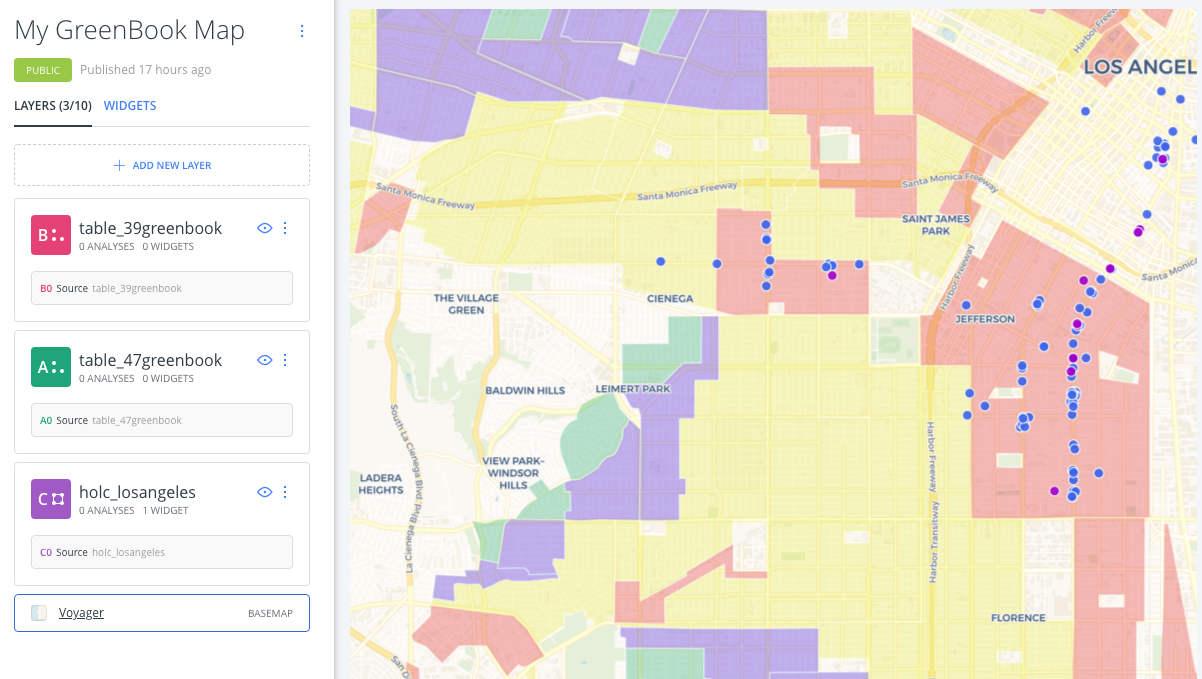
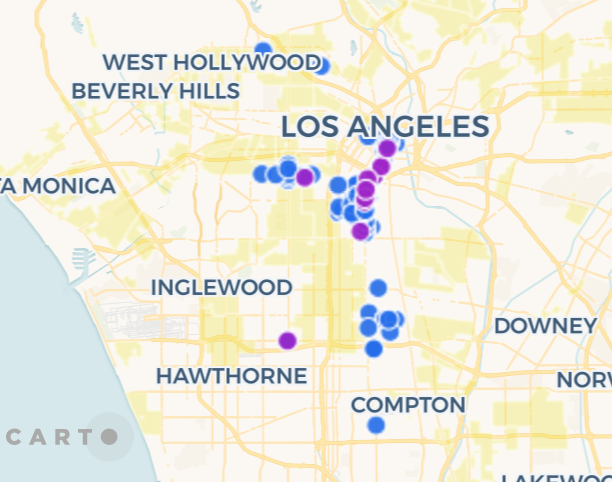
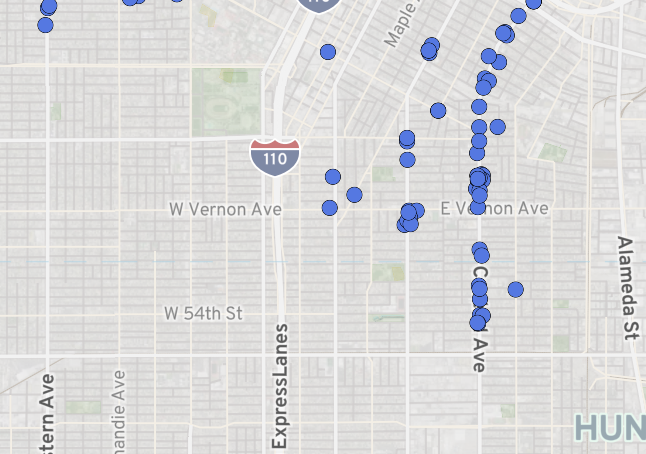
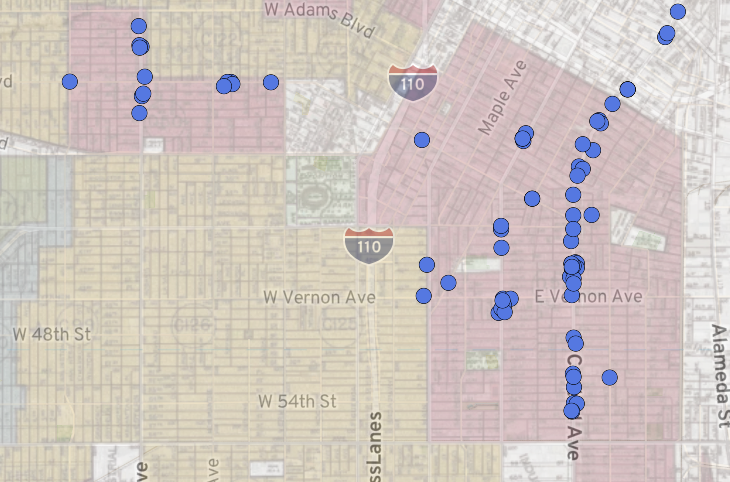
Your map should look something like this. Two layers in your list. Points on the map. Untitled.
Name your map!
Now click on one of the datasets.
Notice you have 5 tabs that let you work with your data in different ways.
For this workshop we are only going to look at DATA, STYLE, AND POP-UP.
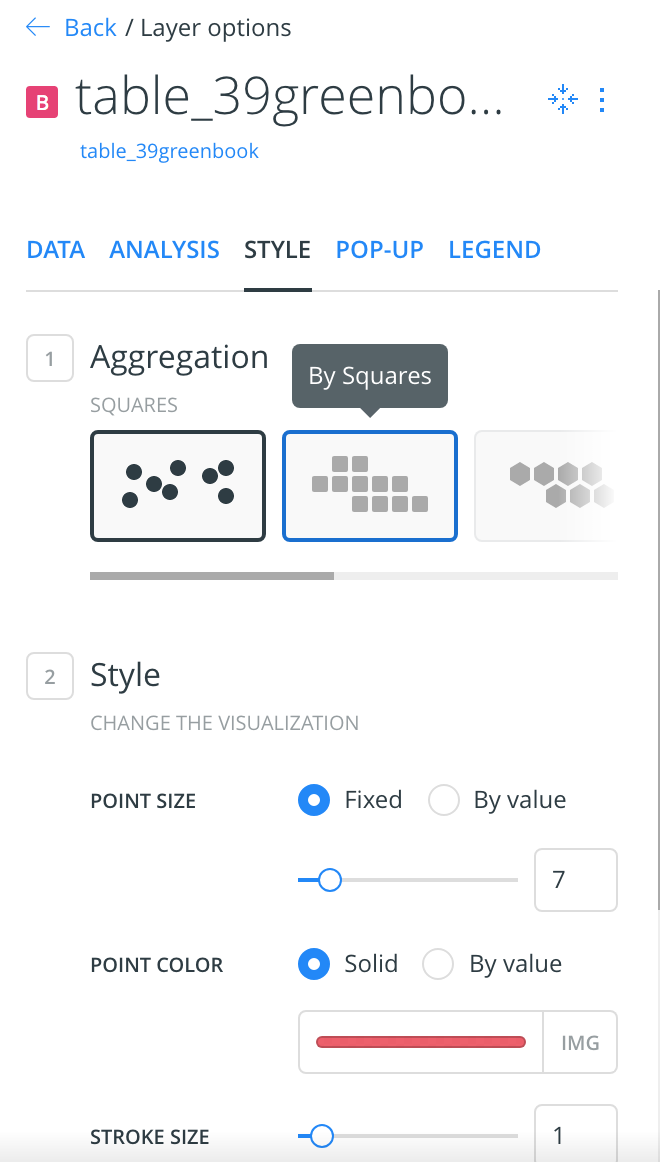
STYLE
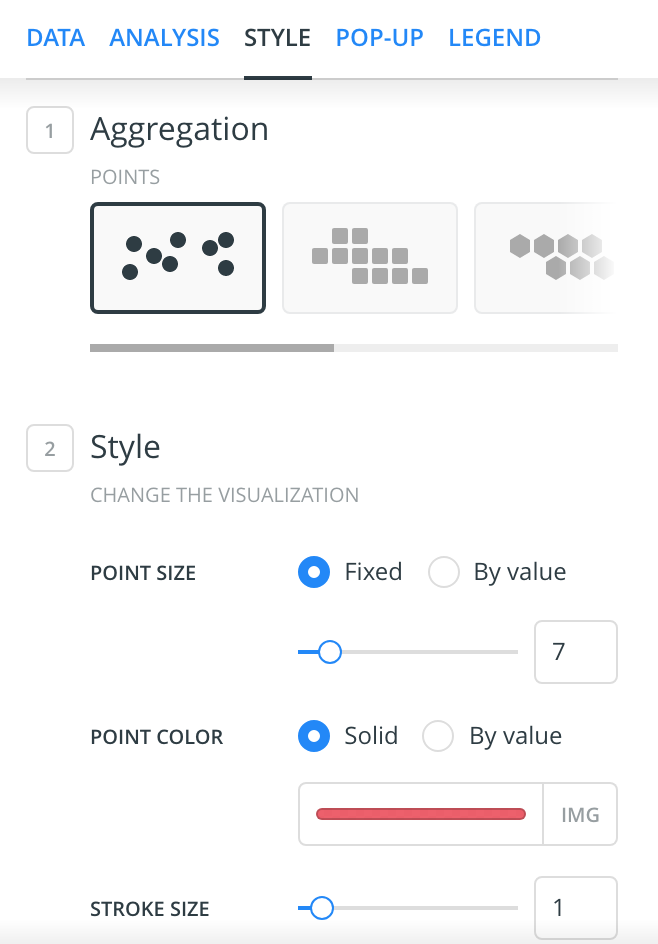
Here you can change the size of the point, the color, and how you aggregate it.
Leave the aggregation alone but change the point size using the fixed option and the color using the solid option.
Make your points a little larger and give each layer a distinct color.
POP-UP
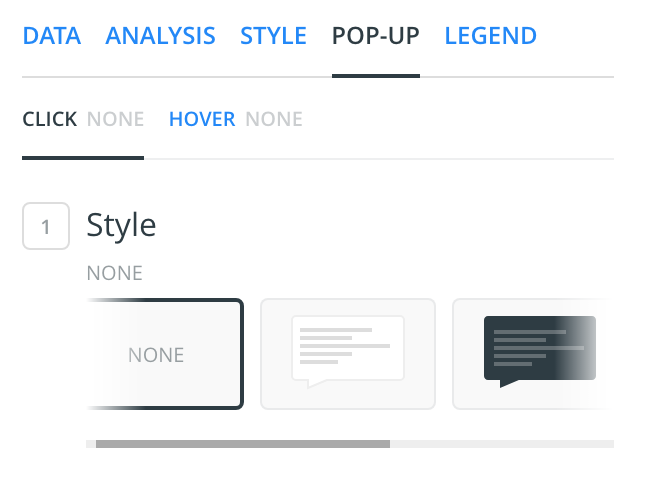
Configure the pop-up on a click function or on a hover function.
Using the data fields you can chose what to display, including images.
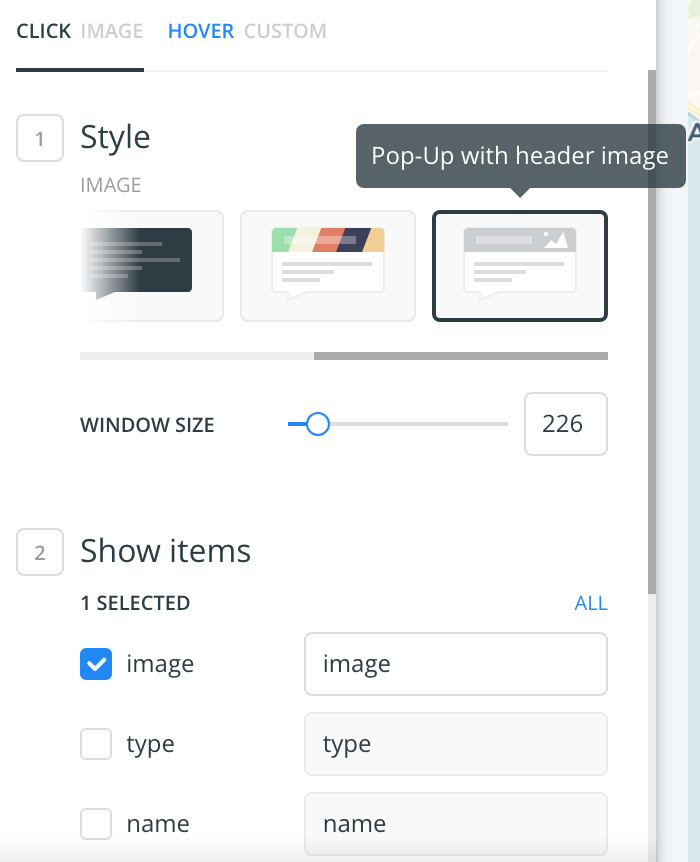
Select the "click" option. Then select "Pop-Up with header image."
You will need to drag the image field to the top.
Select any other fields you would like to display.
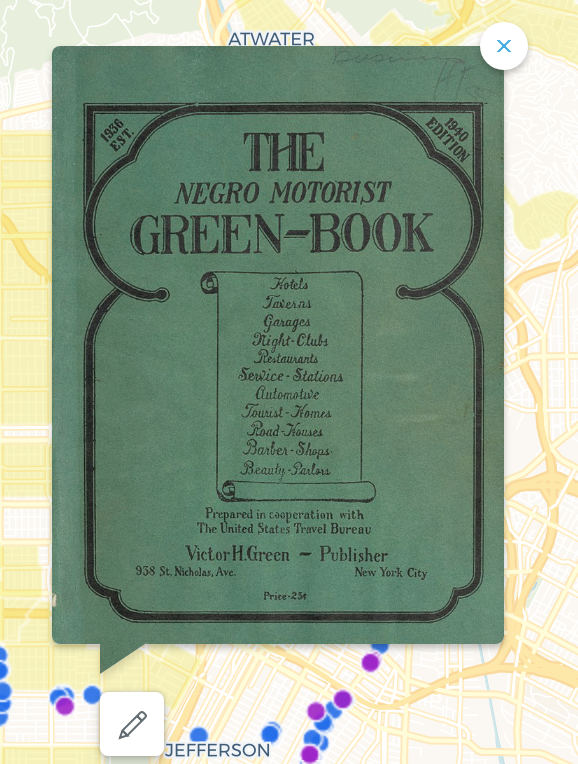
Here it is in action
Now switch over to the "Hover" pop-up option.
One very cool thing that you can do is get at the HTML for how to display the pop-up. Click on HTML.
Using the "image" field we can display an image on the hover.
Take this code and paste it in and see what happens!
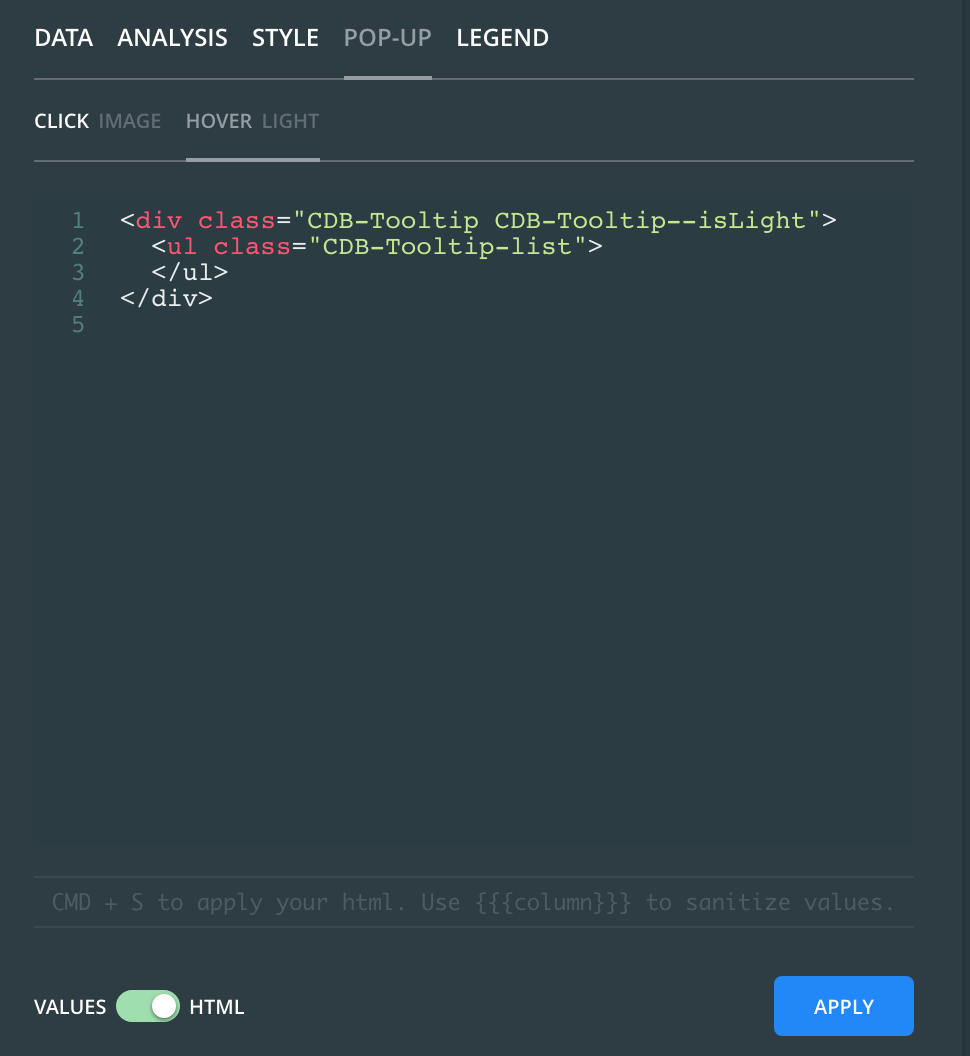
<div class="CDB-Tooltip CDB-Tooltip--isDark">
  <ul class="CDB-Tooltip-list">
      <li class="CDB-Tooltip-listItem">
            <div class="cartodb-tooltip-content">
		<p><img width=150

src={{image}}></p>
	</div>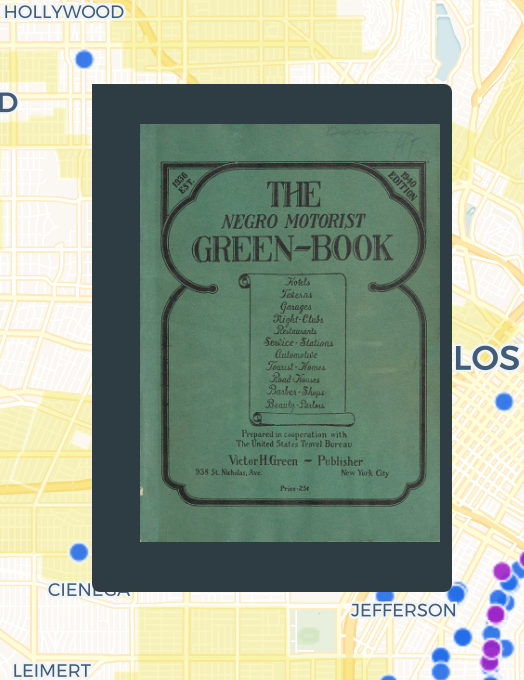
Same result but you only need to hover.
Lets add another layer of data
HOLC_LosAngeles.geojson
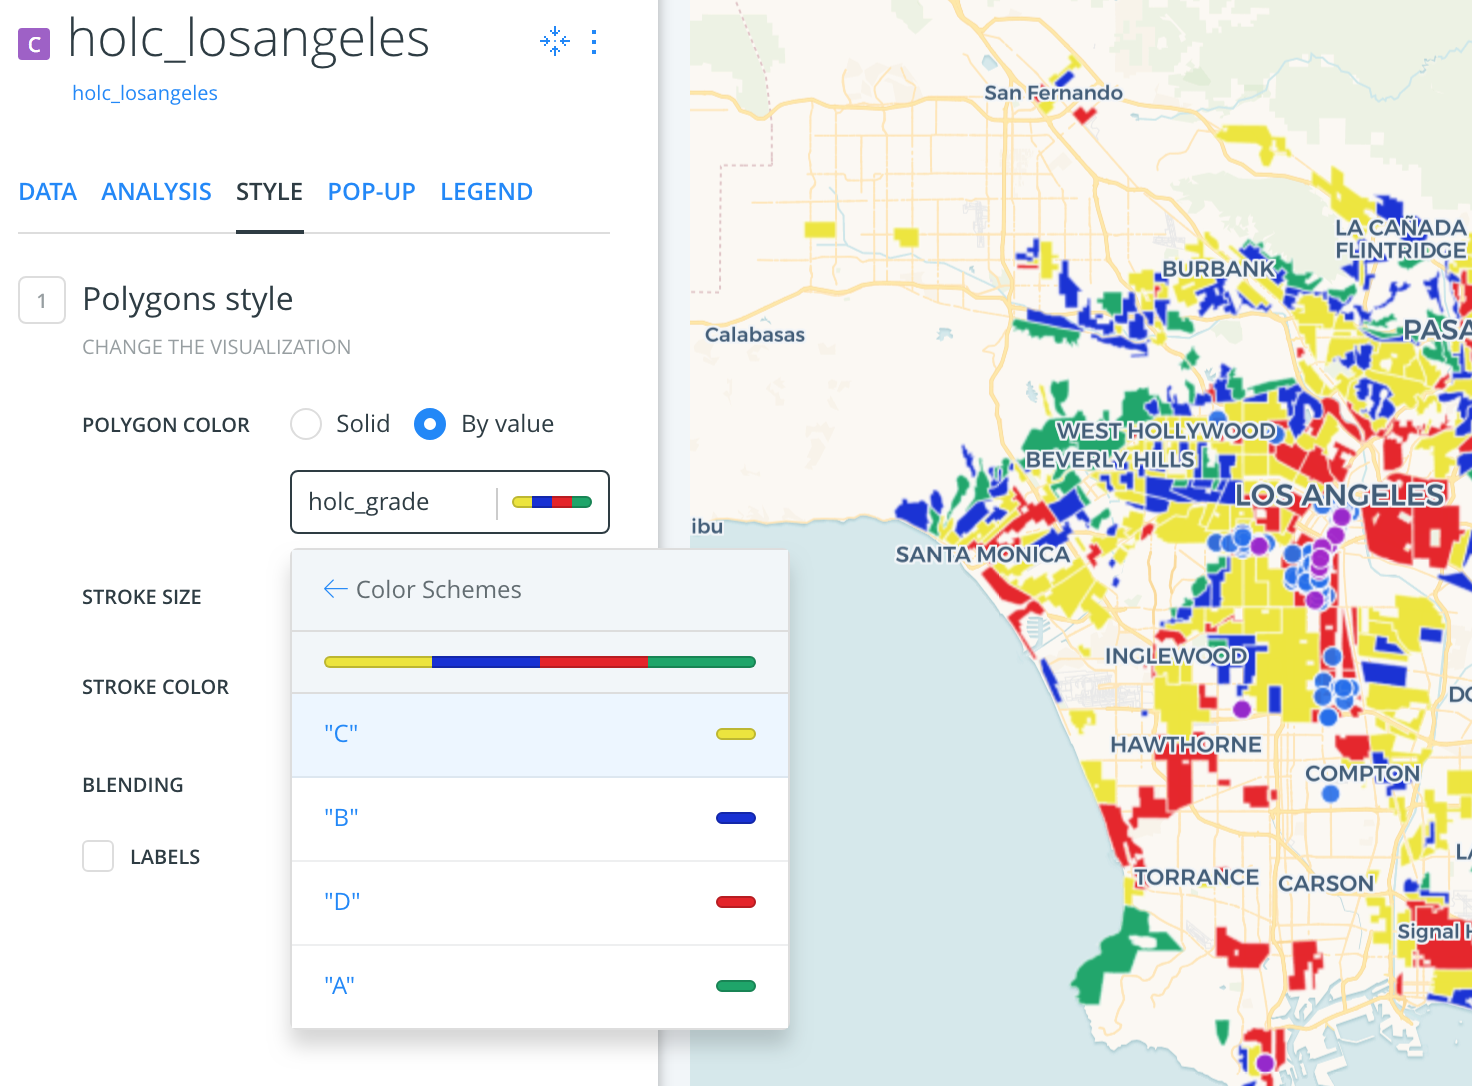
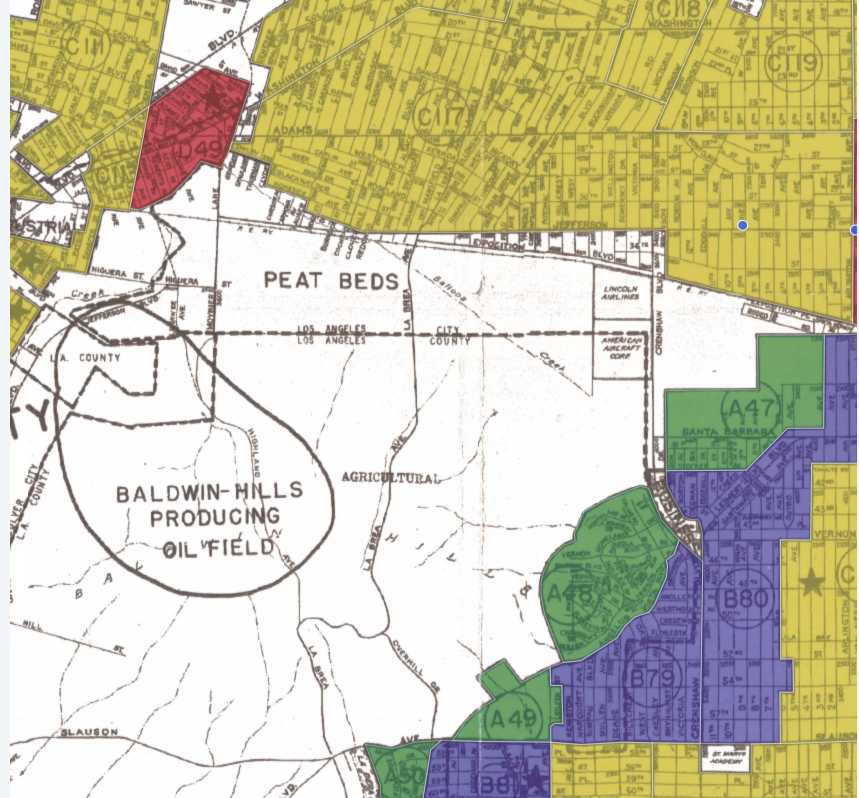
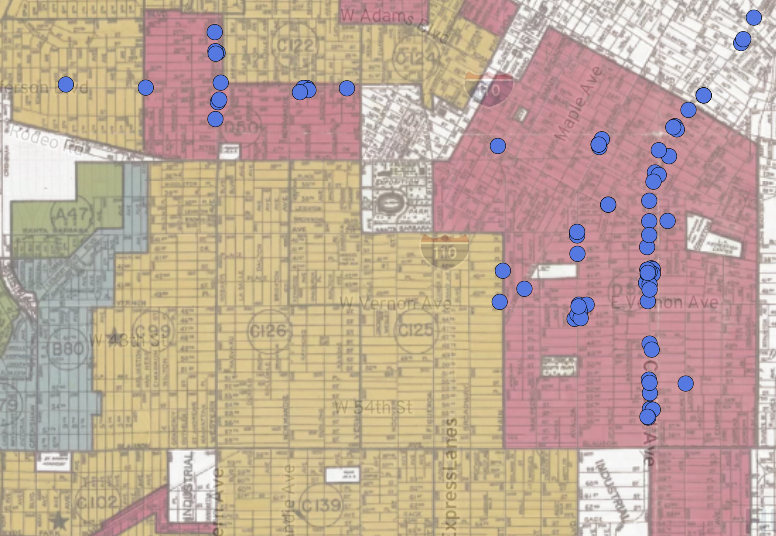
This time style by value and chose the holc_grade.
X out of the color sets that are offered and design your own.
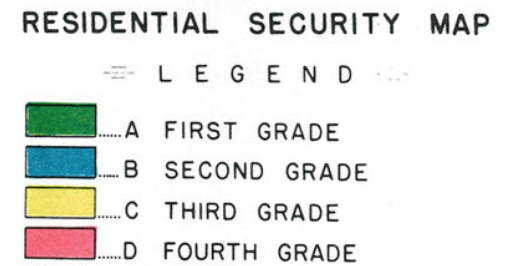
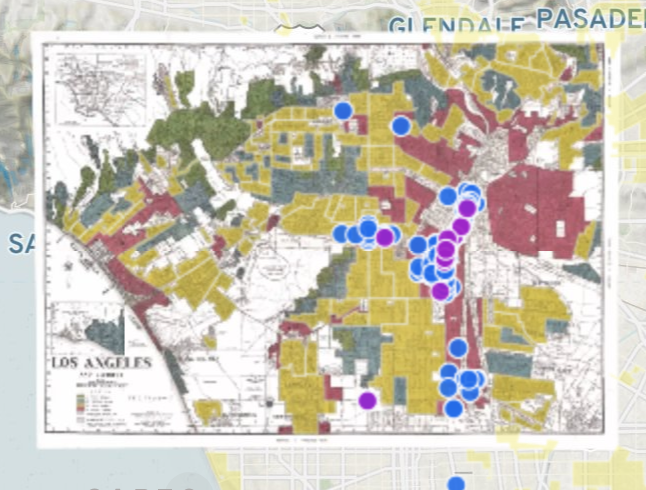
The original HOLC Grades for reference:
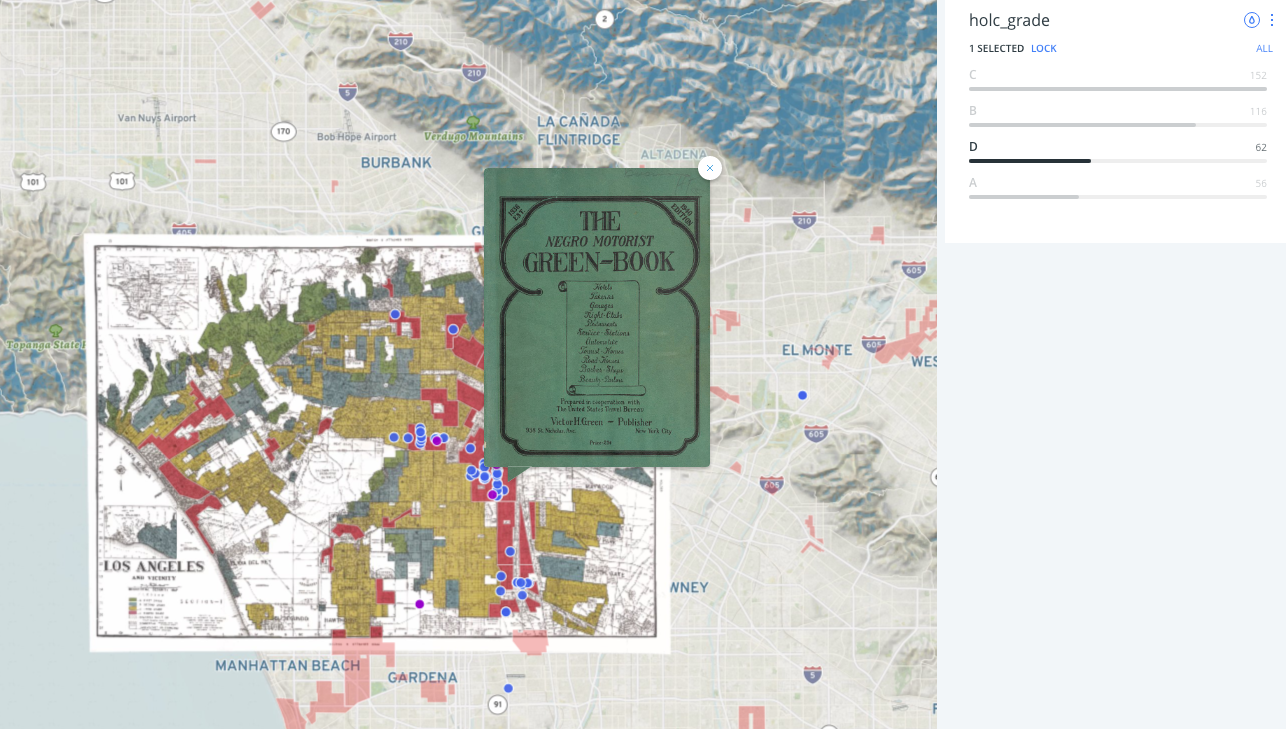
Lets work with the "DATA" tab.
Check off the holc_grade
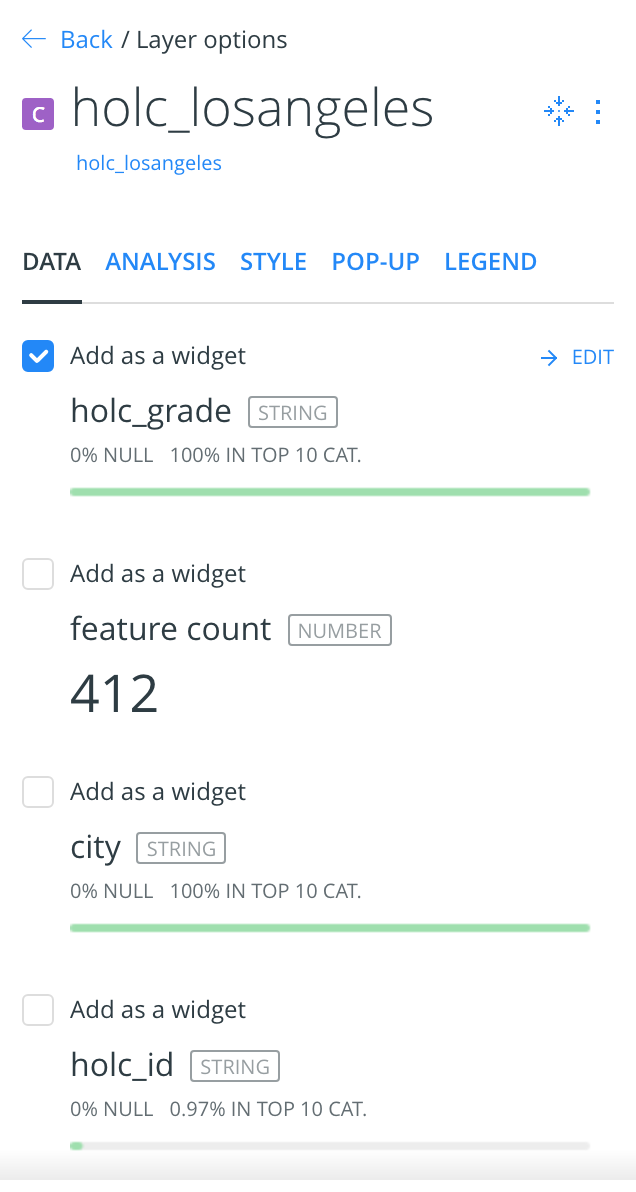
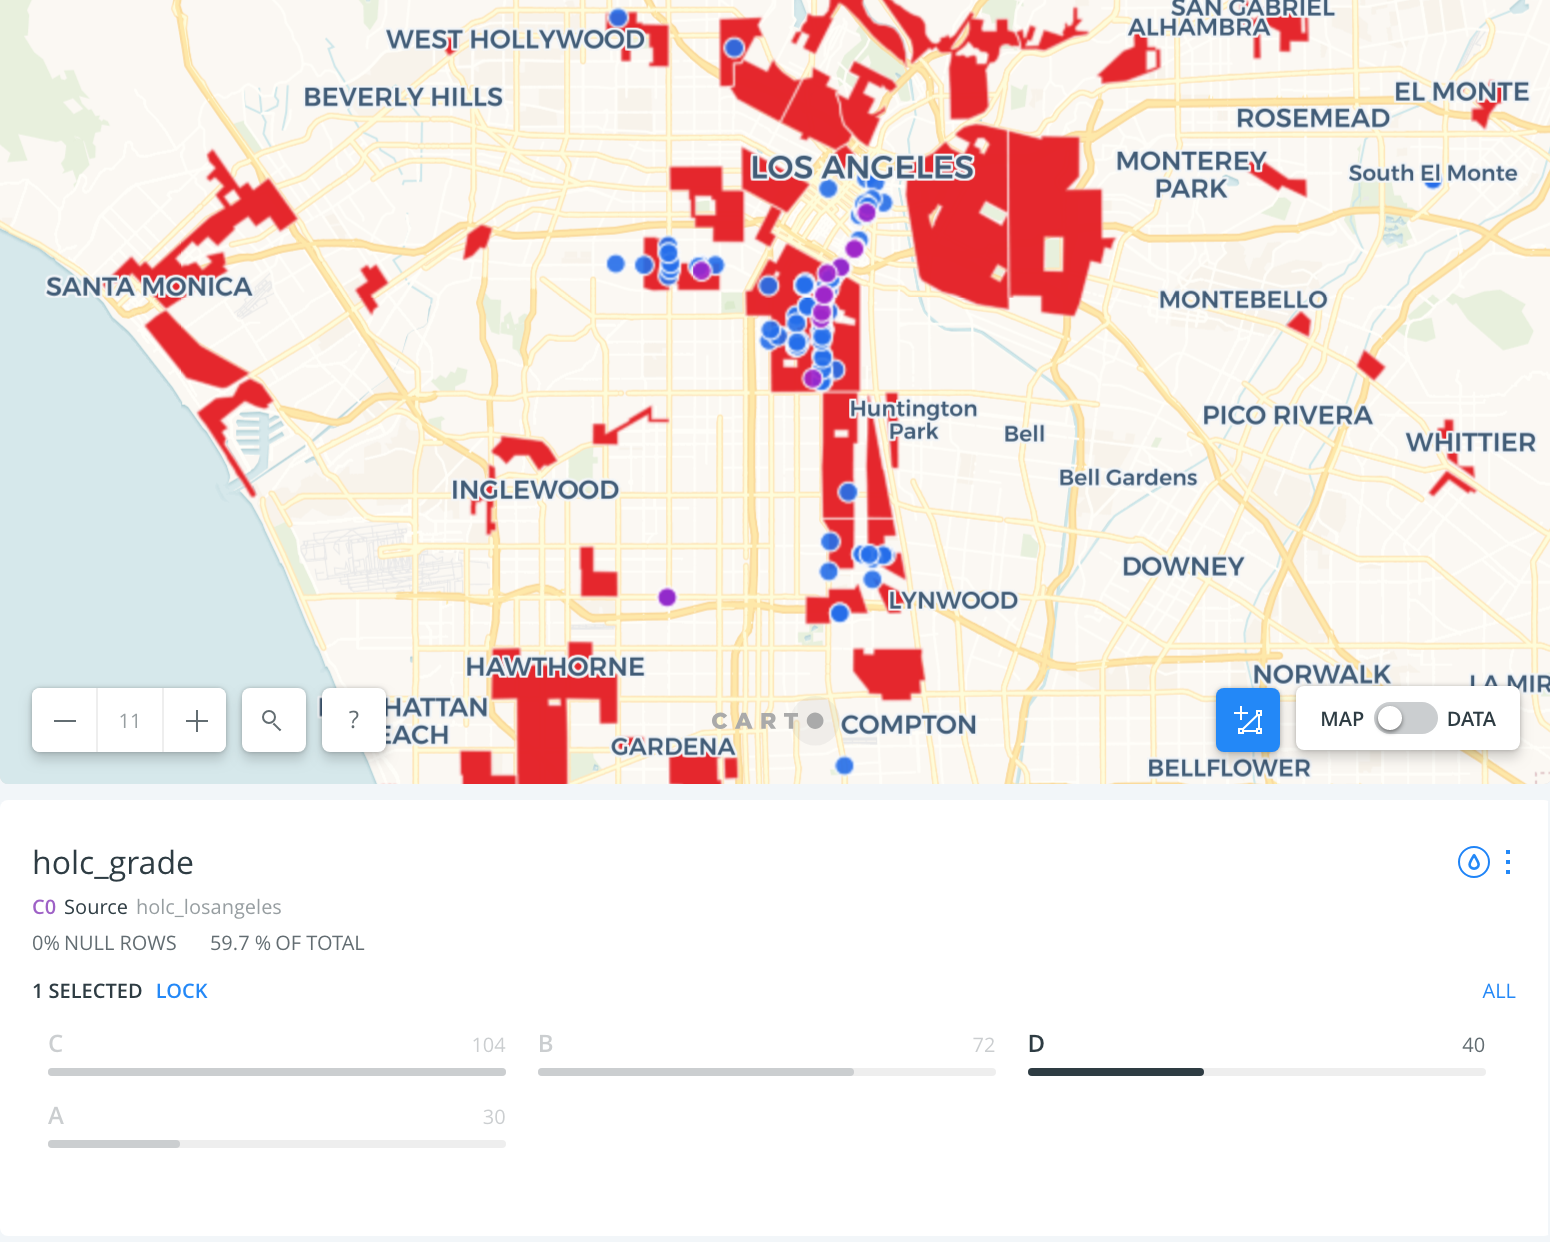
widget functions as filter

publish the map.
now we will go to mapbox to create a historical map baselayer
Click on the arrow and navigate right
MAPBOX
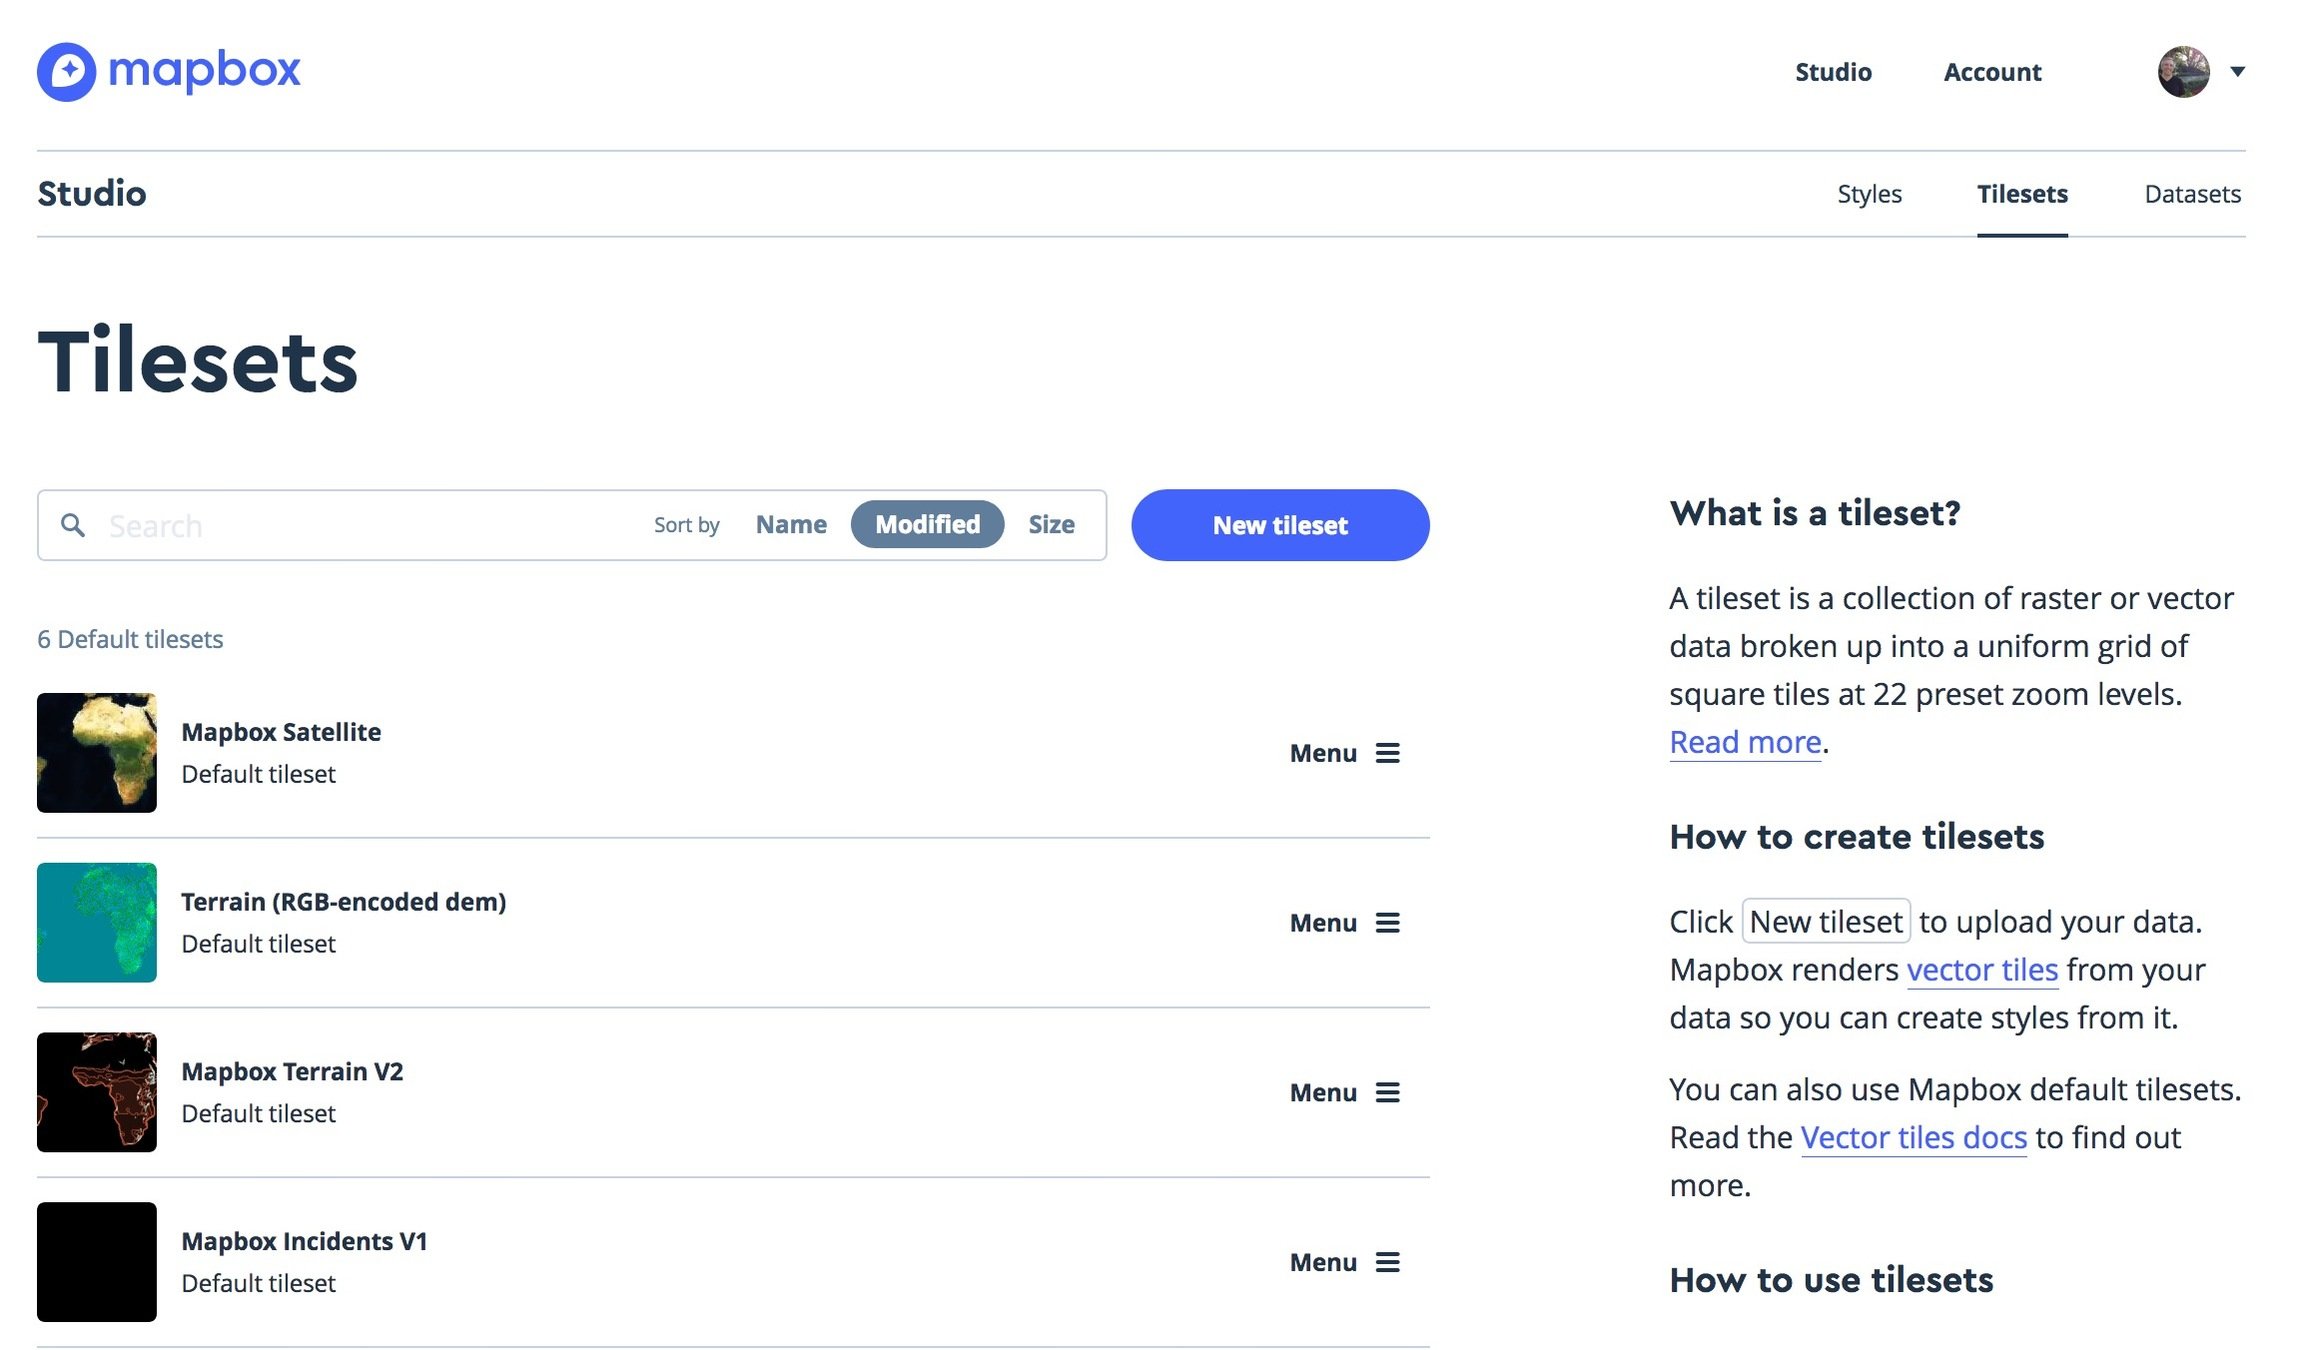
This will be a very cursory introduction to Mapbox. The basic premise is that we will be using Mapbox as a place to host and share historical maps (and other data).

In Mapbox click on "Tilesets."
create new tileset
Upload CentralLA Geotiff
It will take a few minutes to upload . . .10 minute break. Caffeinate, hydrate, and/or fix up your CARTO maps etc.
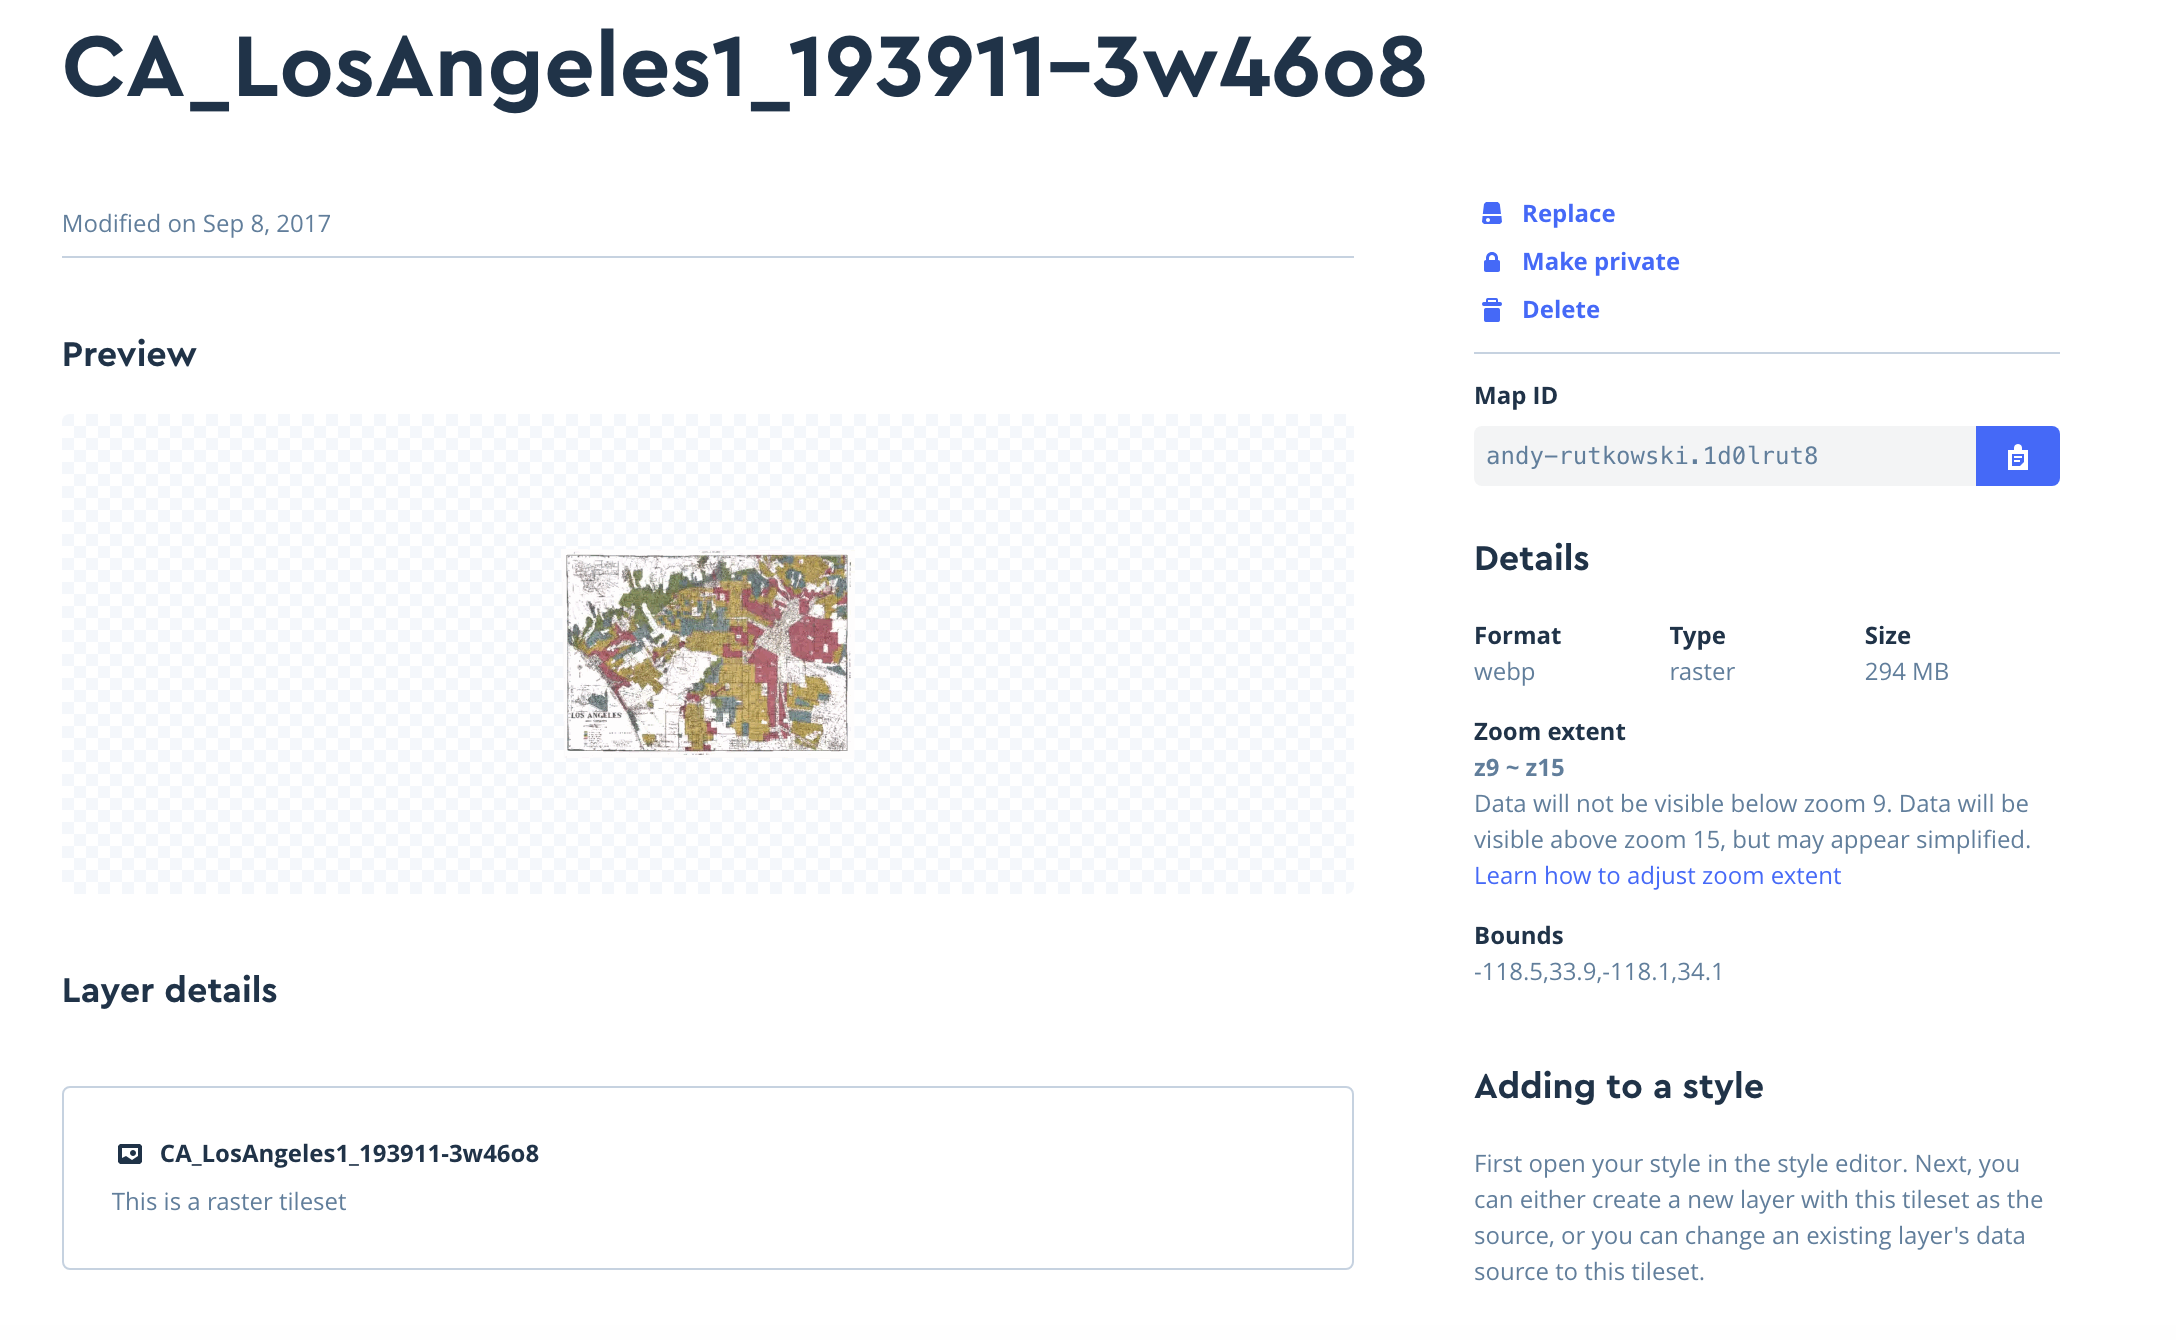
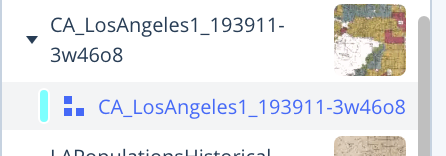
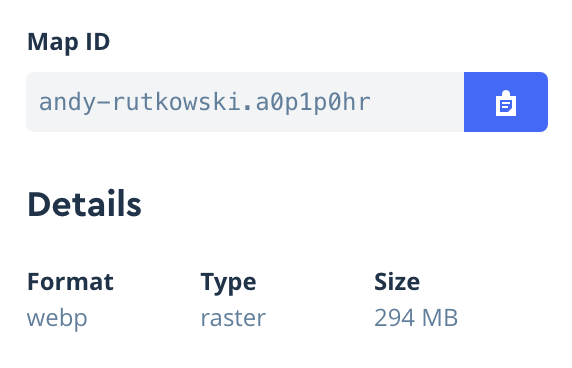
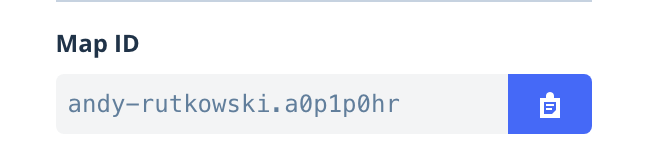
Once uploaded you should see something like this. Notice the, name, the Map ID, and the Type in details which is raster. We will be using those later!
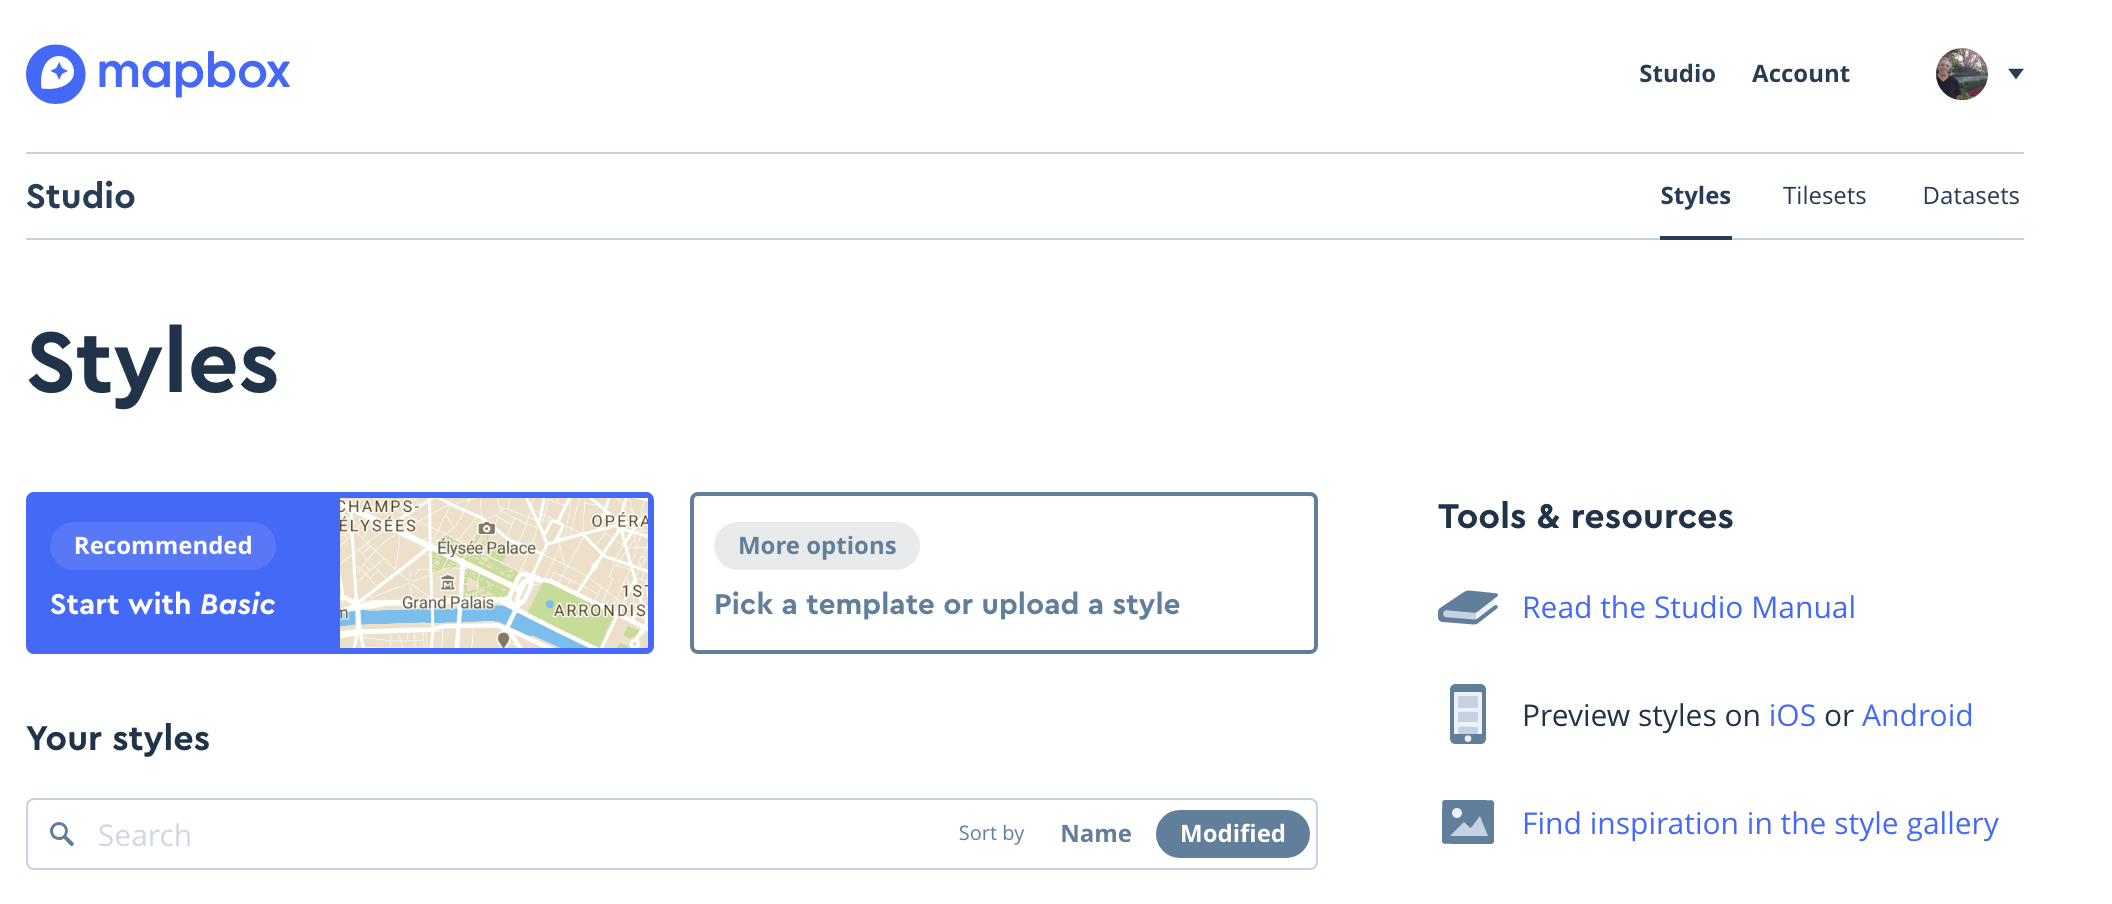
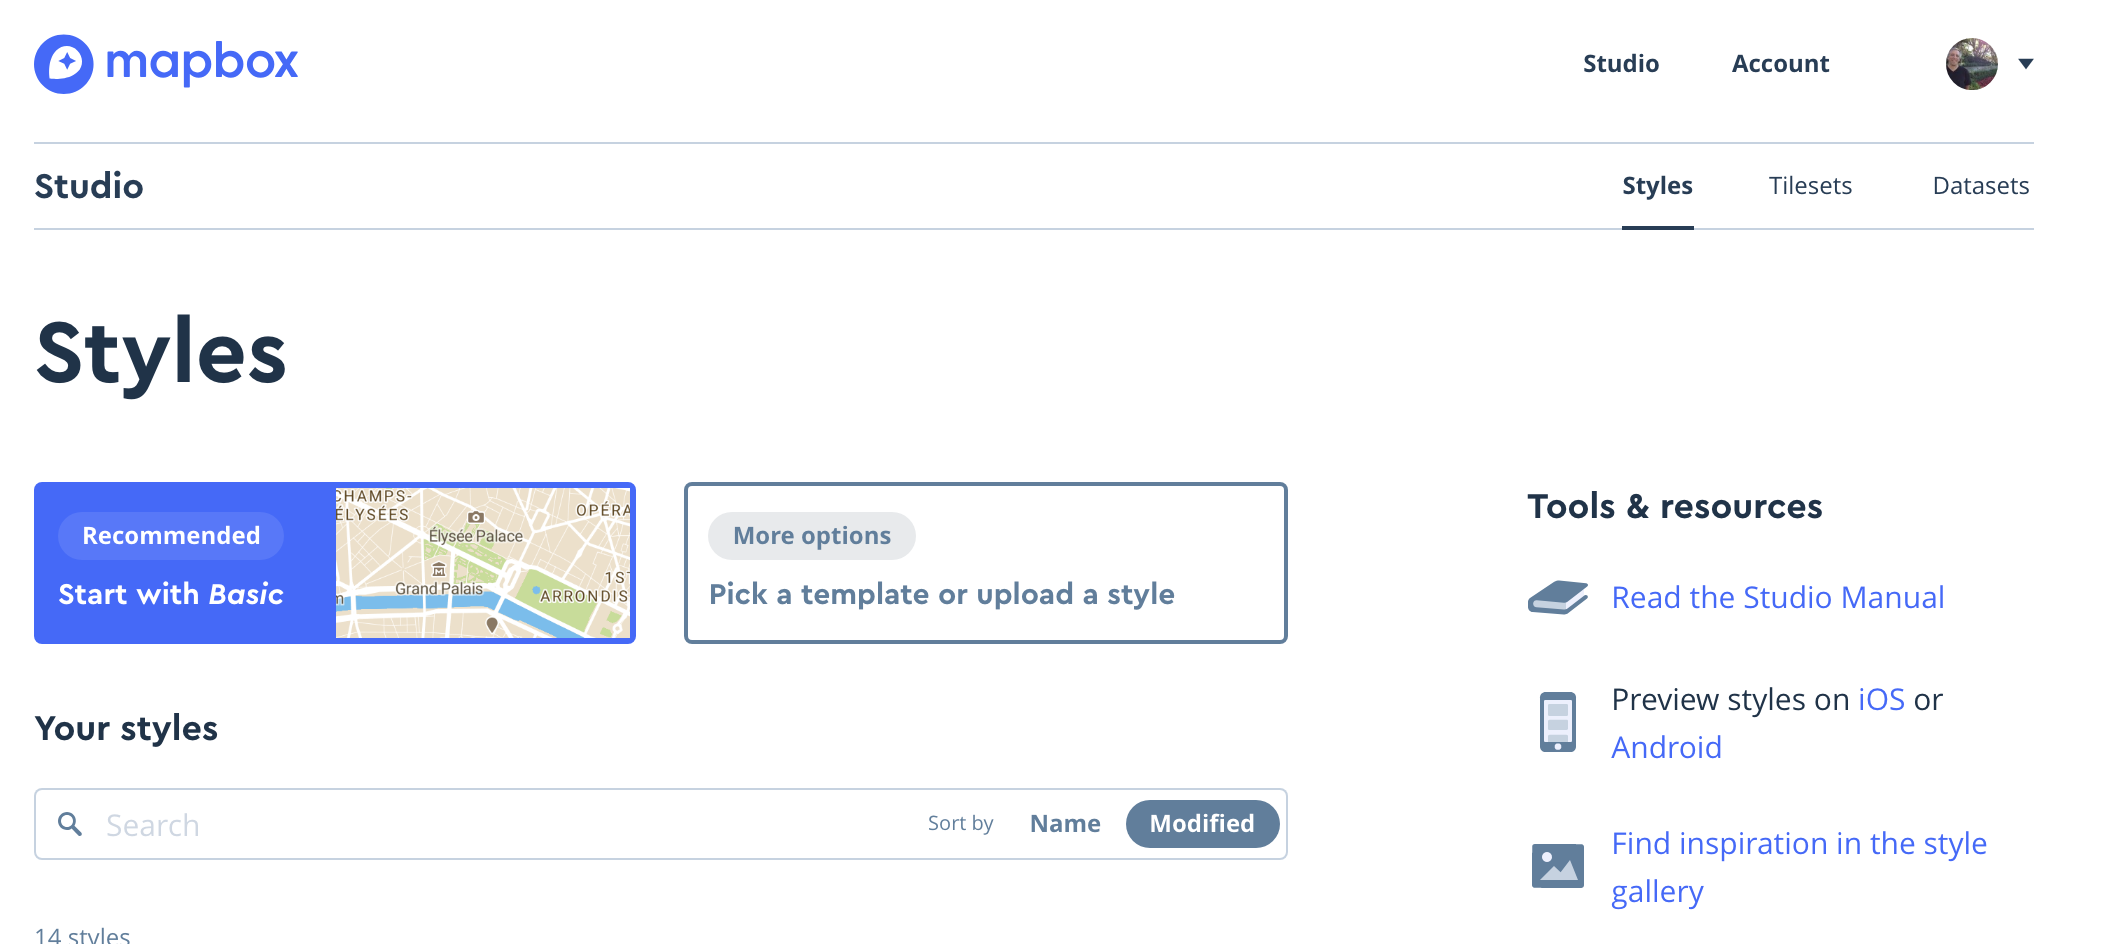
Now click on "Style" and then select "More options."
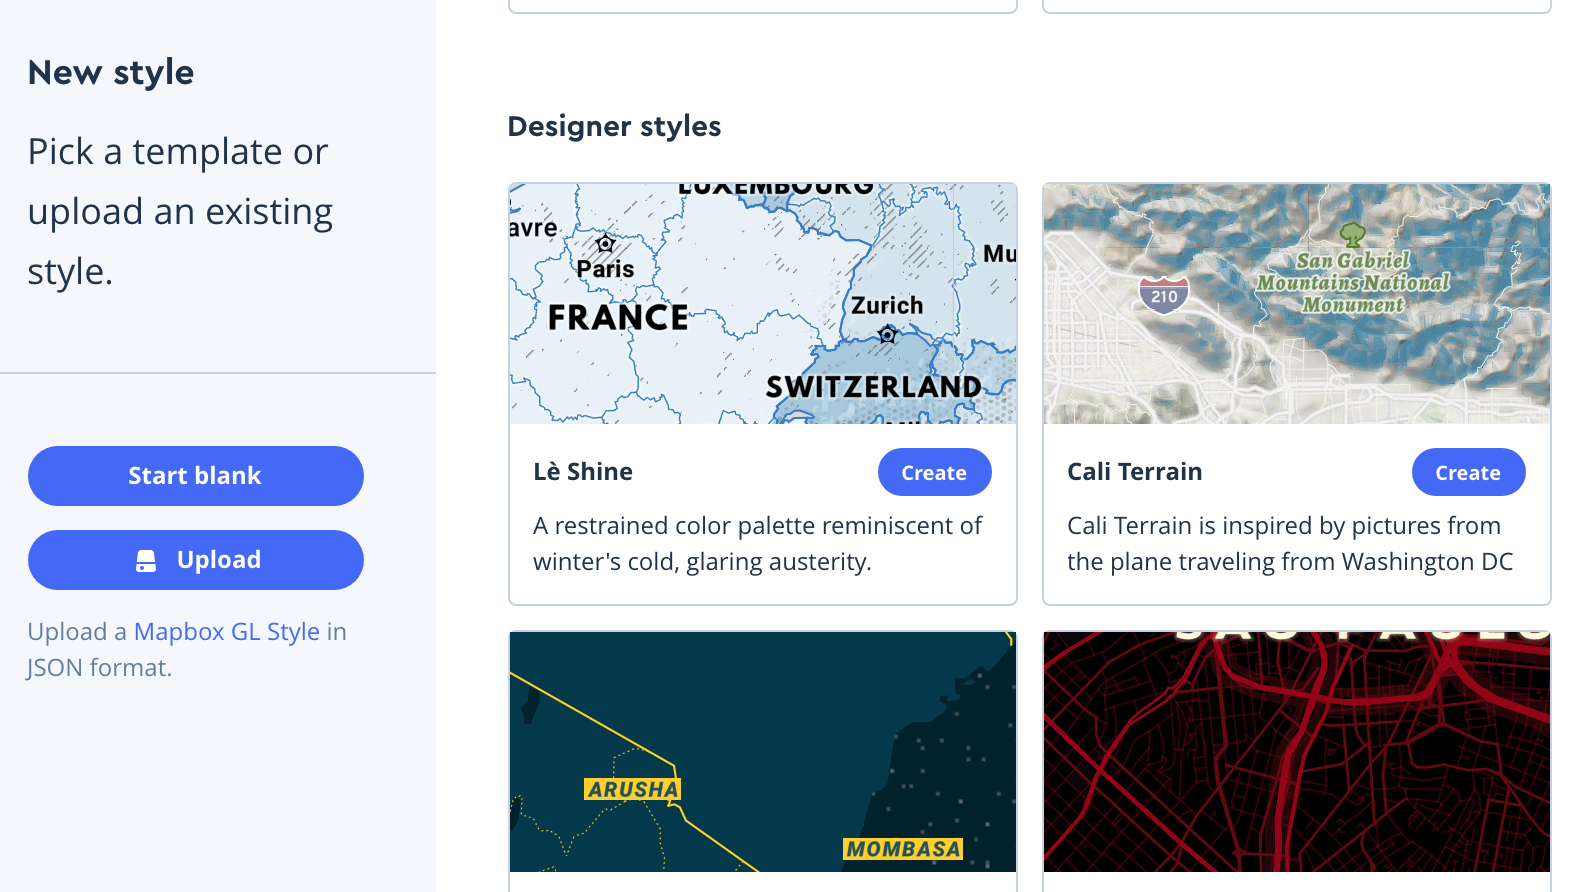
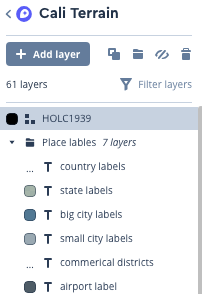
Scroll through and find "Cali Terrain" and click on "Create."
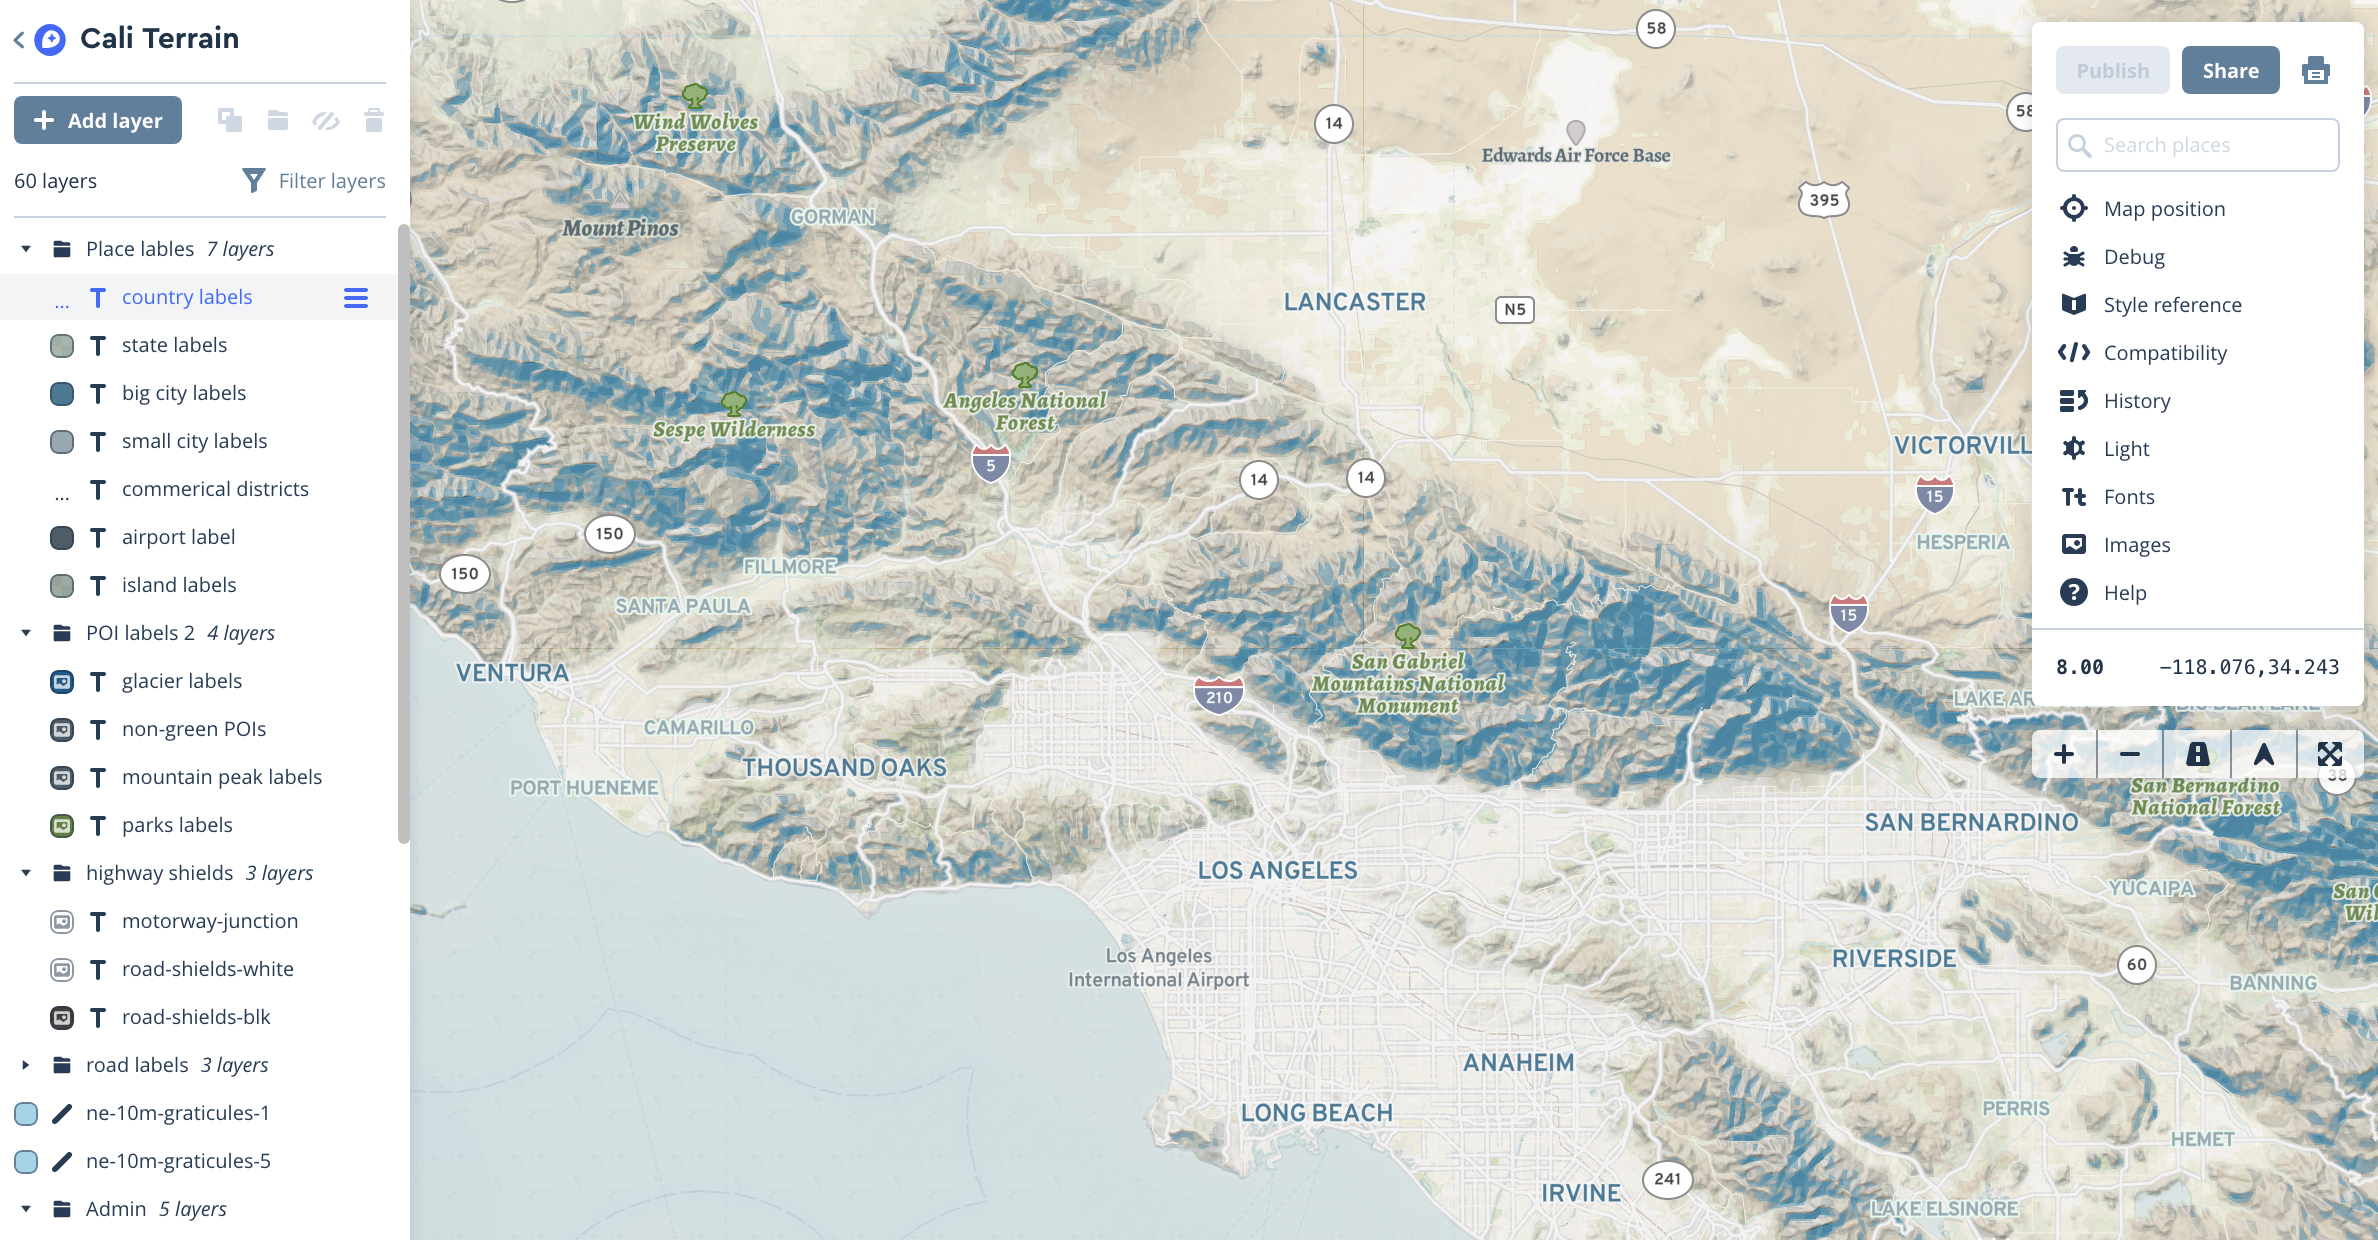
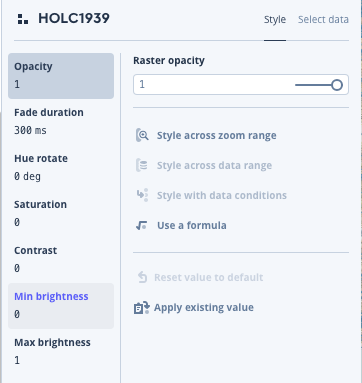
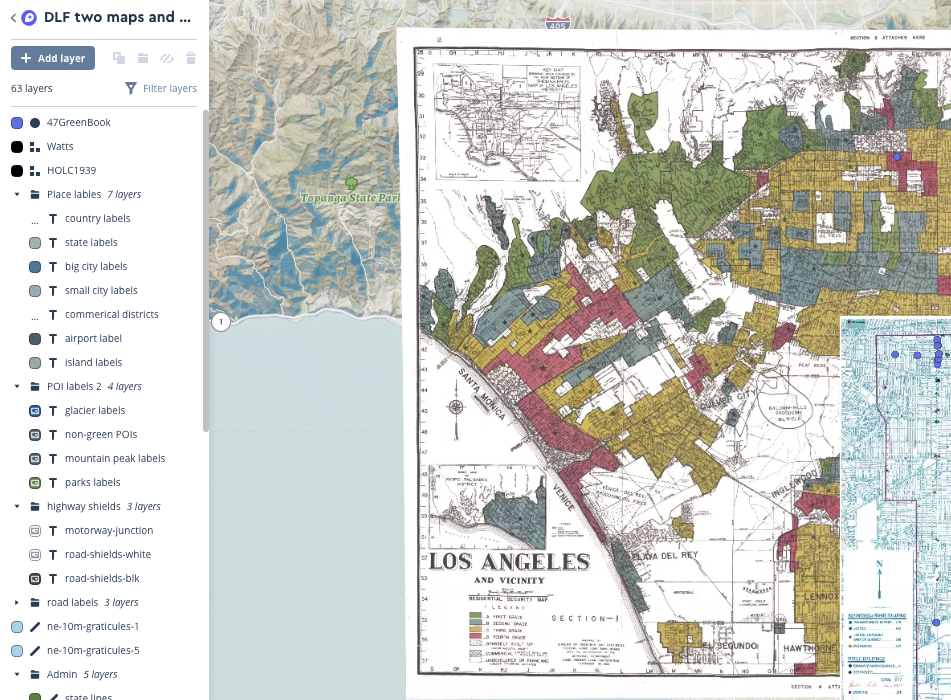
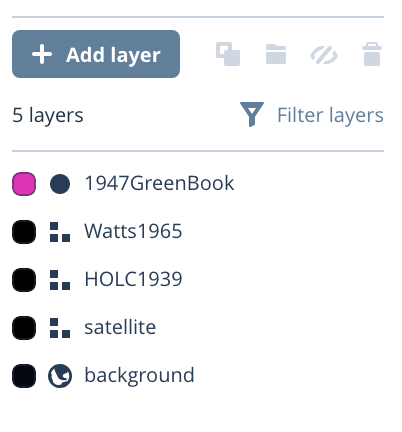
Here is your style in edit mode. We will only focus on adding a layer, which will be the tileset you just created.
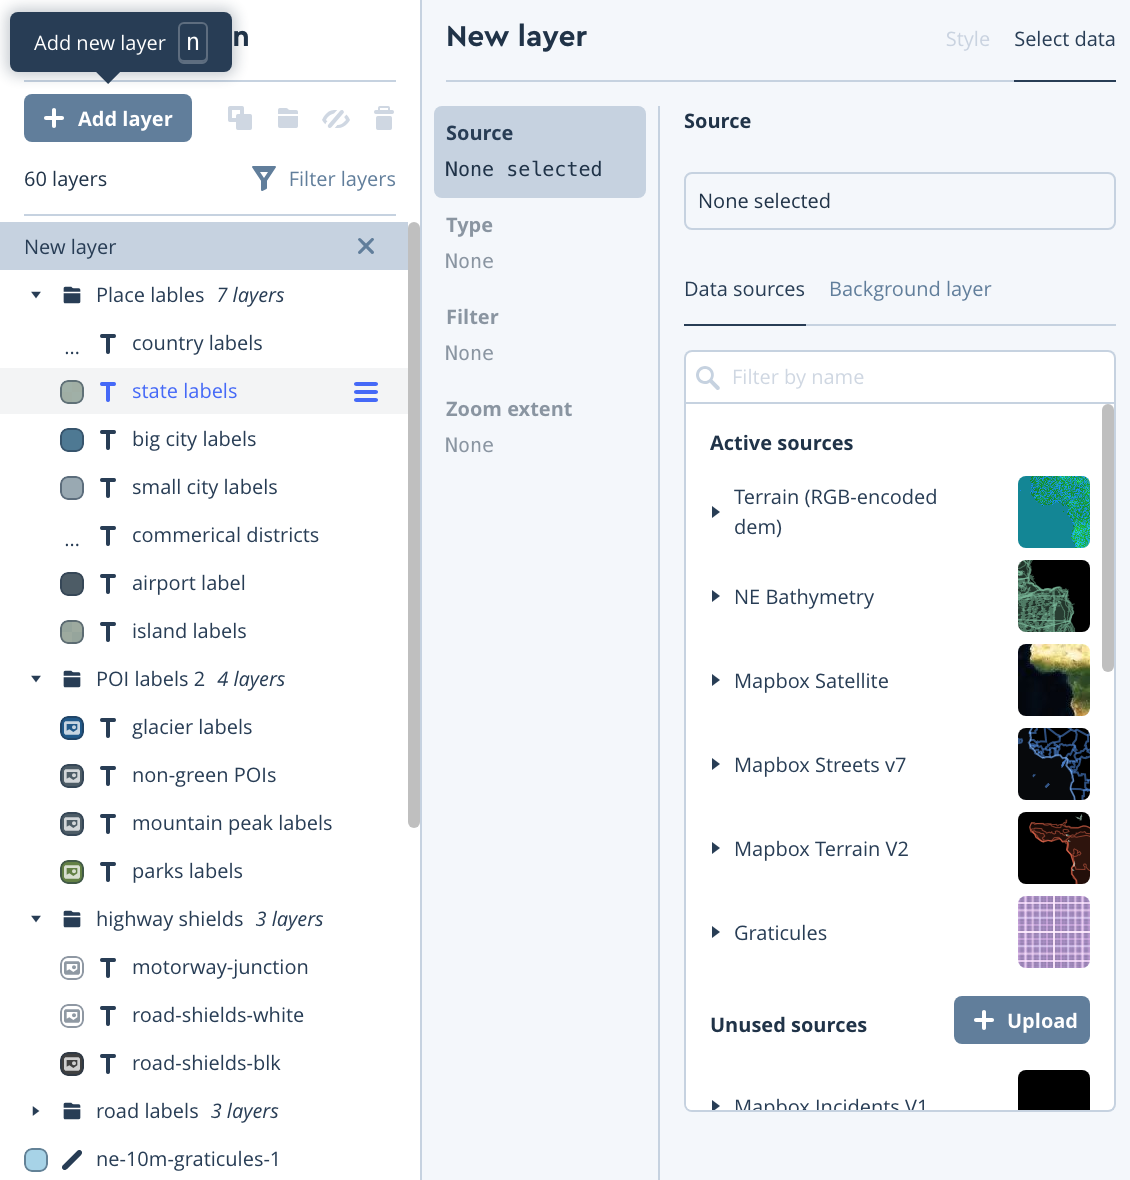
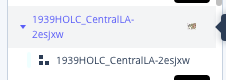
Once you click on "Add Layer" you can scroll through the data sources and find the name of your tileset. Click on it to reveal the layer underneath with 3 boxes. You click on that layer to add to the map.
Once you click on it it should be added to your style.

Rename the file. Keep it simple and descriptive. To get out of edit mode just click on the layer from the layer list on the left hand side. This will also display it if it isn't on your map yet.
rename here
click here to display and get out of the edit mode
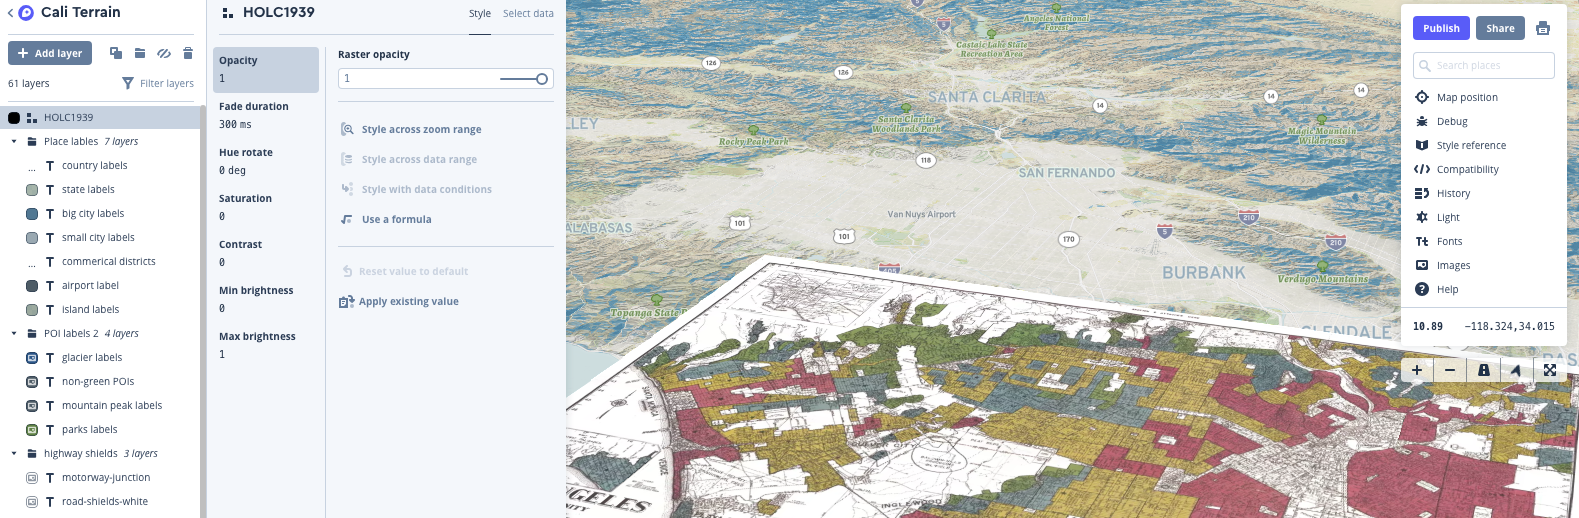
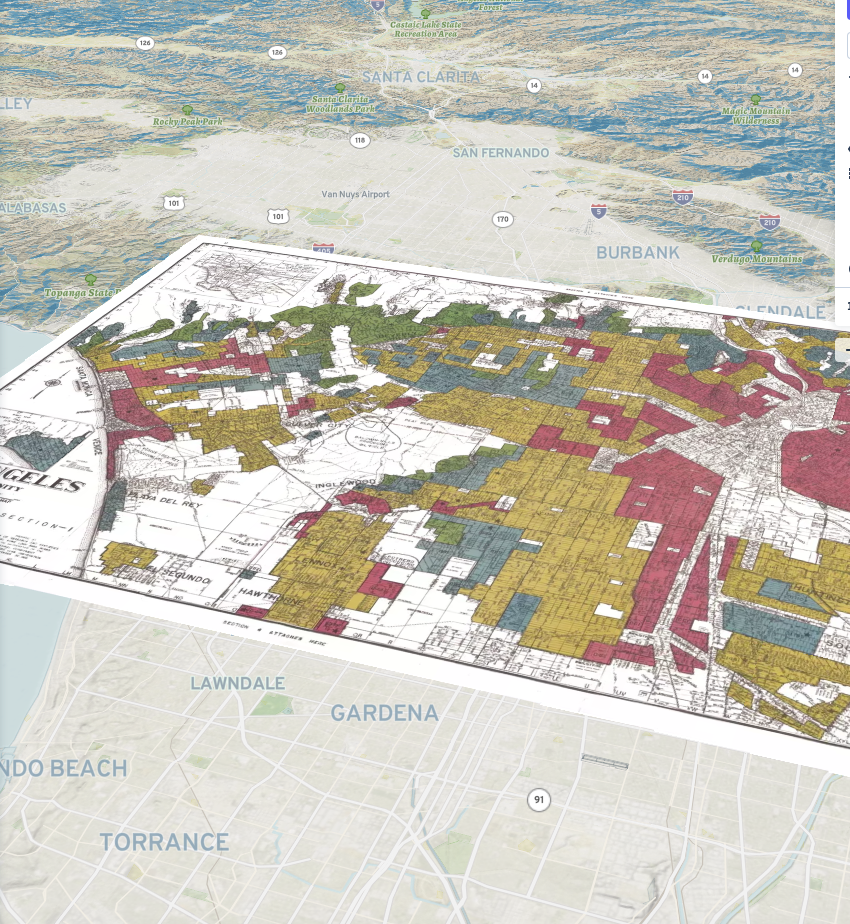
Once it all looks good. You can publish the map from the upper right hand corner.

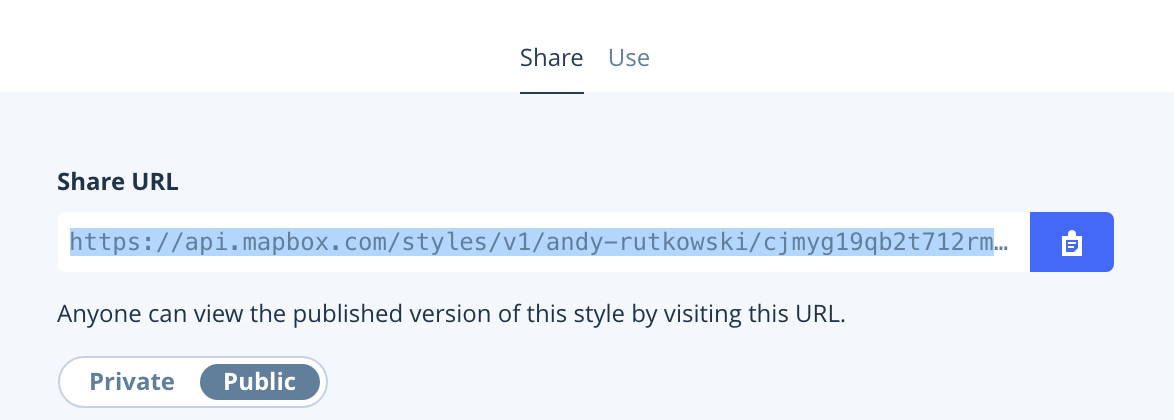
In fact you can use that "Share URL" and take a look at the map you created.
Now lets use that map in CARTO
Navigate right again.
Back in CARTO click on the basemap layer towards the bottom. We will bring in our custom style that we created in Mapbox.
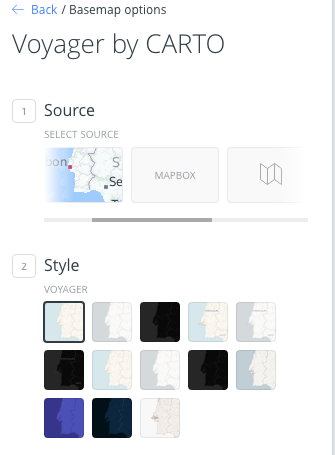
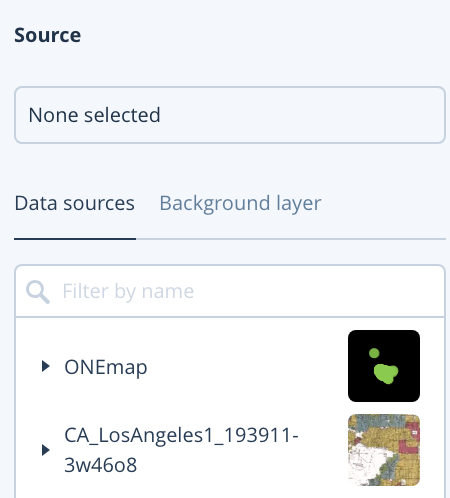
From the "Sources" scroll over and click on "MAPBOX."
Then click on the box with the add symbol under "Style."
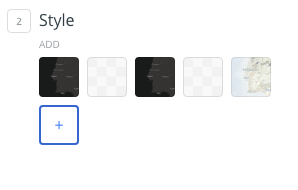
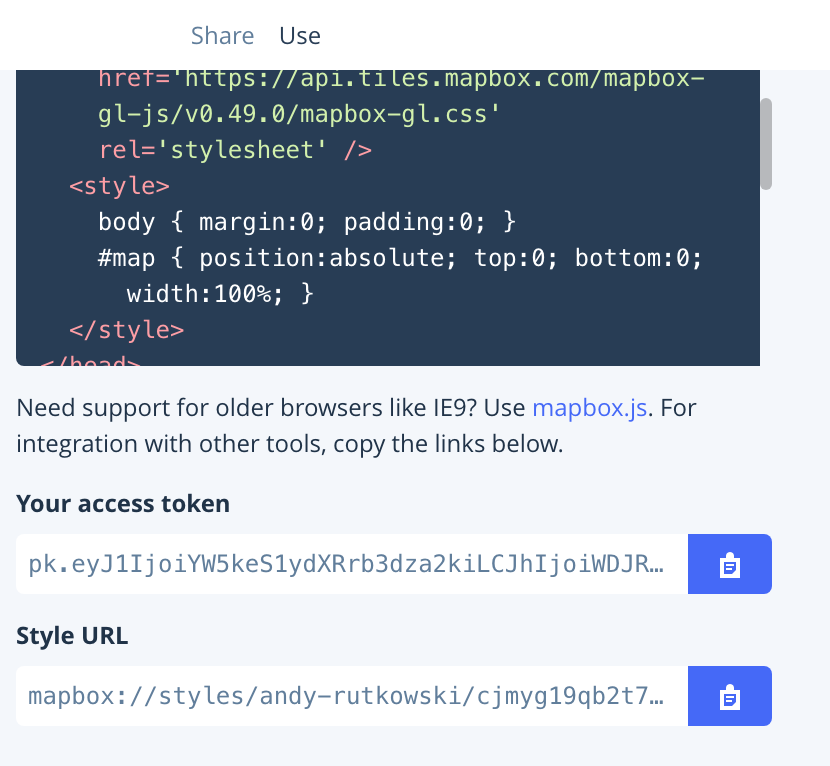
you should see this screen.
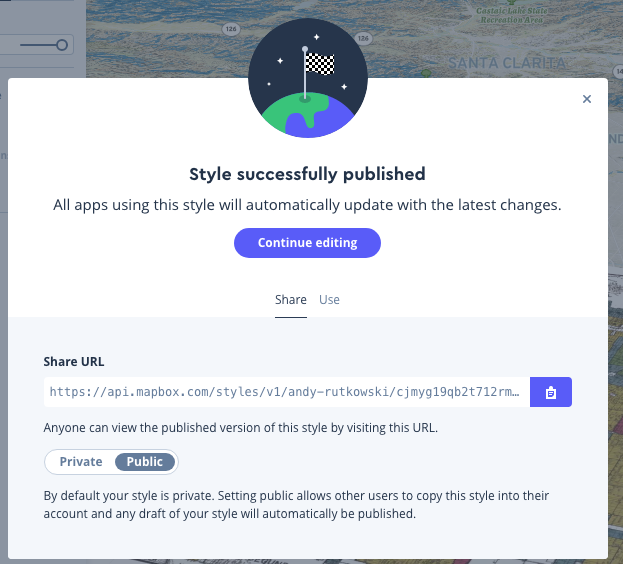
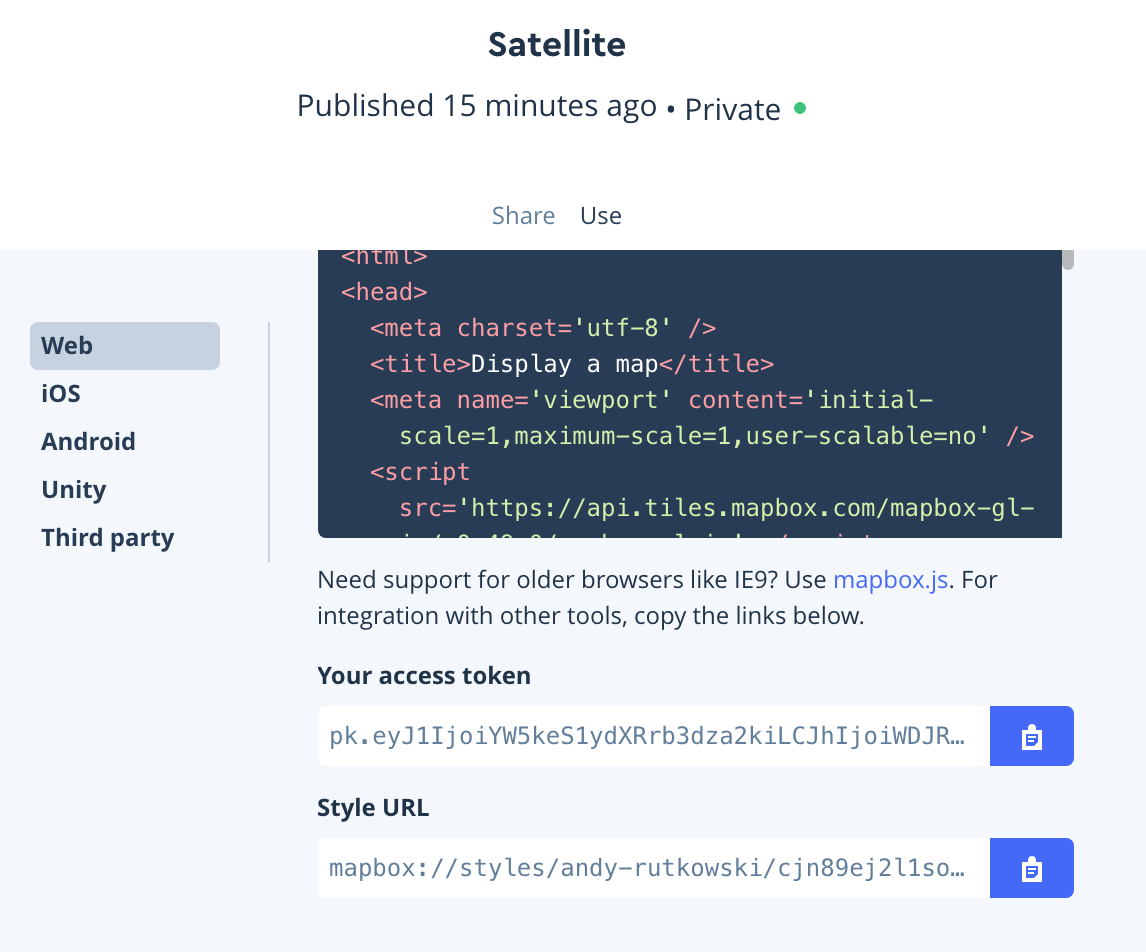
go back to your mapbox account...
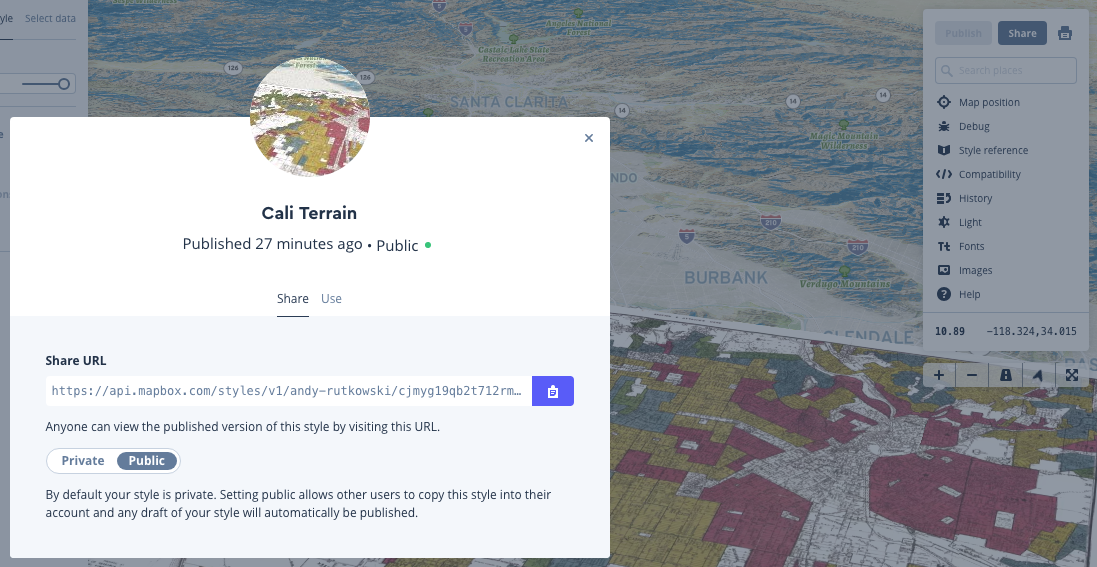
click "Share" in the top right
then click "Use"
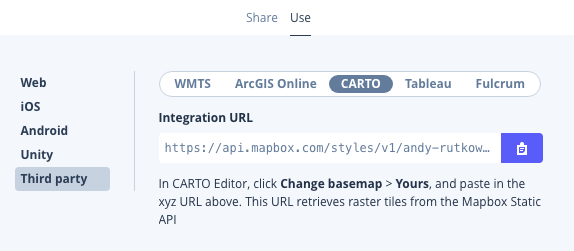
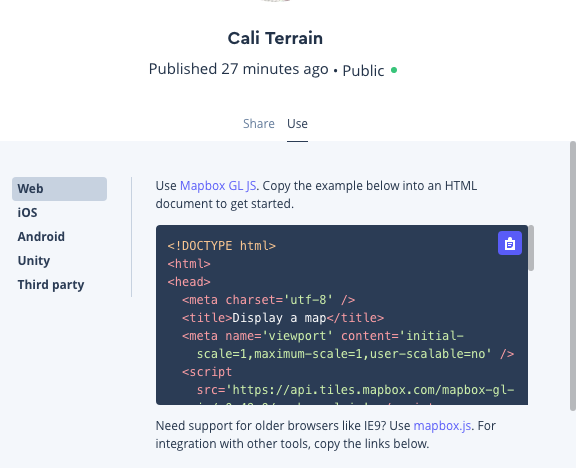
Once you click "Use" you can then select "Third party" and then "CARTO." Copy that integration URL.
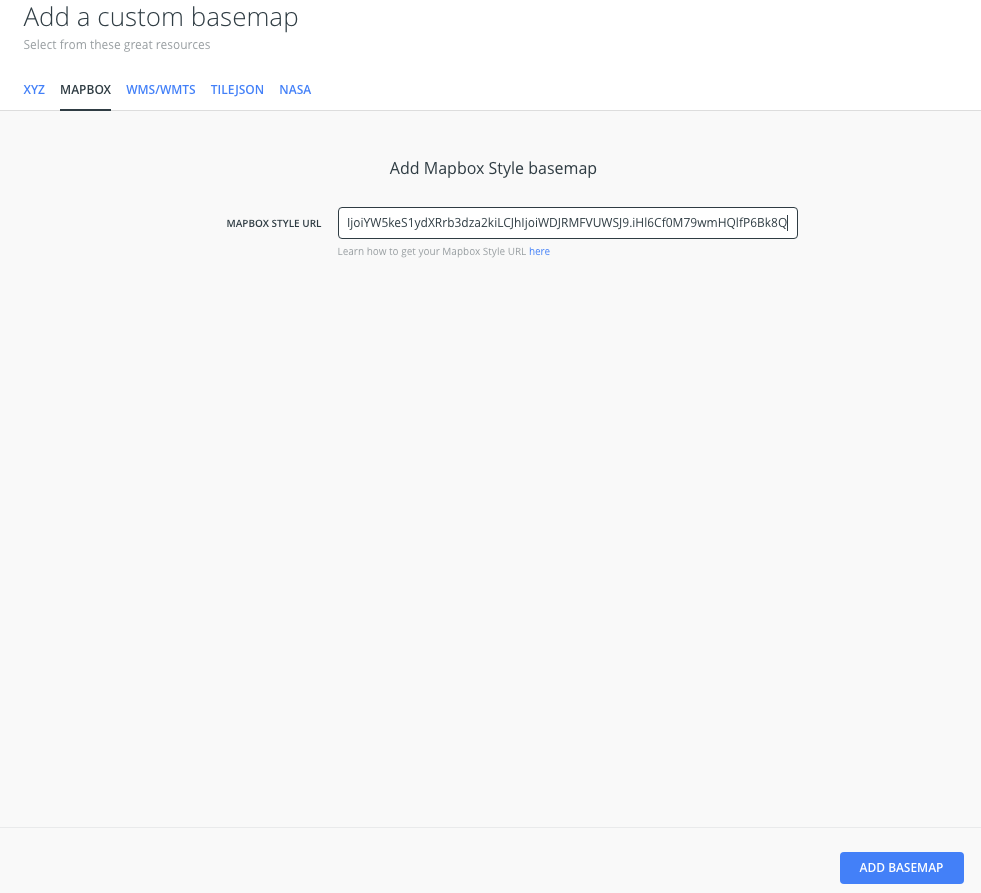
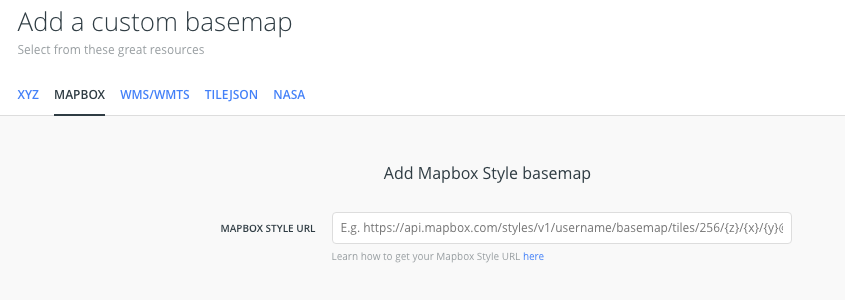
Back in CARTO paste that URL in the "MAPBOX STYLE URL" box and then click "ADD BASEMAP"
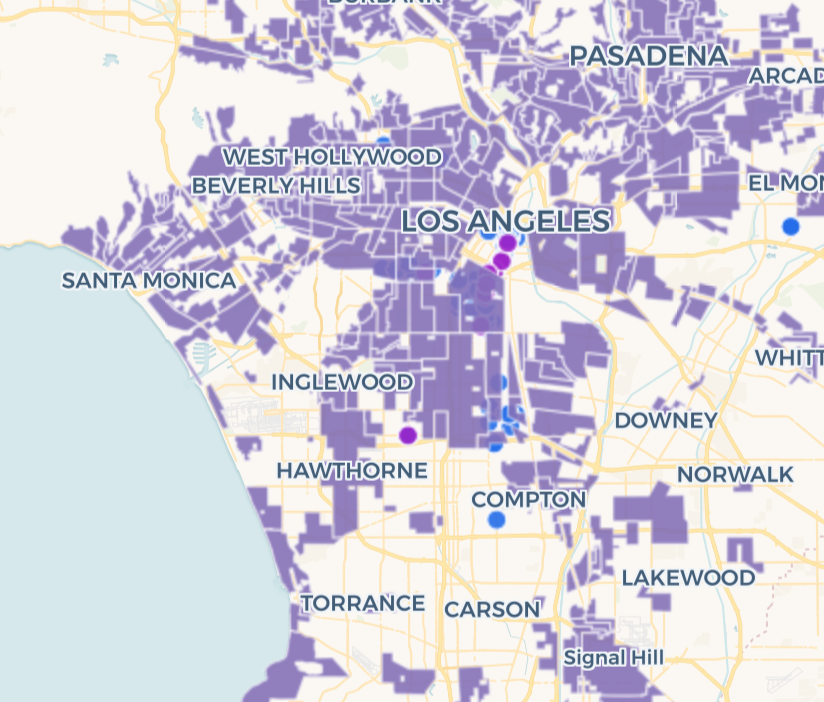
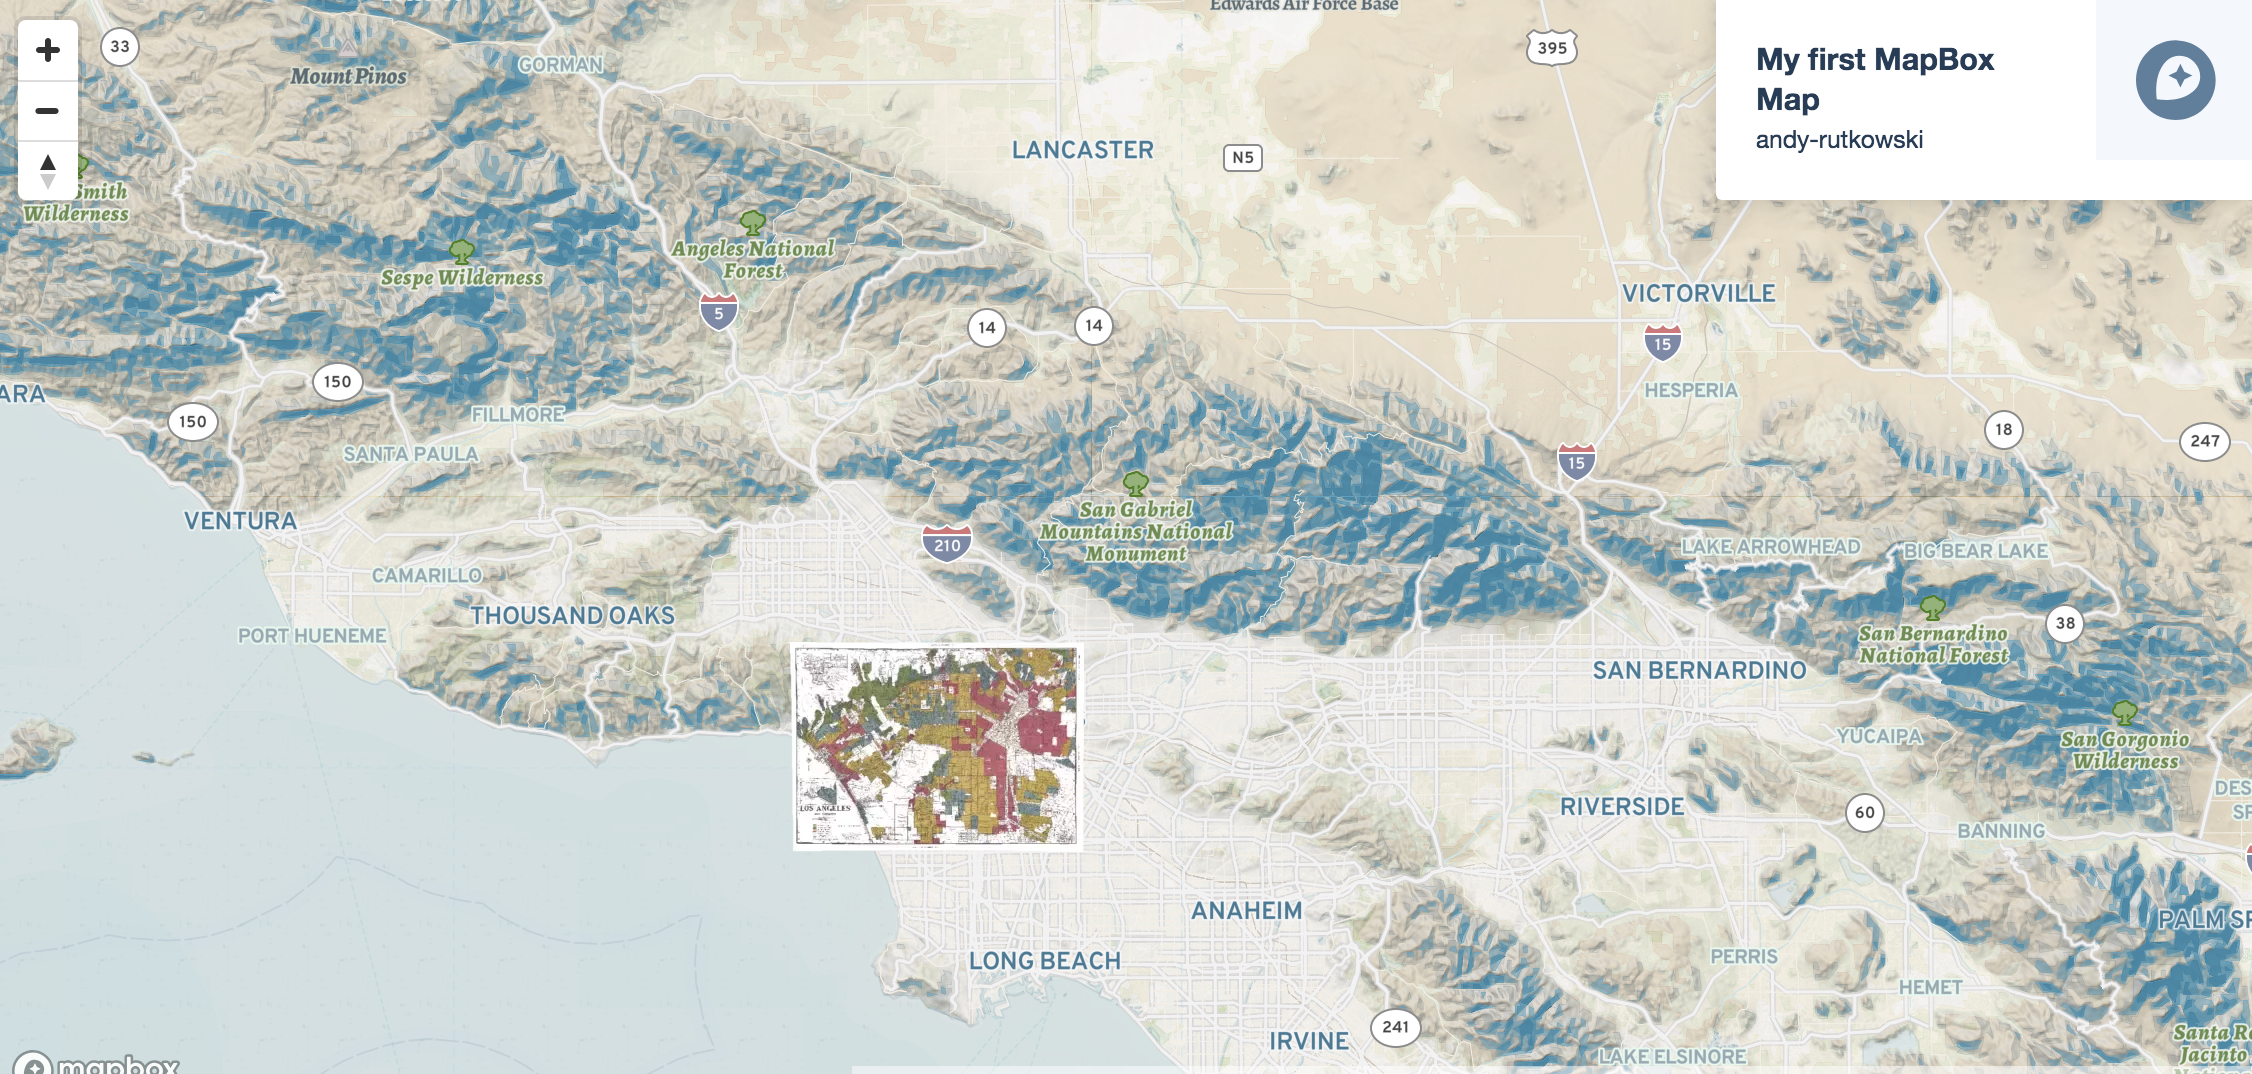
You should now have a historical basemap layer in your CARTO project.
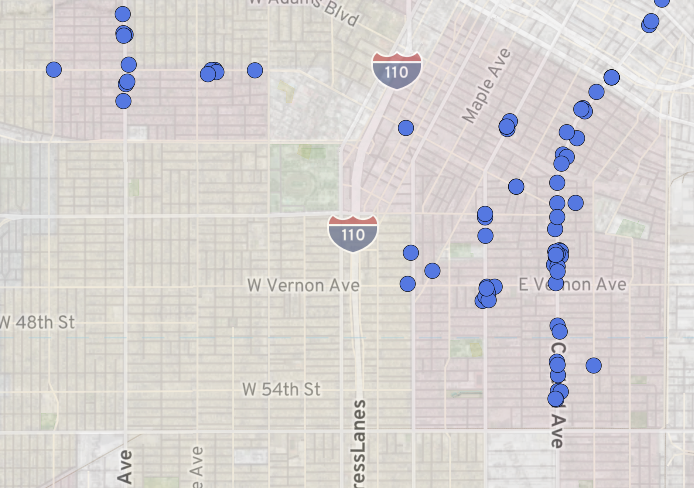
CARTO project with a custom Mapbox style as the baselayer.
One challenge with using CARTO and Mapbox together is that we do not have control over the historical layer. You either see it or you don't.
Github and coding
Lets learn how to work with the data more directly.
In the process we will also think about how to use Github for project and data mangement.
With some fairly simple coding you can take more control over how to display your data
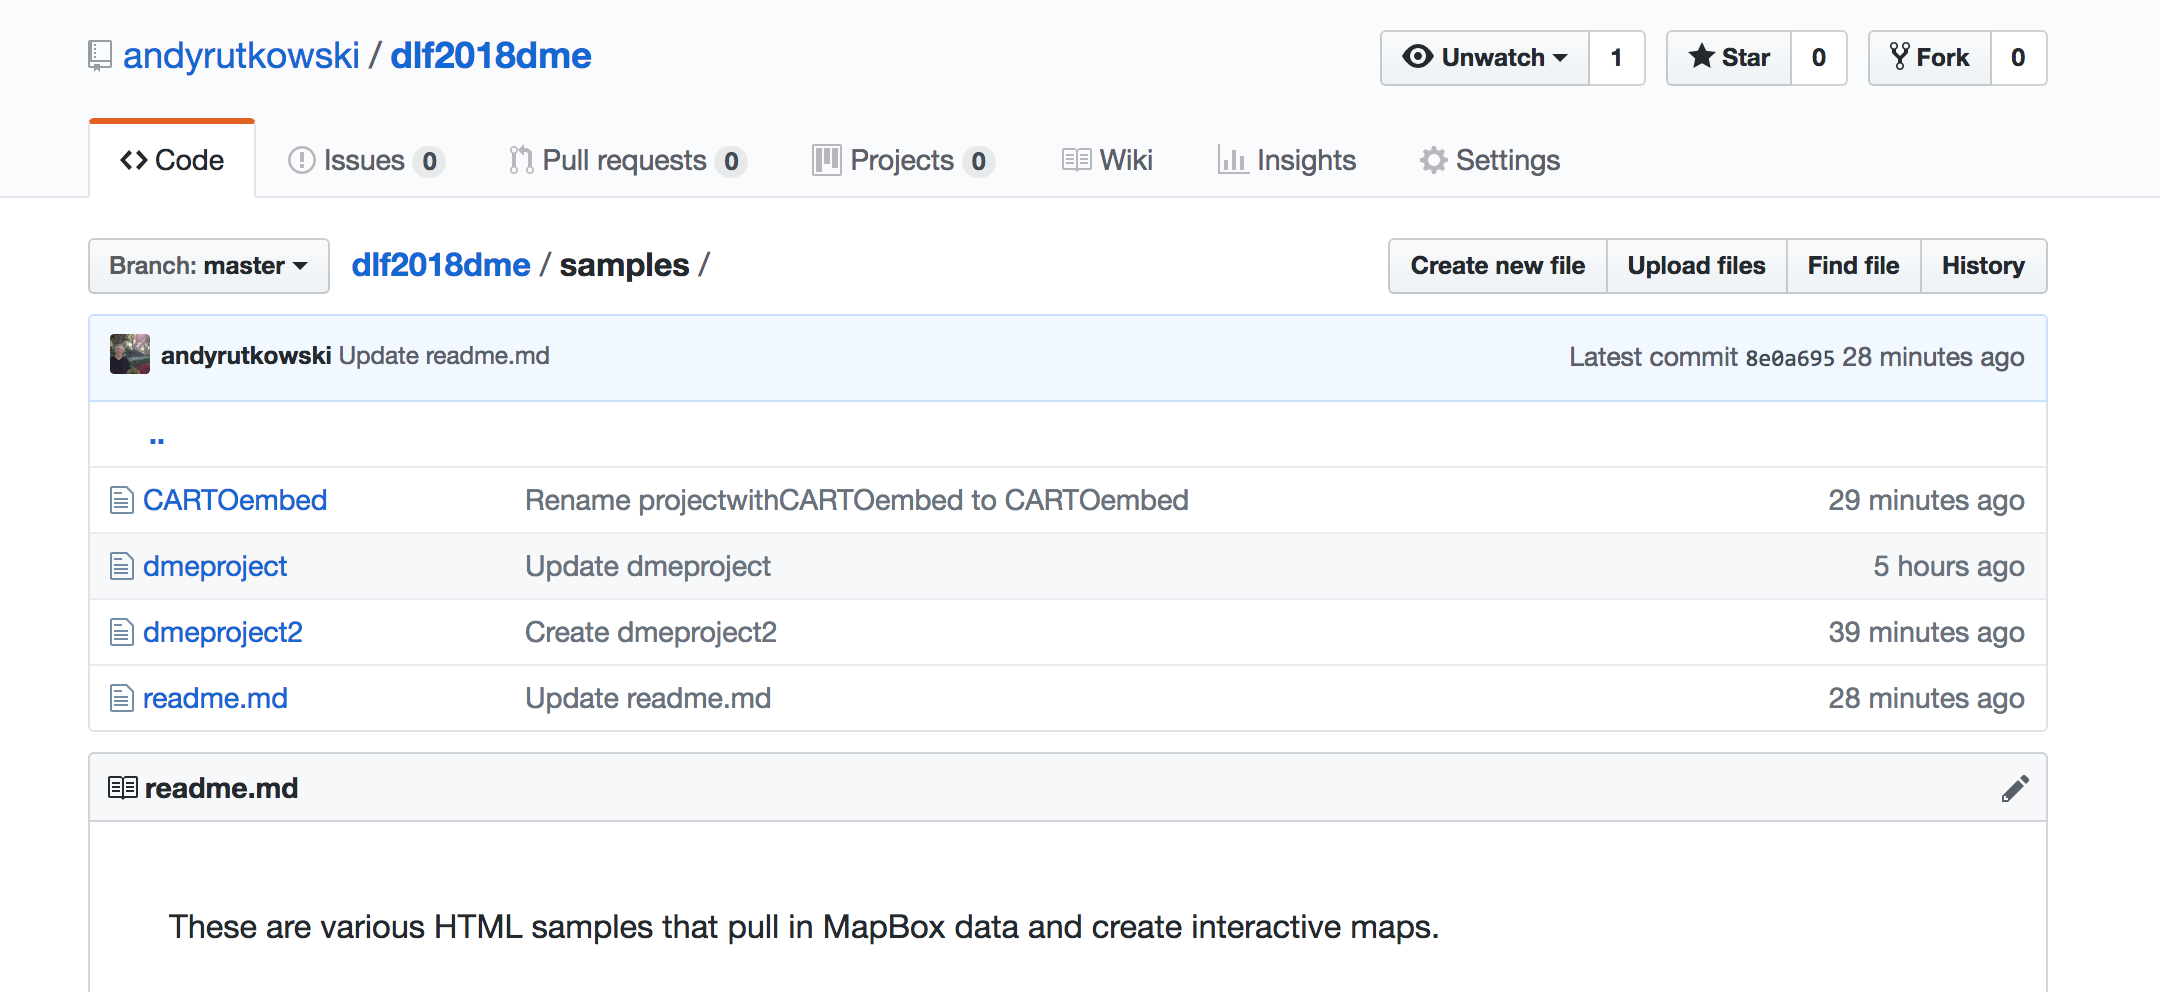
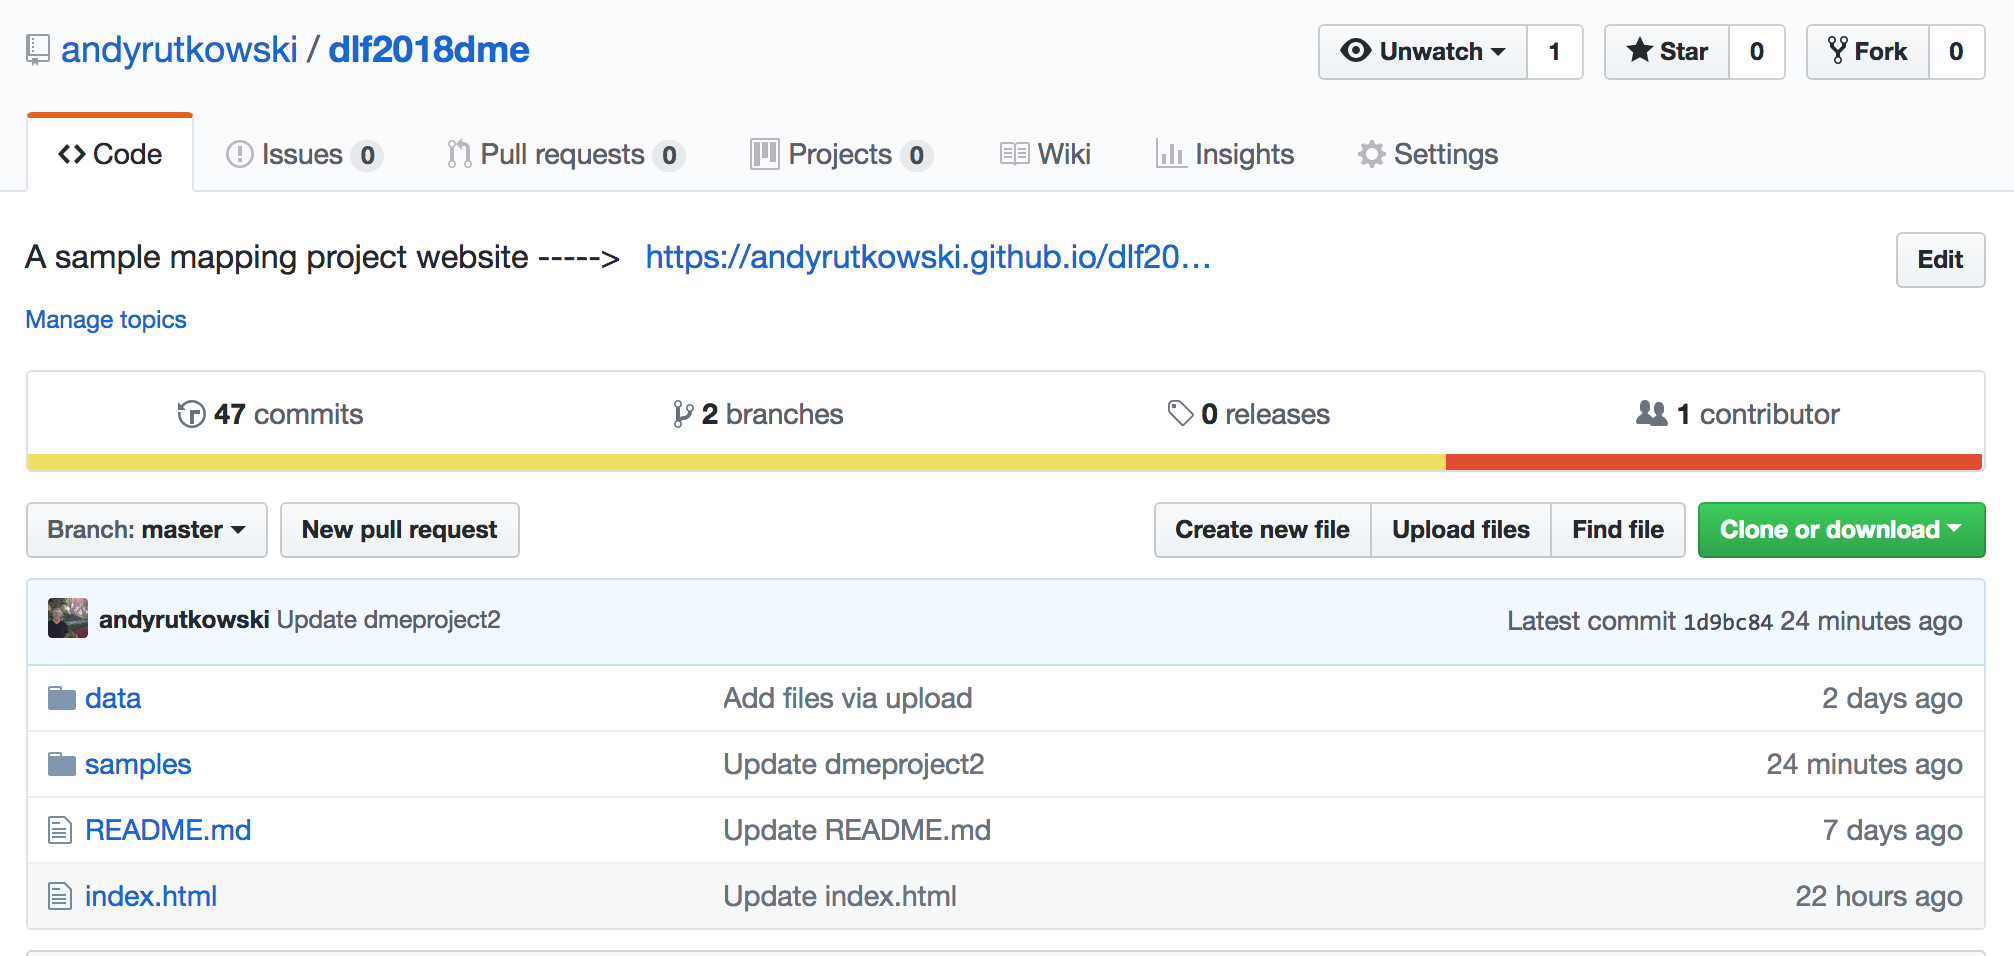
This repo has examples of some HTML coding that lets you display data from MapBox.

The repo also shows how you can use a repository to host and share a digital project.
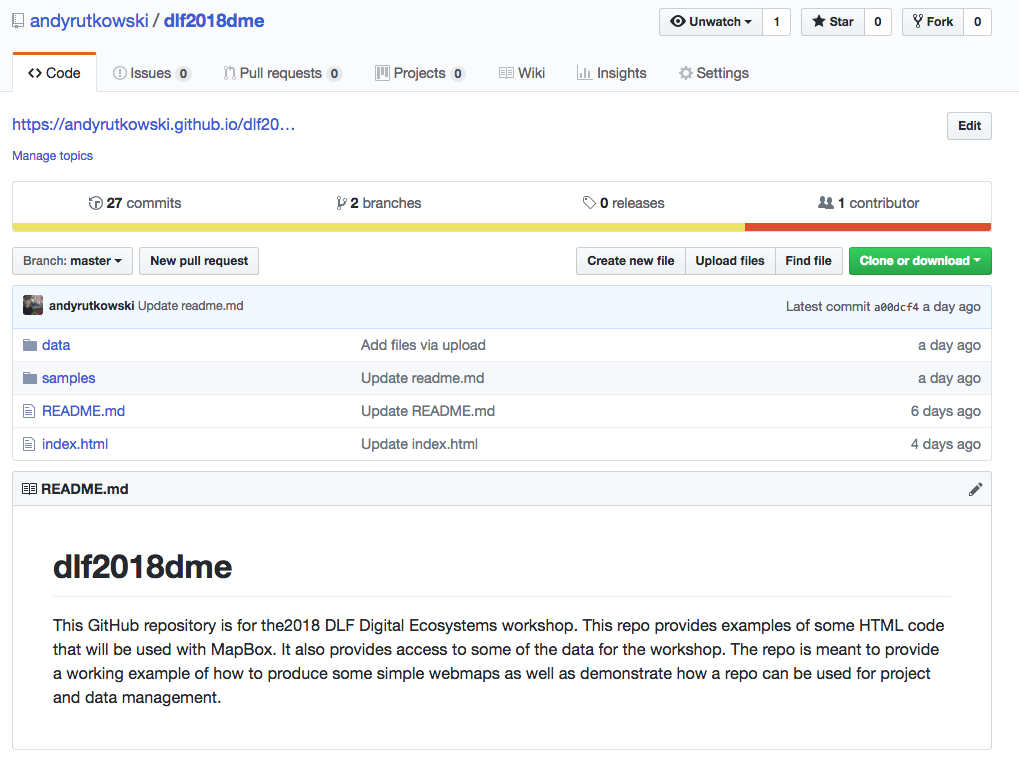
data can be stored and described in a repo.
a project can documented and described.
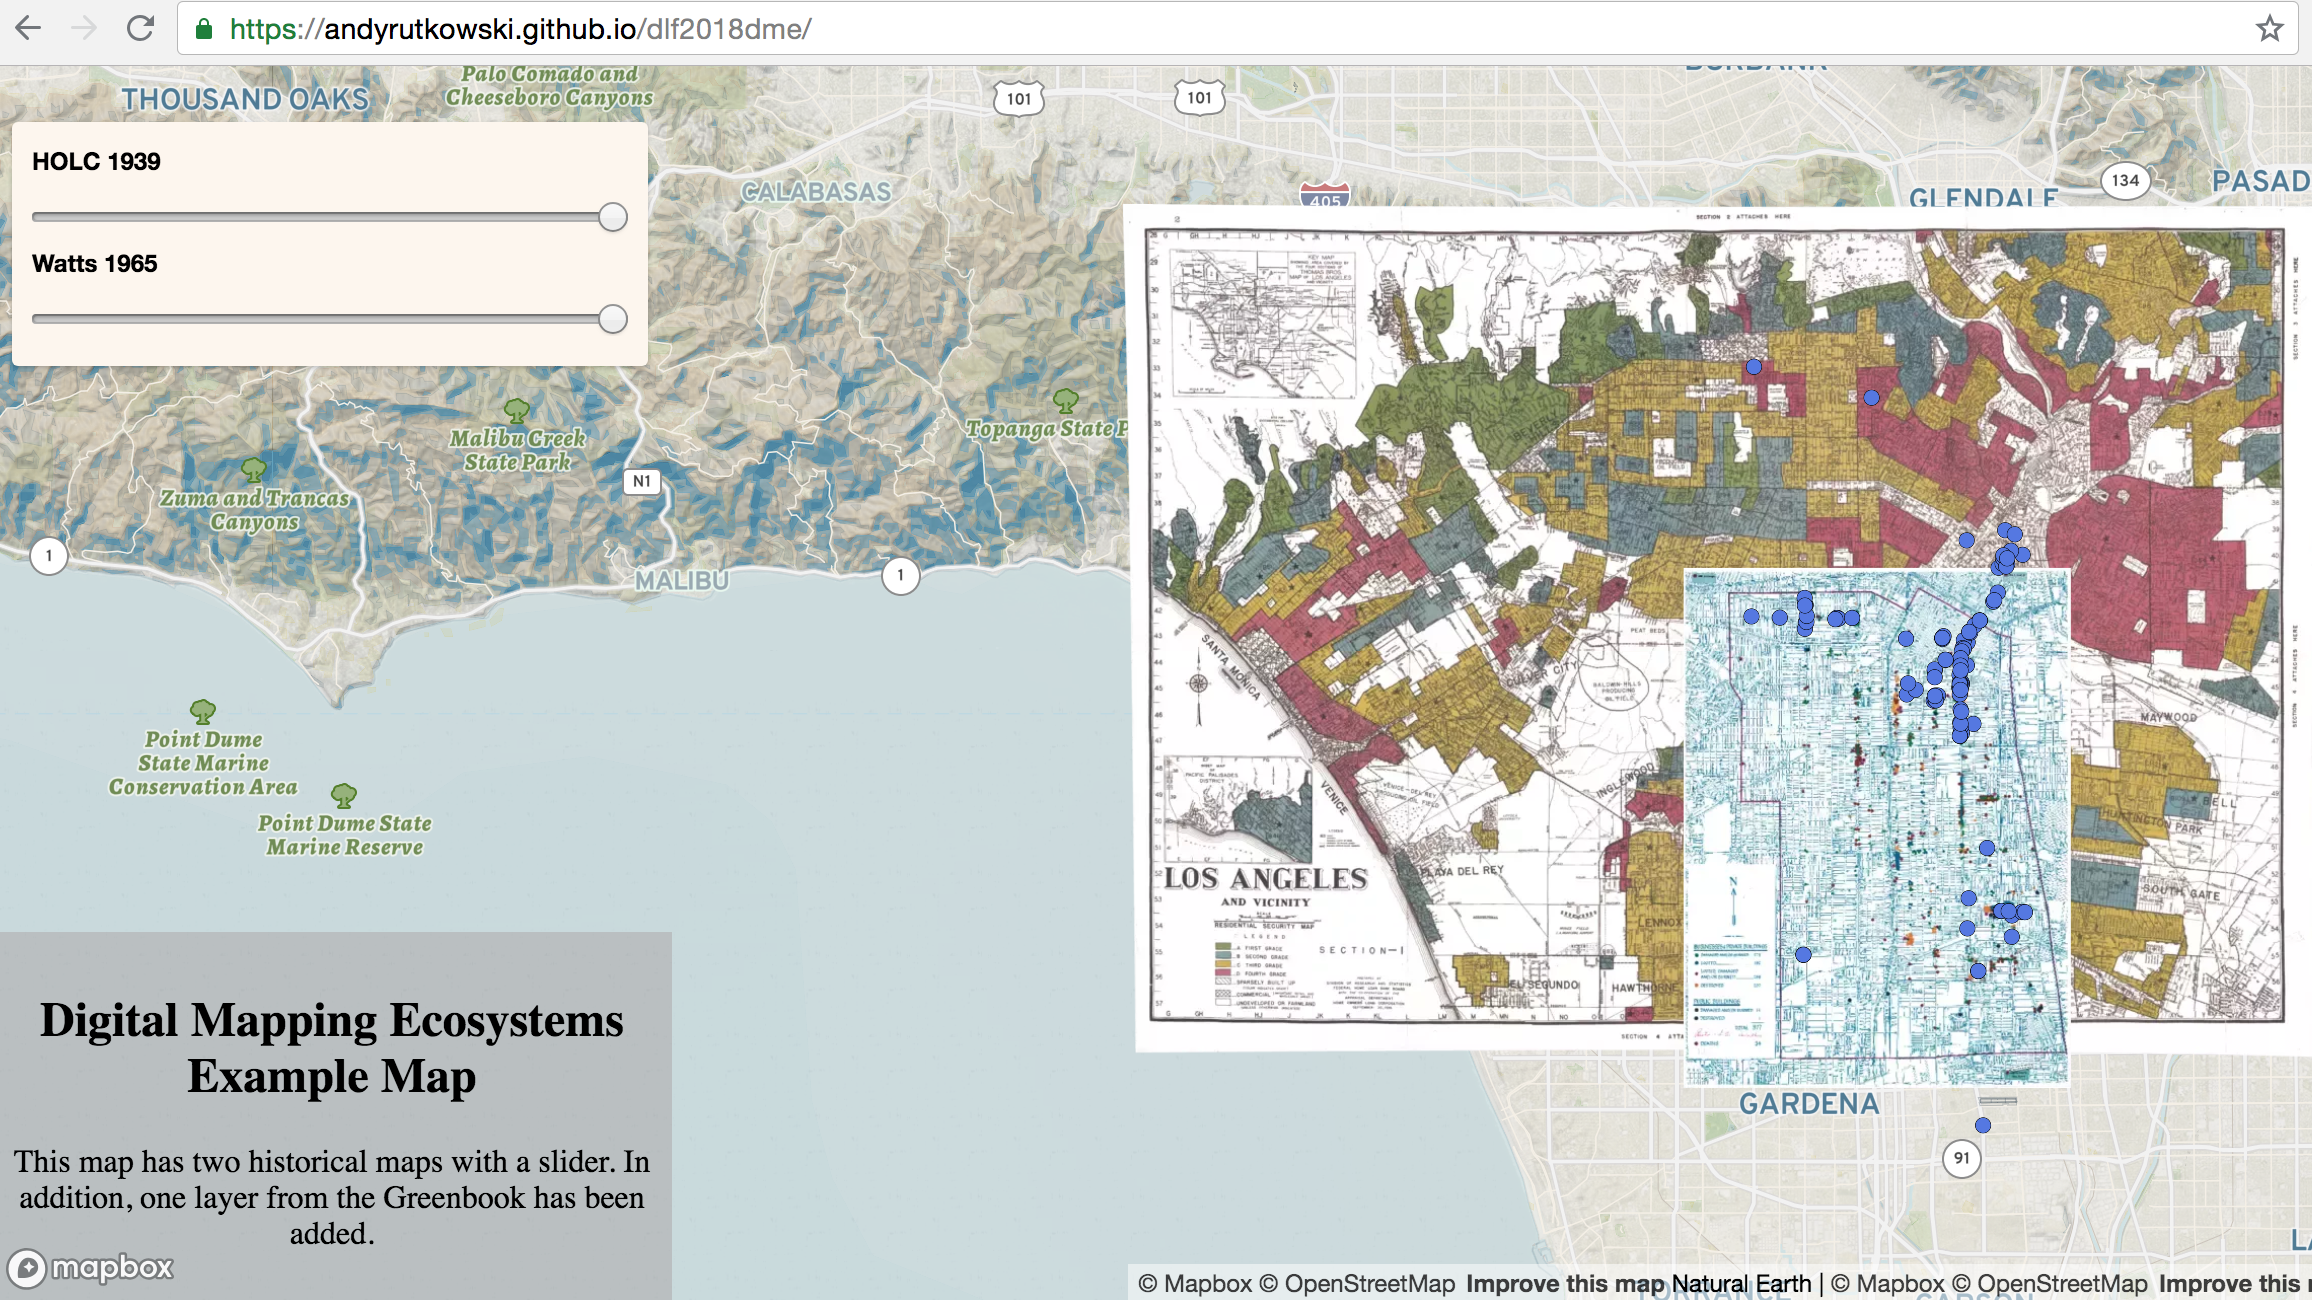
you can publish a website of your project
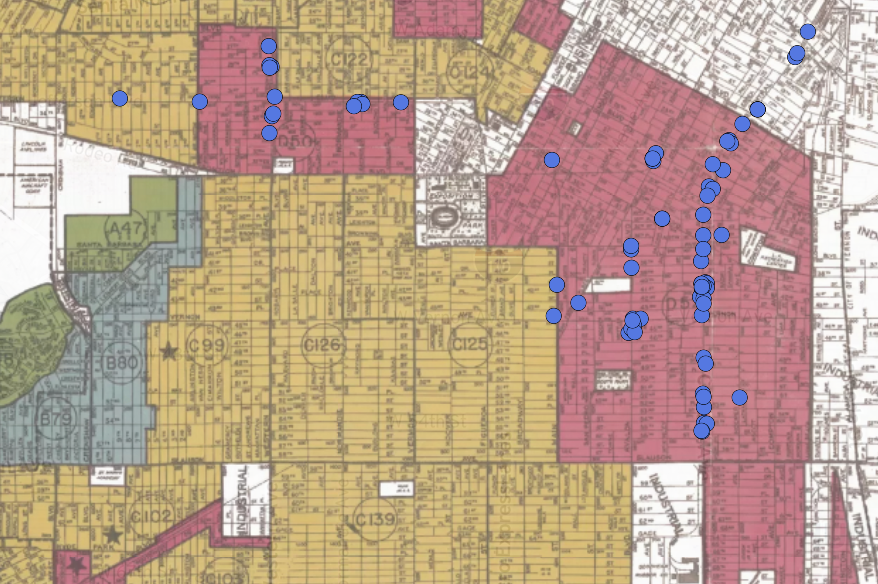
Lets see if we can make this map
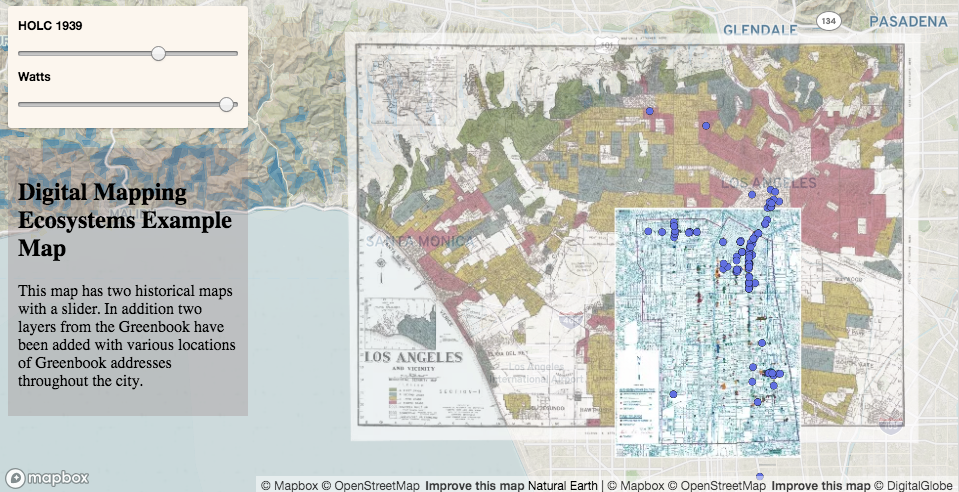
All the data is in MapBox. We will write (really copy and adapt) code that will let us create a transparency slider.
Lets go back to Mapbox
Repeat the same process that you did for the HOLC map this time uploading the Wattsmap as a tileset
Go to the Styles and click on the one you created earlier and add the Wattsmap layer
Another quick break as map uploads
Now lets add a CSV file as a tileset - you can pick 1939 or 1947
Once it is uploaded as a tileset add it to that same style.
You should now have your data layers renamed and ready to be used.
To create the map you need just a few pieces of information from Mapbox.
Map IDs
Style URLs
Access token
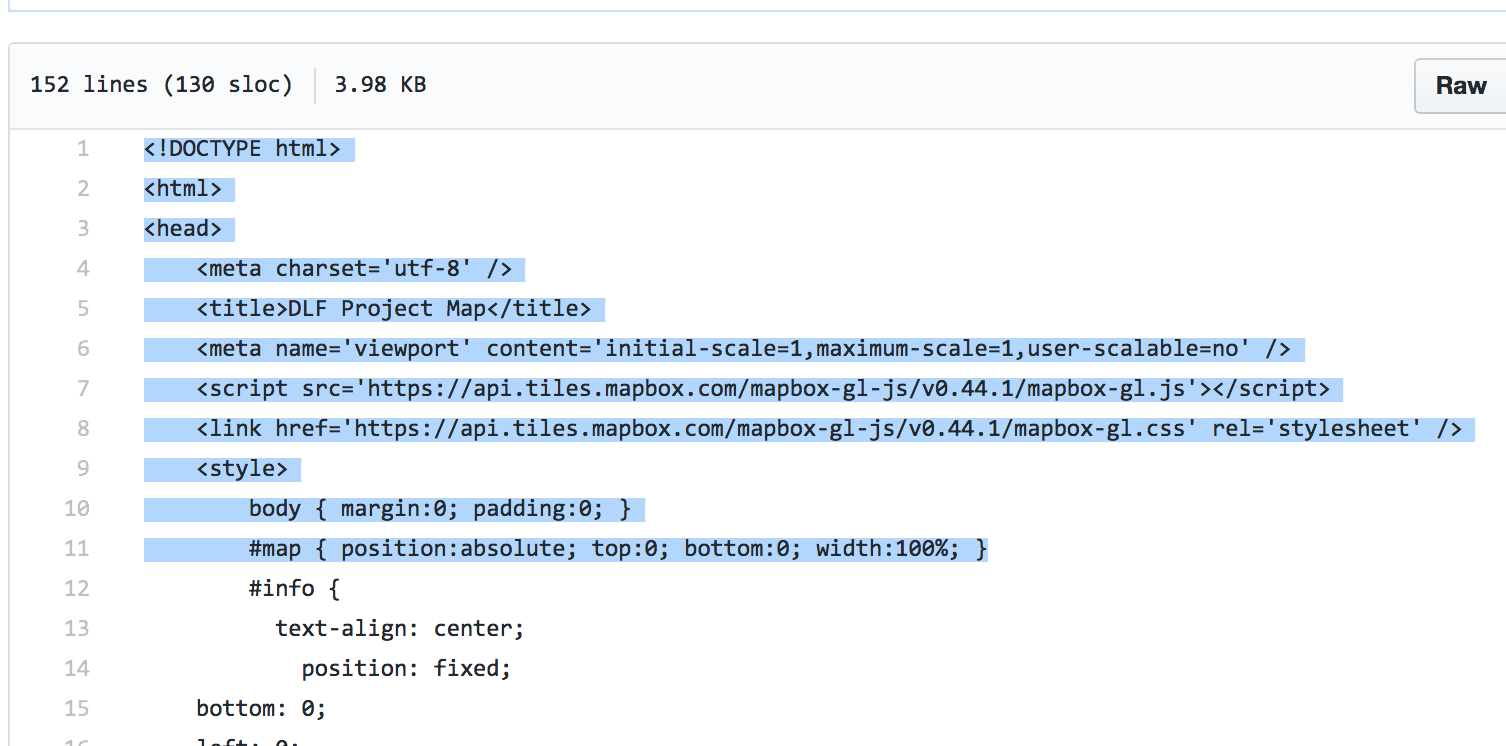
You will use the sample HTML code and replace my Mapbox IDs, Styles, etc. with yours.
The HTML file will let you know where you need to make the changes.
Go to the folder with the sample HTML files and click on "dmeproject2."
Bl.ock Builder is fairly easy (not perfect) way to work on code, preview it, save it, and find other examples.
Cut and paste the code from GitHub into bl.ock builder
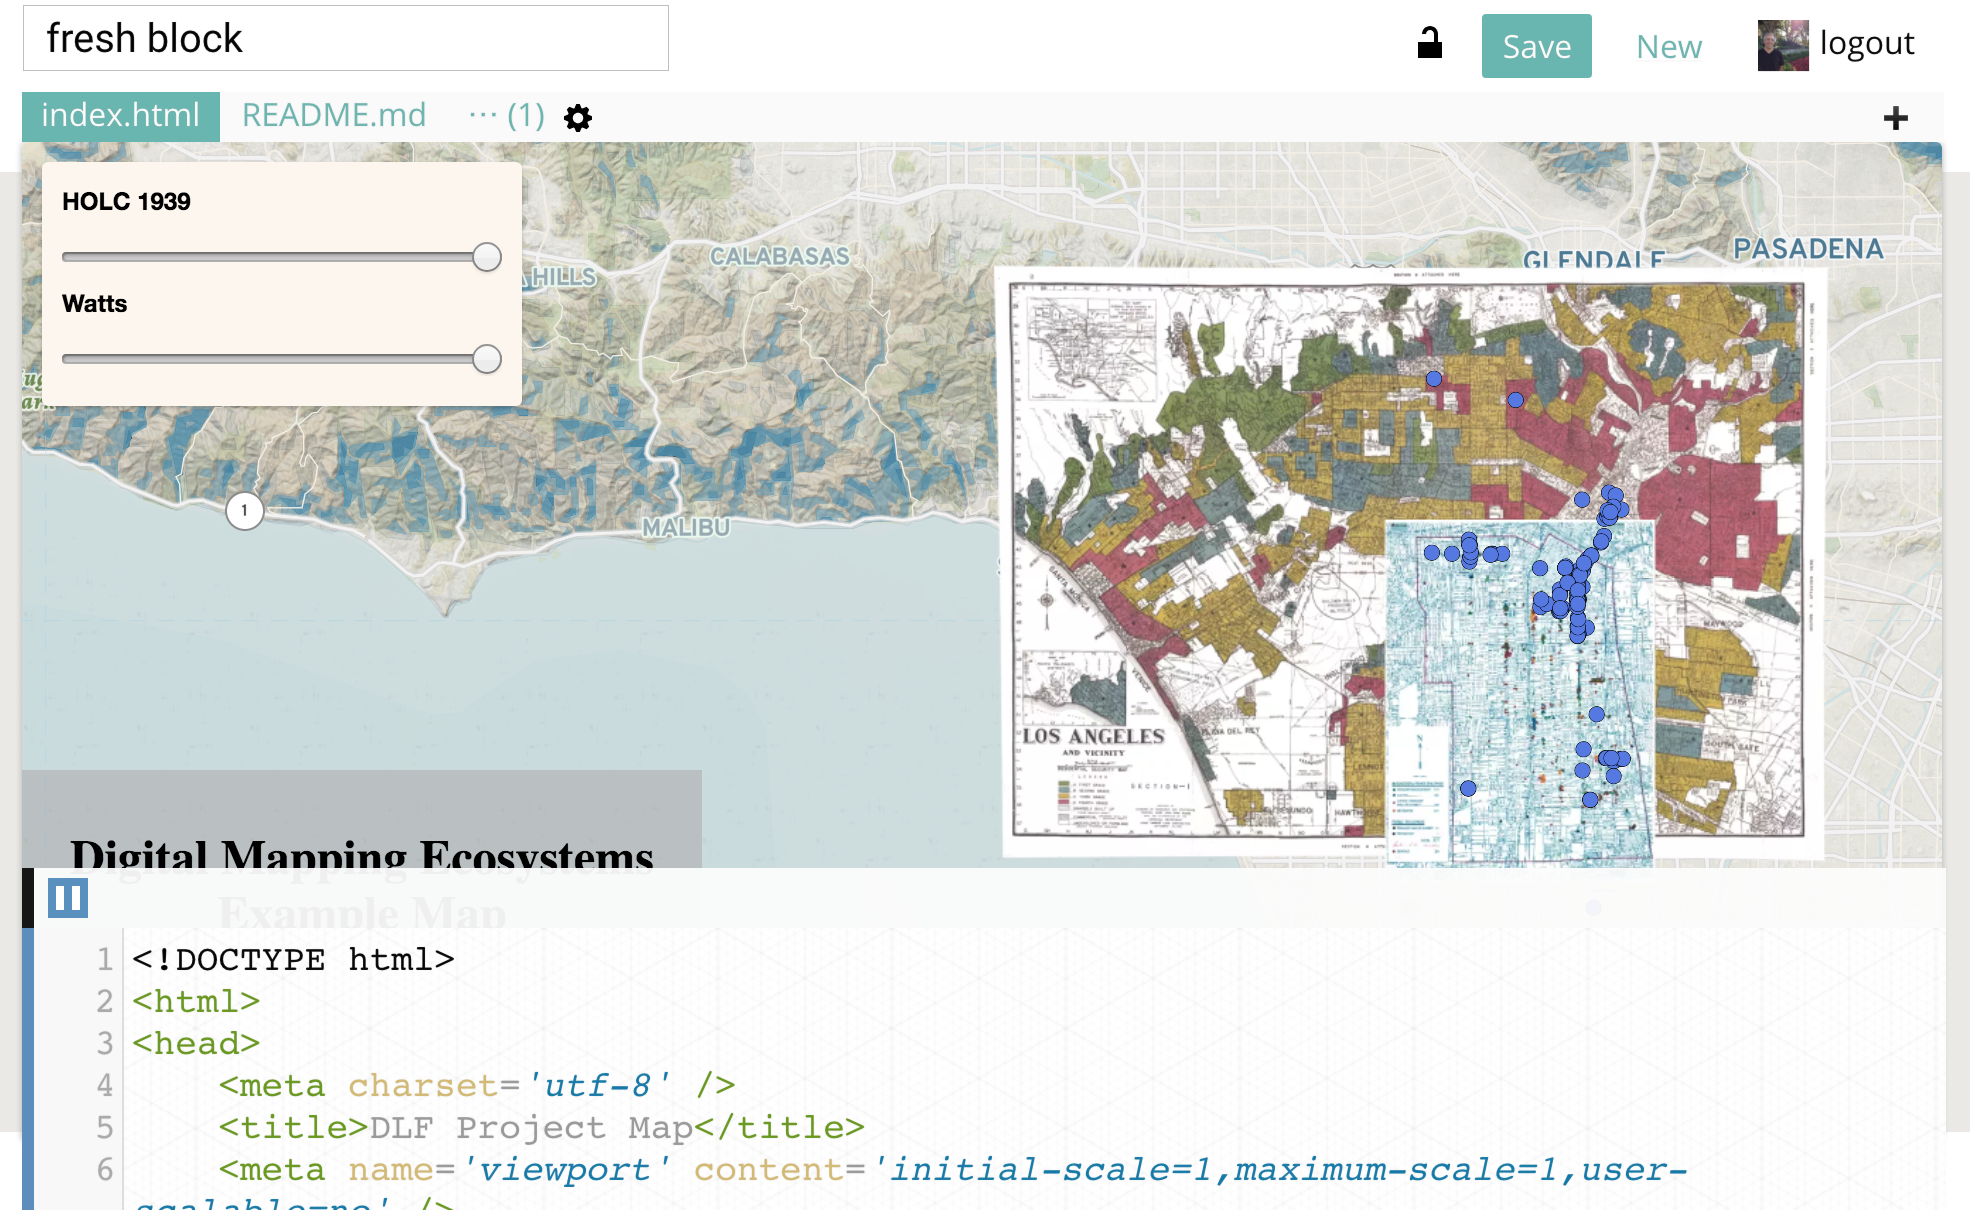
Once you have it pasted in you should have a functioning map in the preview window.
Lets go line by line and make changes
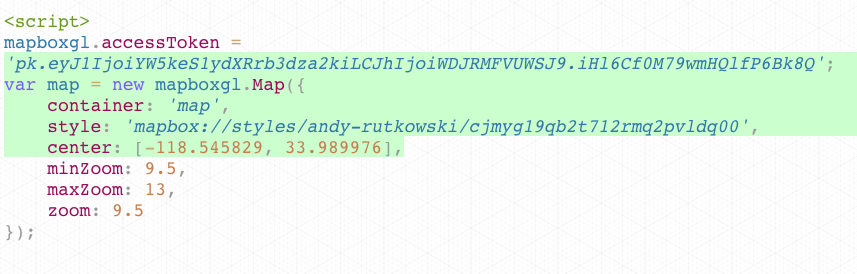
Line 71 -
This is your access token. Mapbox has a default token that you can use. You can create custom ones for projects as well. You should be able to keep this token but in future you might need to update this if you create a unique one.

Line 74 -
This is your Mapbox style. Remember when you clicked "Use" on your style? In that window is your Style URL Replace it now!

Once you do that, scroll back up and take a look at your map. You should have a different base layer.
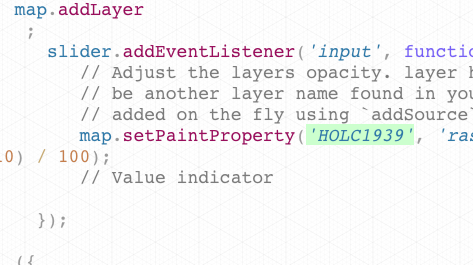
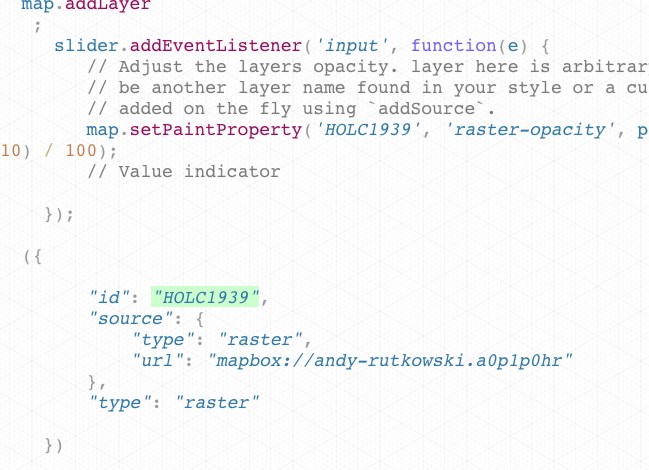
Line 95 -
This is the first historical layer. I named mine HOLC1939. Replace it with whatever you named your HOLC map.
Line 98-
Replace the HOLC map name again.


Line 101-
Replace the url for your HOLC map. For this you go back to your tileset.
Line 113 -
Line 119-


Now do the same thing for the Watts map
Line 122-
Line 129 - Now you are changing the GreenBook layer. Again, just replace this with the name that you gave it in the style.

Thats it!
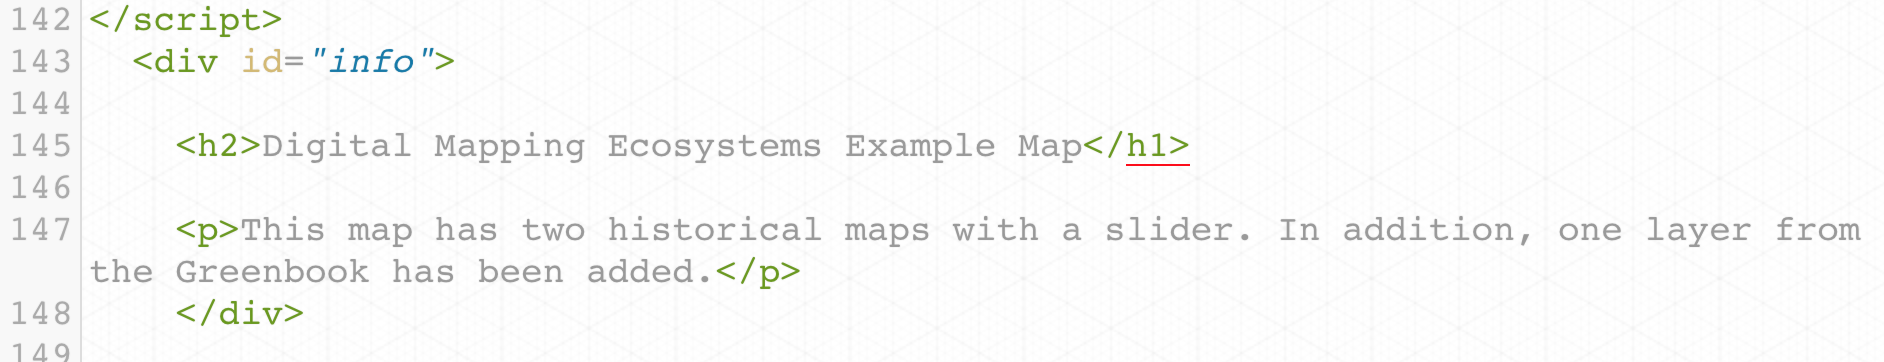
You can change the code in lines 145 - 148 if you want to rename and describe the project.
Wait, one more change!
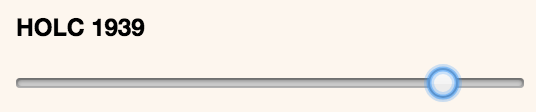
Lines 61 - 64 provide the name of the maps in the slider. Change those accordingly.

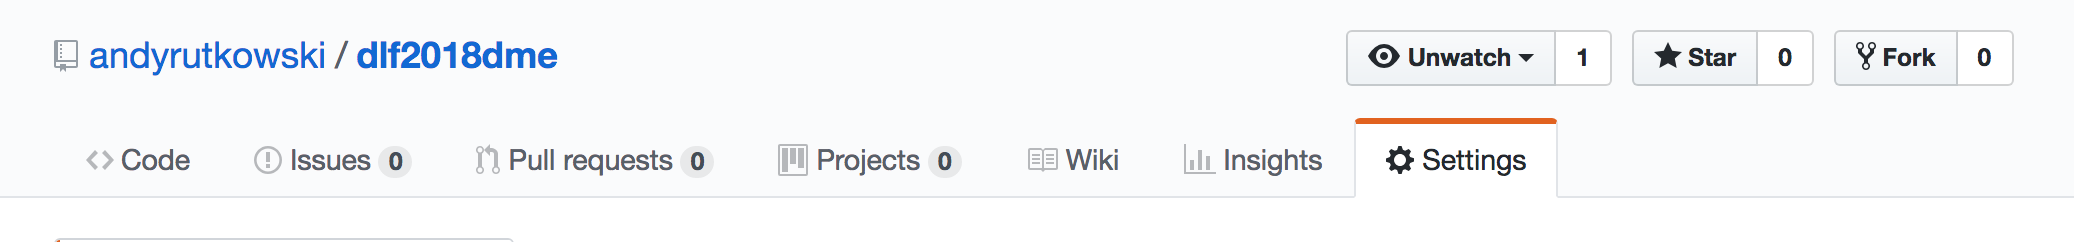
Now go back to the dlf2018dme repo
Fork it. You will be asked to sign in if you are not already.
Then click on the index.html file
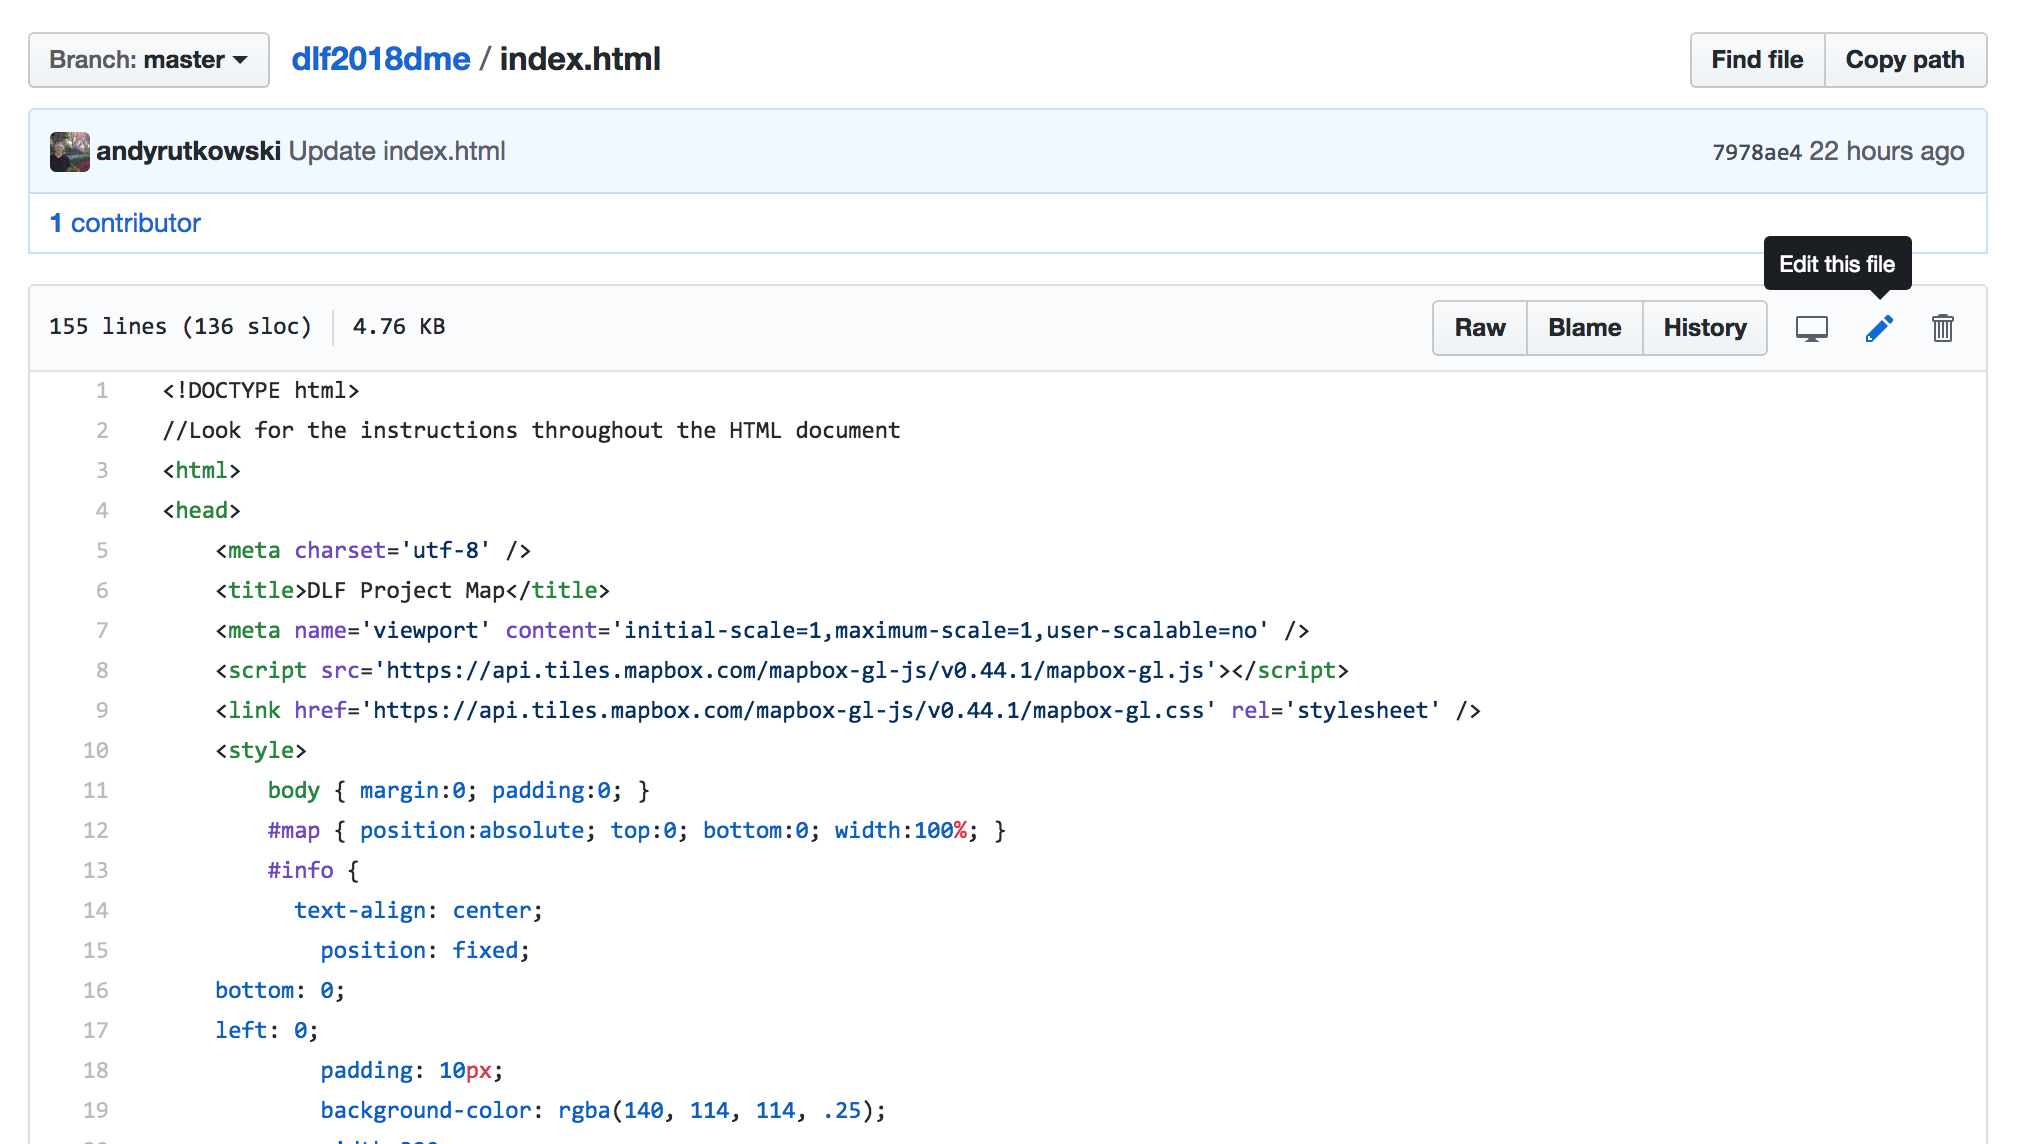
Edit the file and cut and paste your code in.
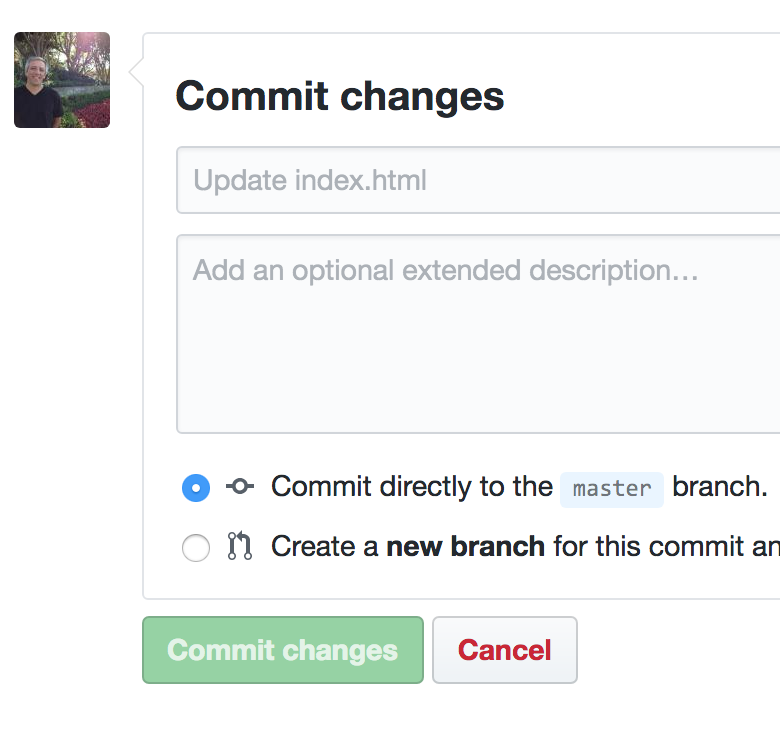
Commit your changes
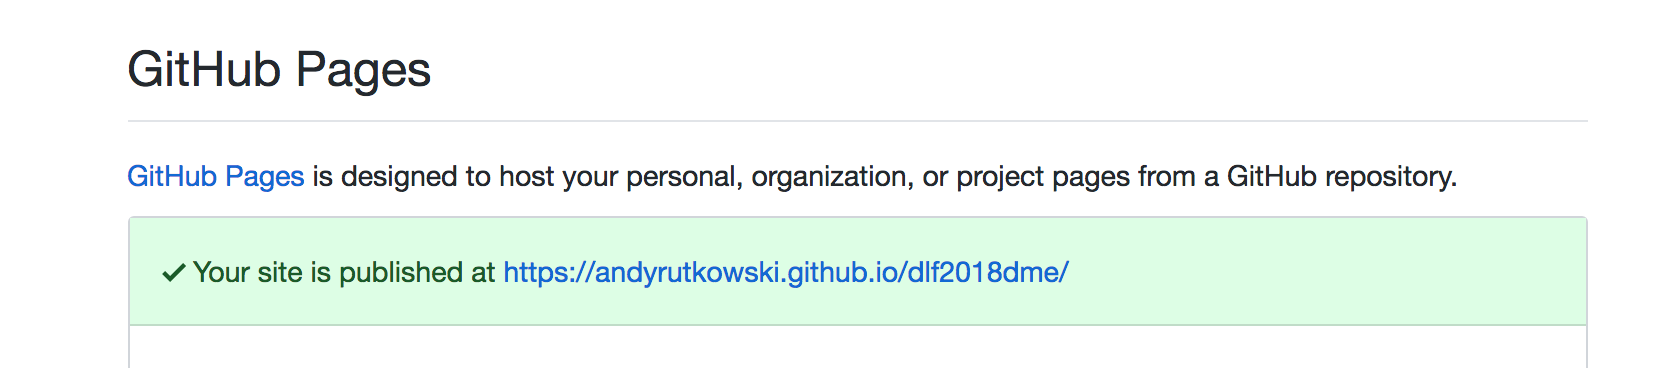
Then go to settings
Make sure your source is "master branch" then wait for the site to be published.
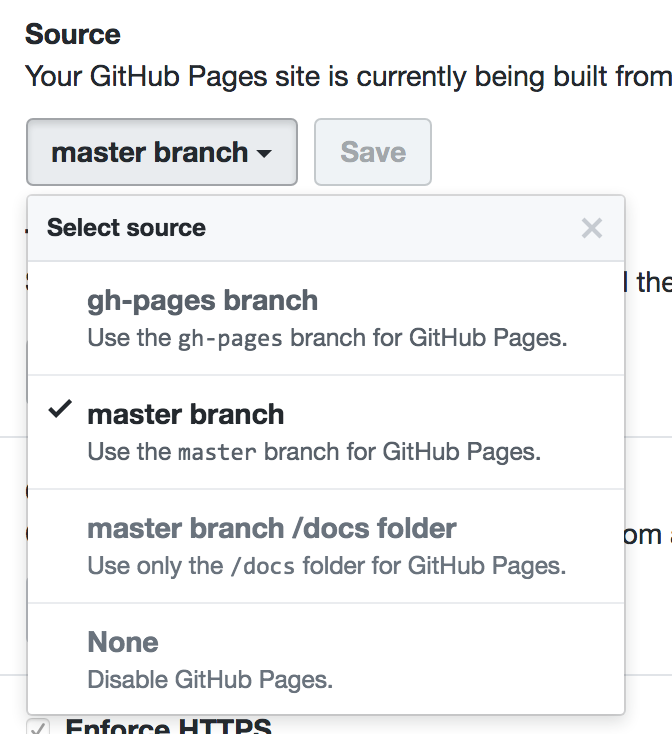
You should now have a map hosted through GitHub.
quick walkthrough of GitHub repo if we have time
recap and discussion
Andy Rutkowski
Visualization Librarian at USC Libraries
arutkows@usc.edu
@andy_rutkowski