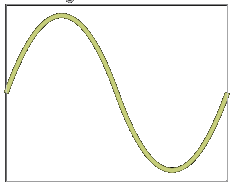
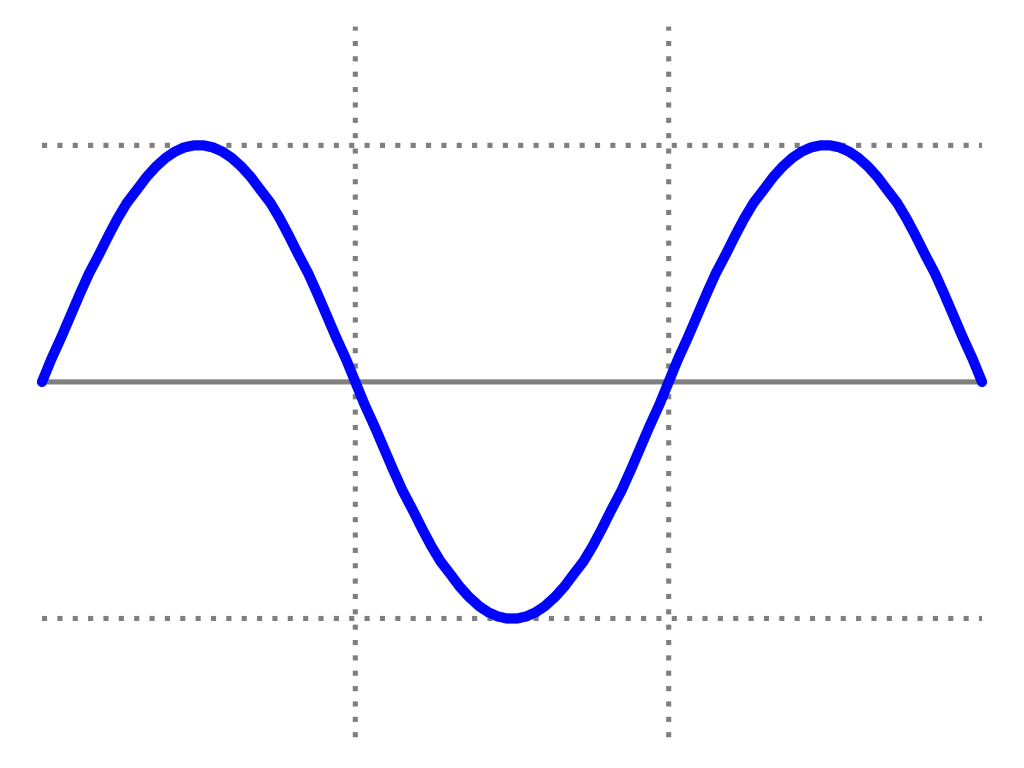
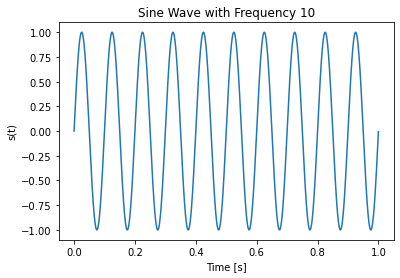
Show 3 simple plots (sine wave, square wave, noisy signal).
Then: Which one would be hardest to analyze automatically—and why?
ENTRYTASK


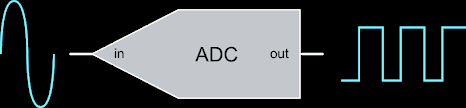
From Analog...
...to Digital
Distortions
Sampling Limitations
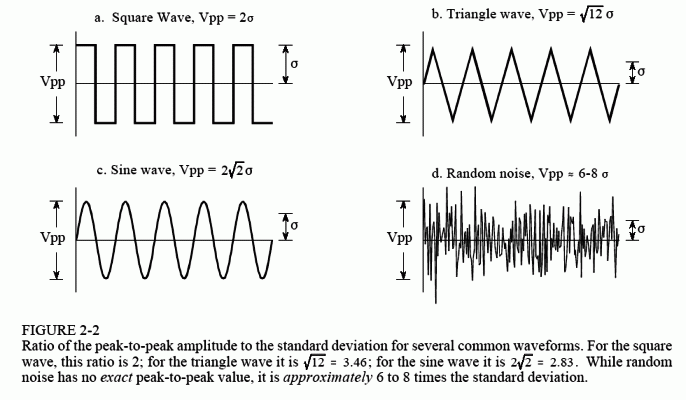
Noise
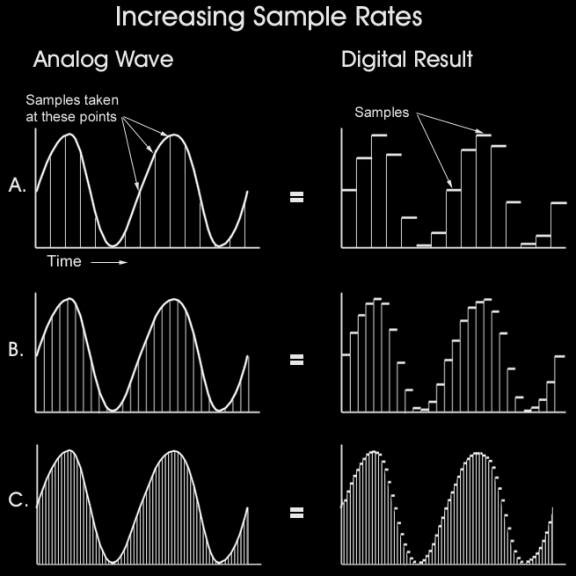
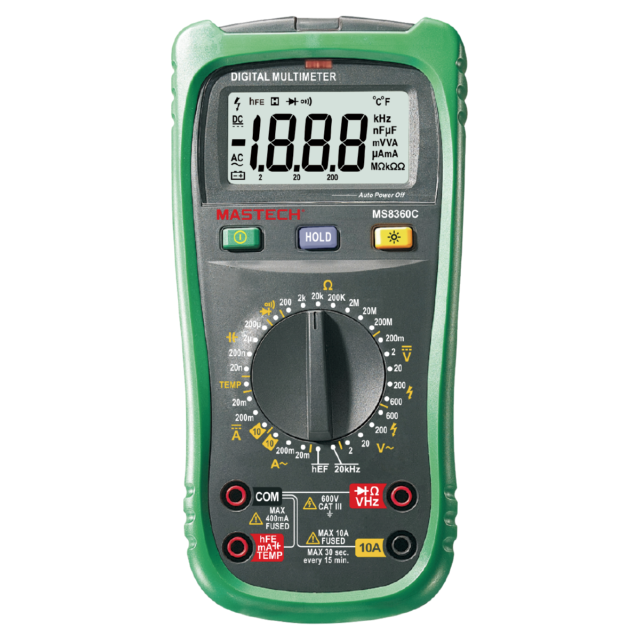
Sampling
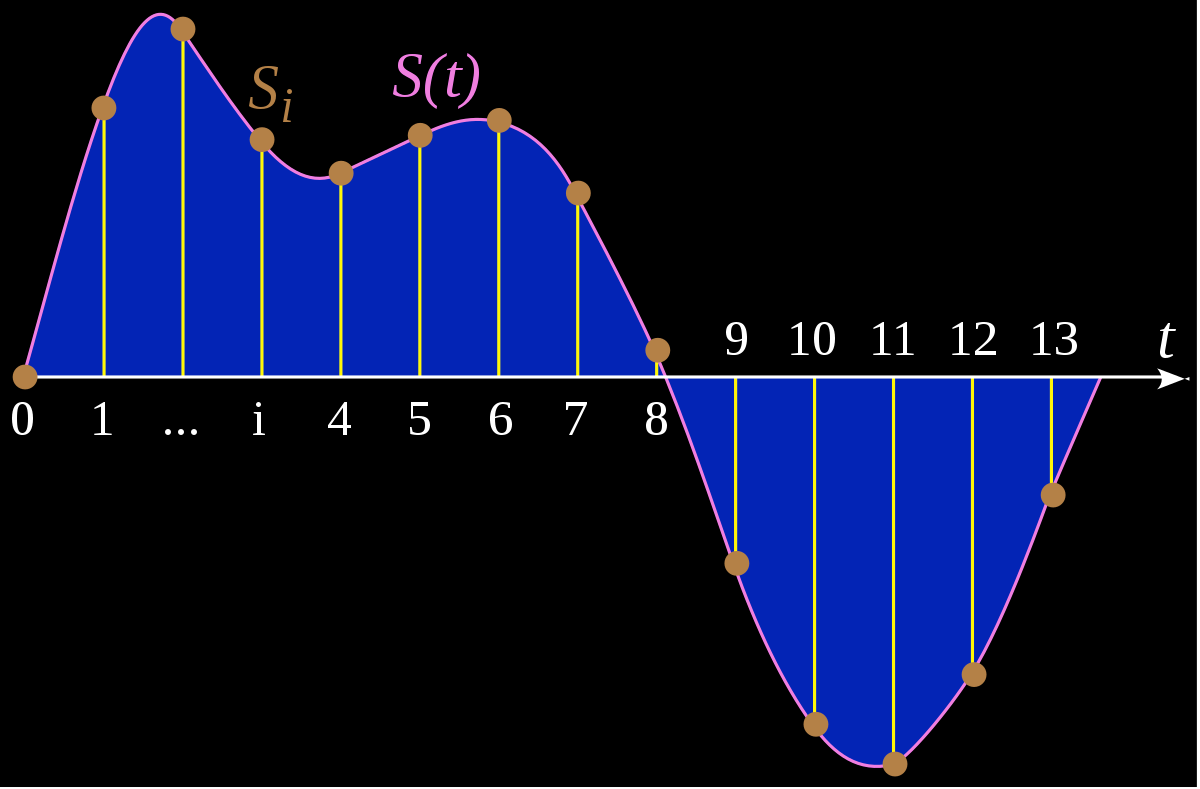
Analog
Sampling Rate
Samples per second [1/s]
Hertz [Hz]
Analog Signal
2 Samples per second
0
1
time [s]
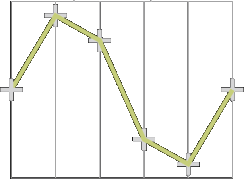
6 Samples per second
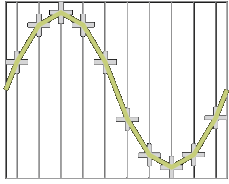
10 Samples per second
6 Hz
10 Hz
2 Hz
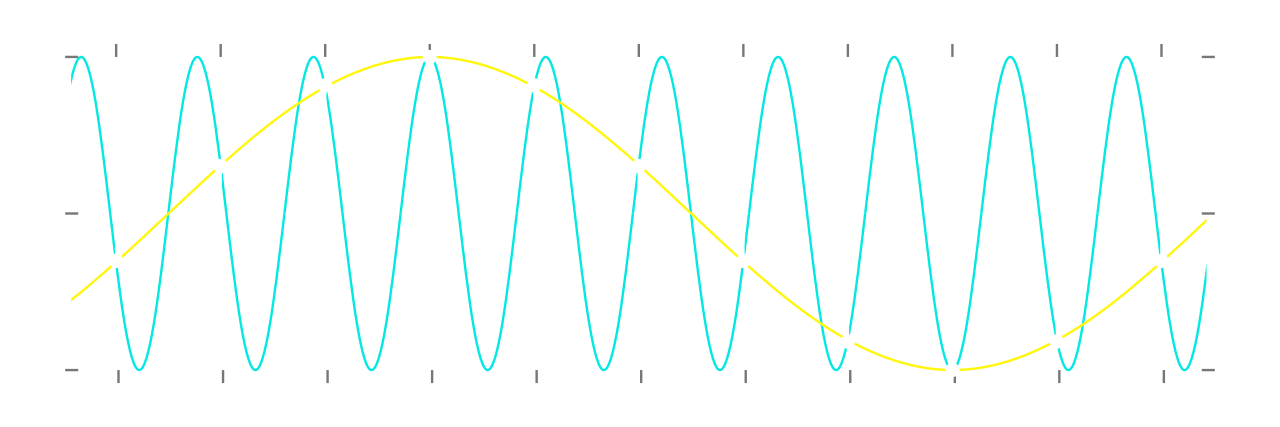
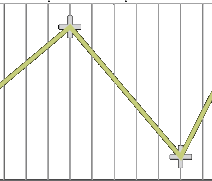
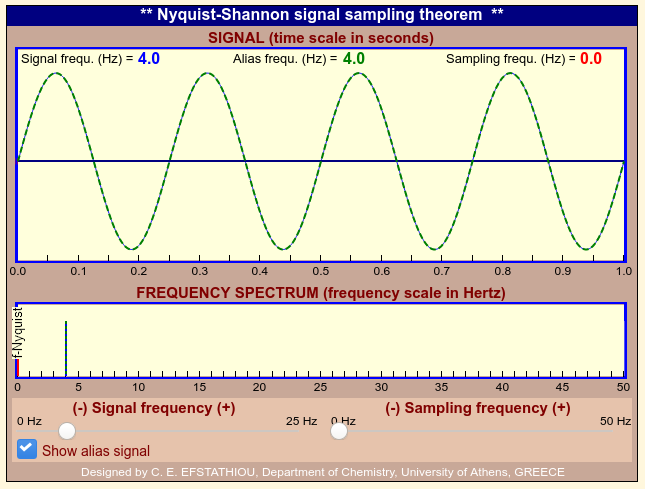
Aliasing
Original Signal
Sampled Points
Reconstructed Signal
Sampling Rate too low
A higher sampling rate is better
?
2 Floats
6 Floats
10 Floats
It's a trade-off!
Nyquist-Shannon Theorem
sampling frequency > 2x signal frequency
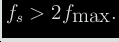
guarantees perfect reconstruction
What does that mean? And how do we get the signal frequency?
Fourier Analysis
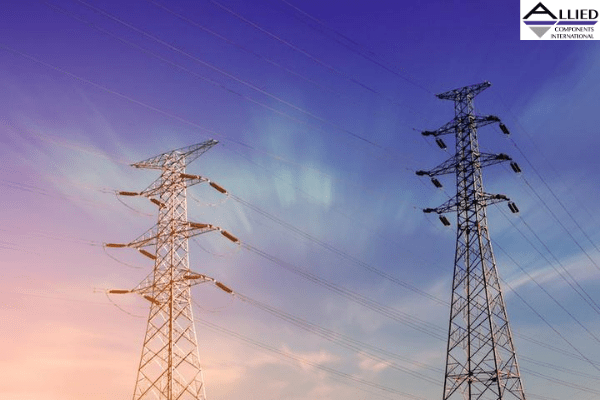
In the US: 60 Hz
In Europe: 50 Hz
From Analog...
...to Digital
Distortions
Sampling Limitations
Noise
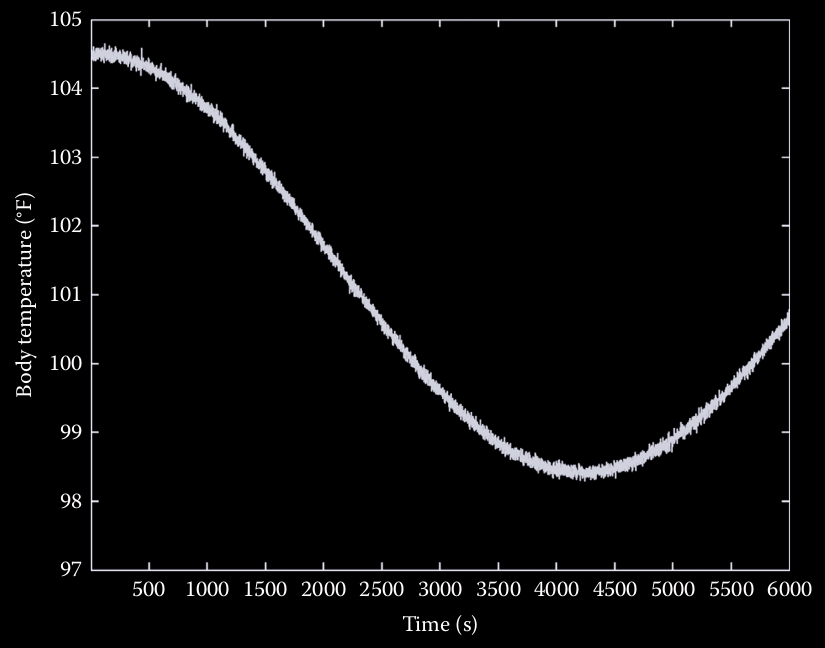
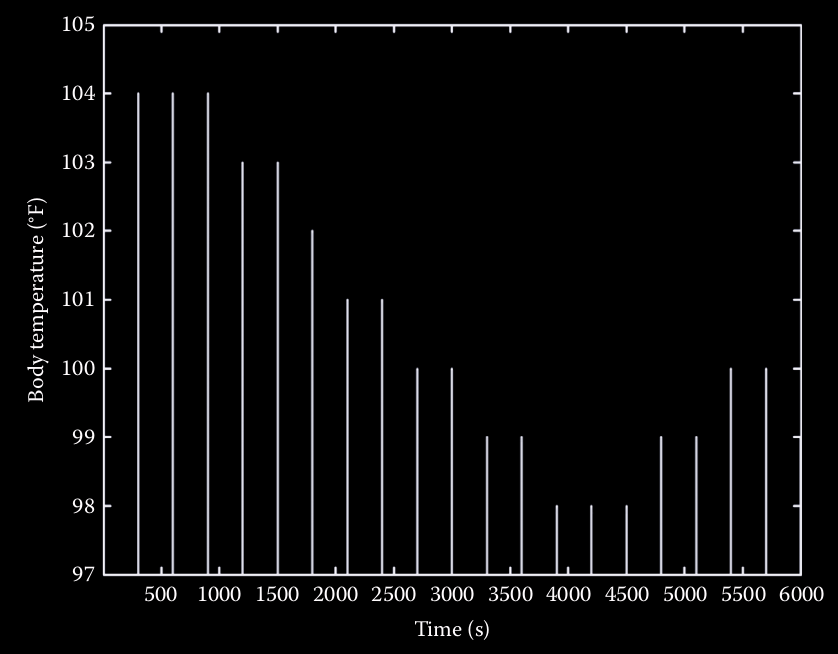
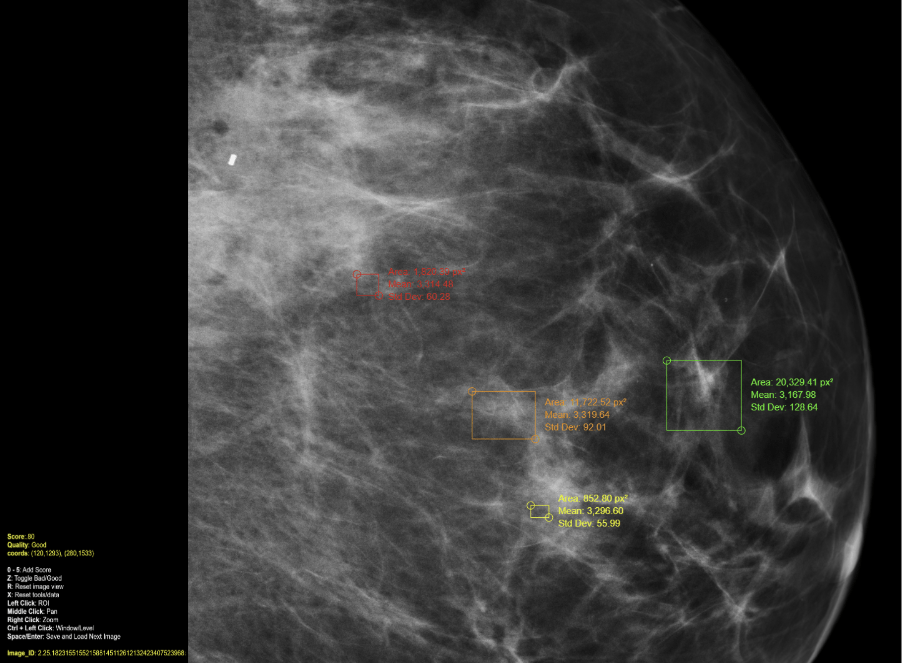
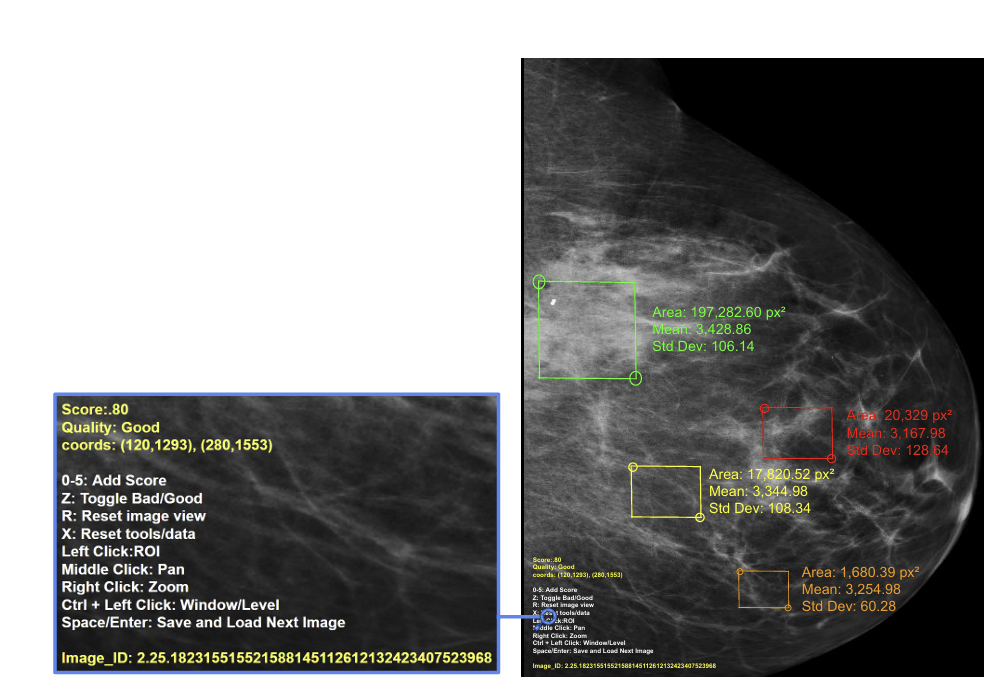
What is the sampling rate here?
19/6000s = 0.0032 Hz
[104, 104, 104, 103, 103, 102, 101, 101, 100, 100, 99, 99, 98, 98, 98, 99, 99, 100, 100]How to represent the data?
Show 3 simple plots (sine wave, square wave, noisy signal).
Then: Which one would be hardest to analyze automatically, and why?
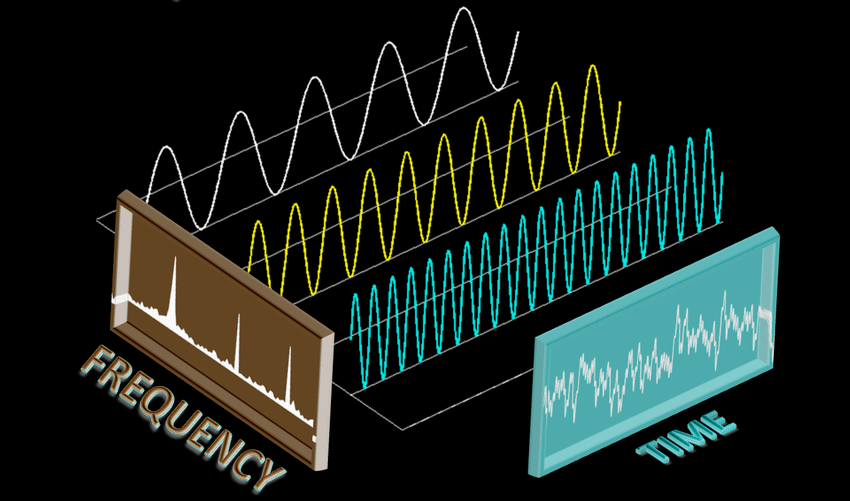
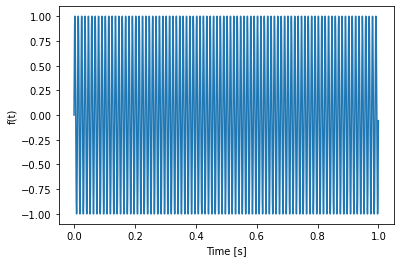
Fourier Analysis


Fourier Analysis
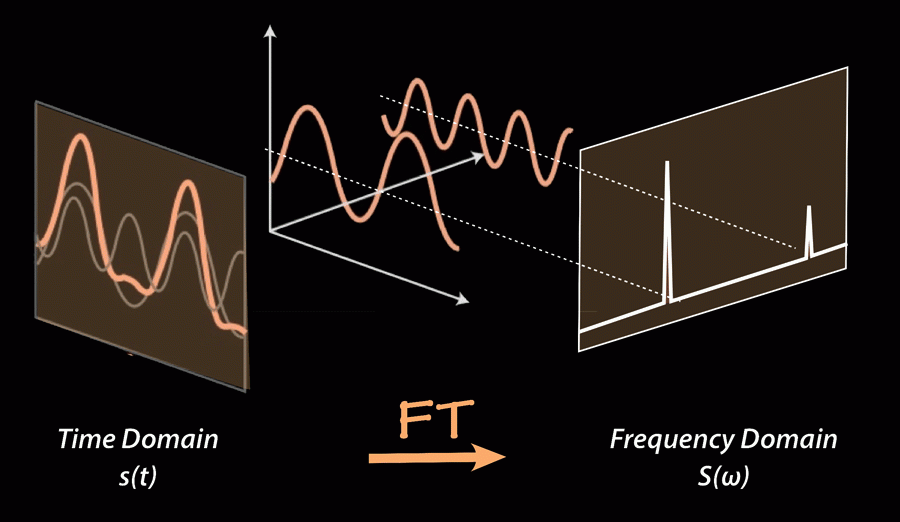
any signal can be decomposed into harmonic signal components
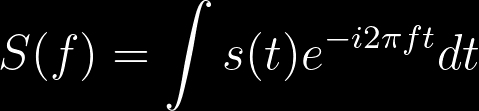
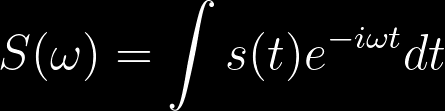
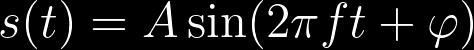
complex
with circular frequency
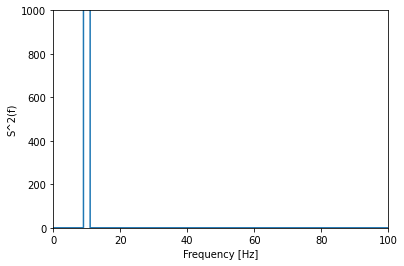
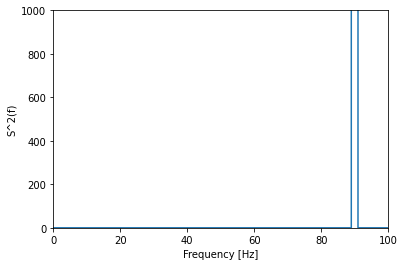
Power Spectrum (S_t ** 2)
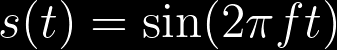
s_t
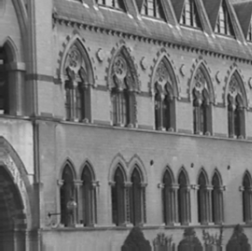
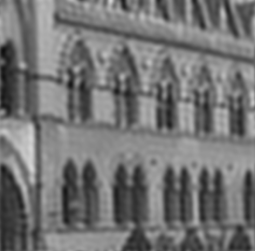
Frequency in images ~ level of detail
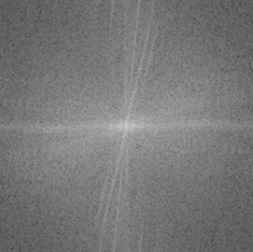
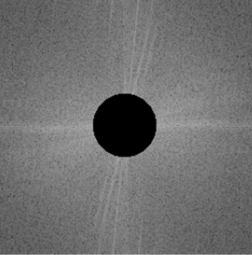
0
0
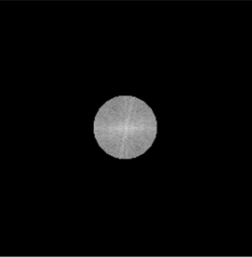
low pass filter
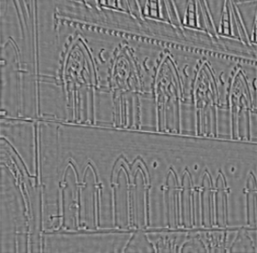
high pass filter
usually high frequency noise
60 Hz noise: electric humming around transformers
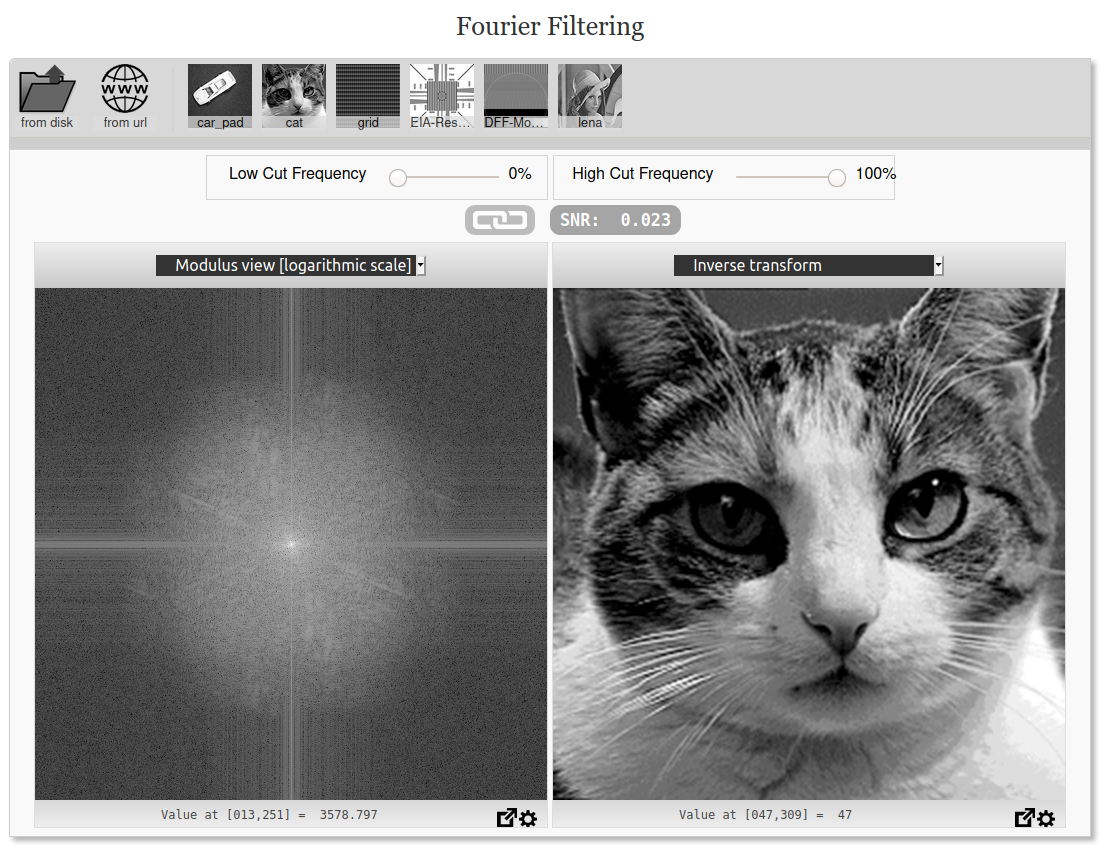
Low-pass == High-cut
High-pass == Low-cut


Intro to Research
How to read a paper
How to write a paper

+ 10 Sessions

JOURNAL
Before
Before
Before
Before
After
BEFORE
BEFORE
AFTER
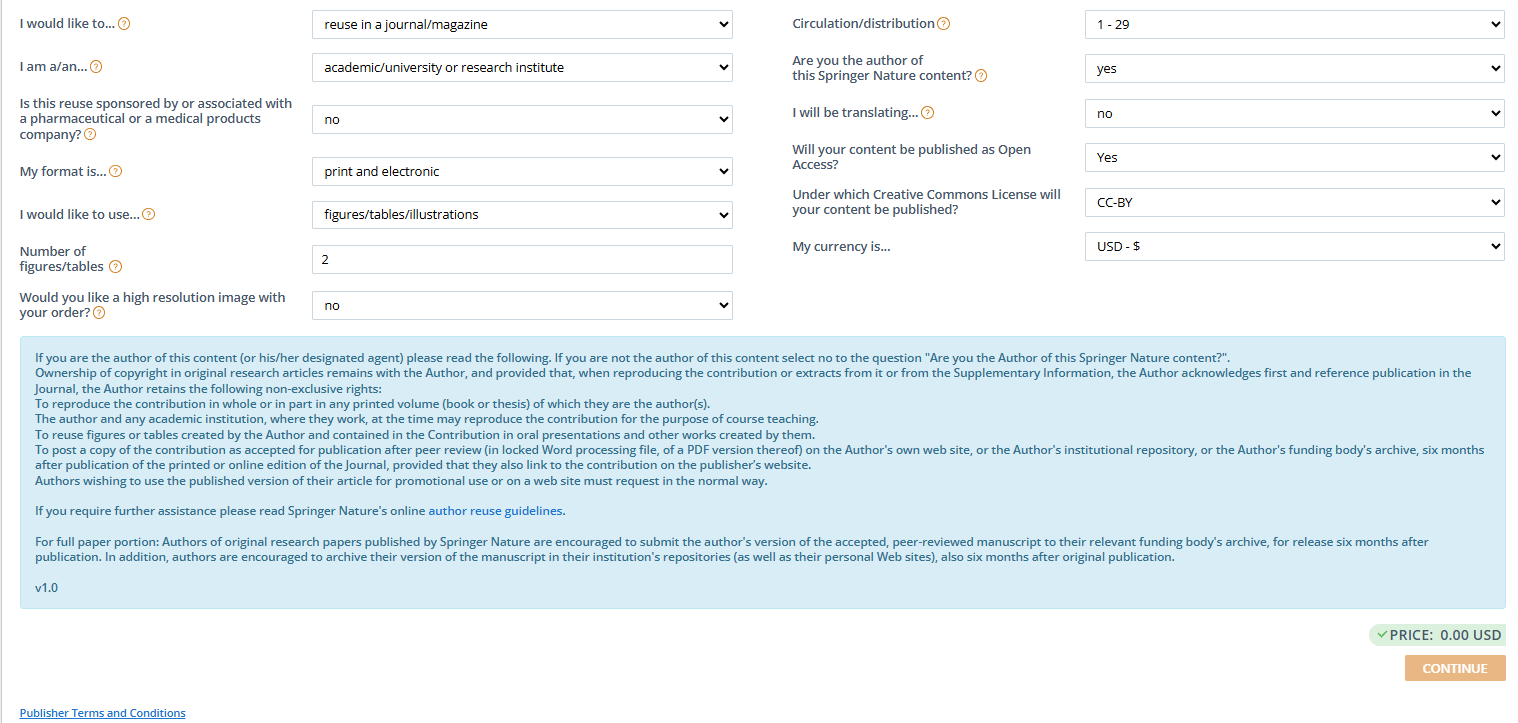
COPYRIGHTS ???
