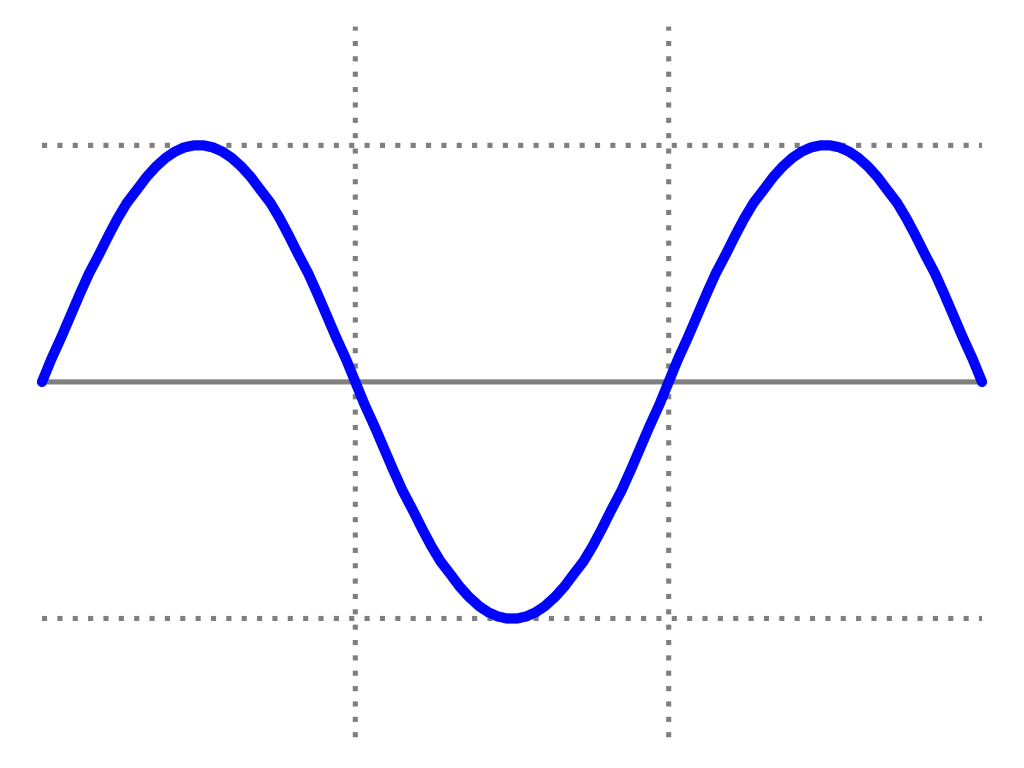
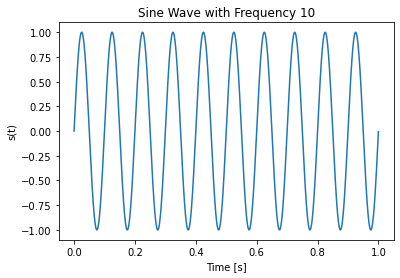
Show 3 simple plots (sine wave, square wave, noisy signal).
Then: Which one would be hardest to analyze automatically—and why?
ENTRYTASK


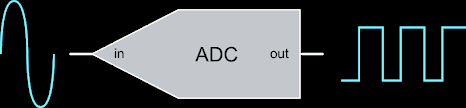
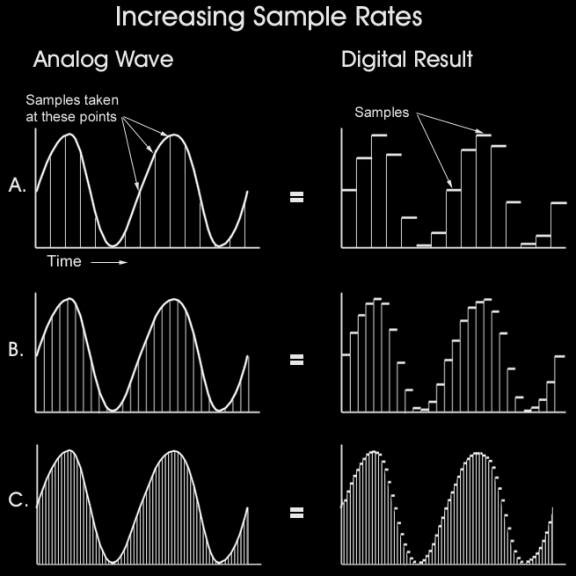
From Analog...
...to Digital
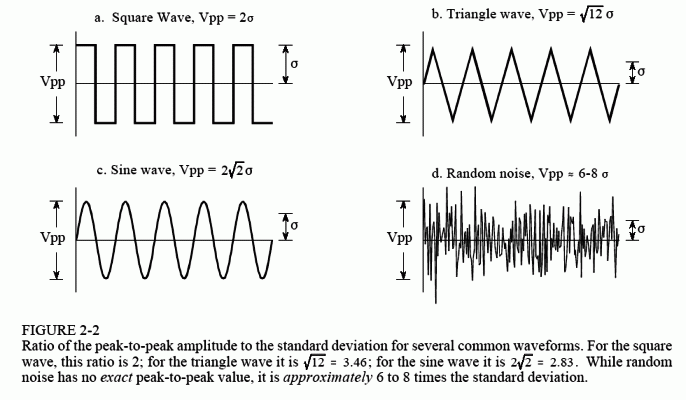
Distortions
Sampling Limitations
Noise
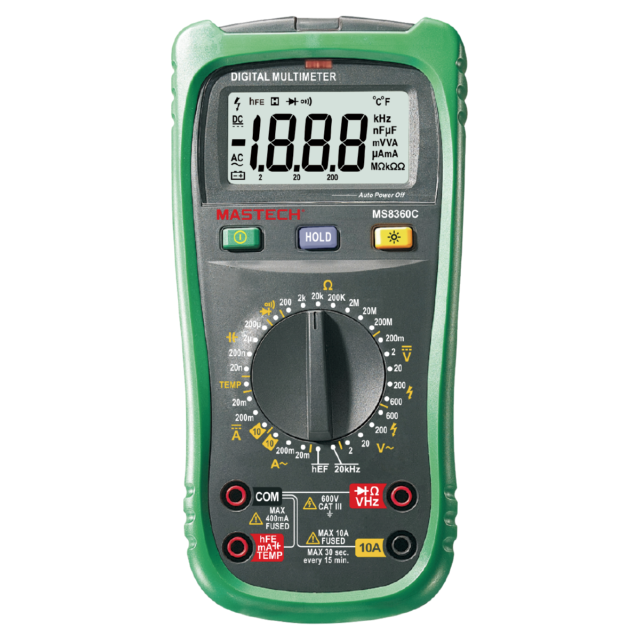
Sampling
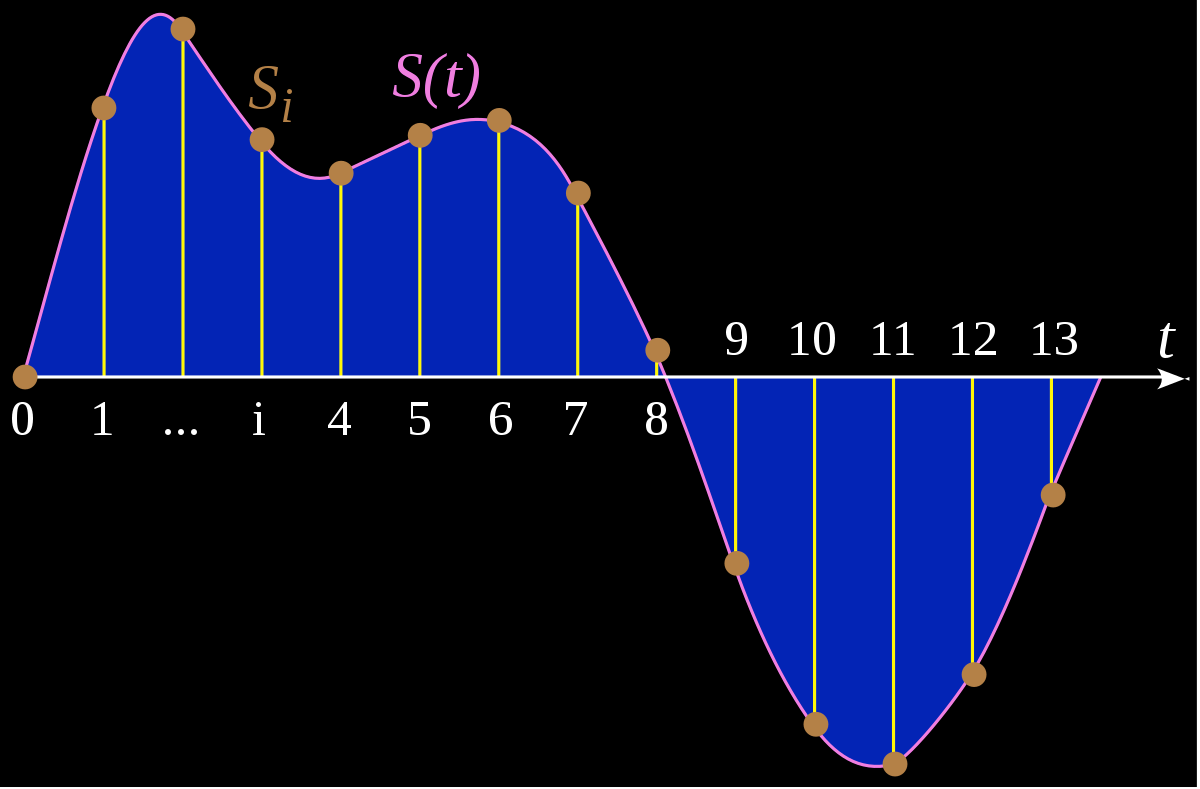
Analog
Sampling Rate
Samples per second [1/s]
Hertz [Hz]
Analog Signal
2 Samples per second
0
1
time [s]
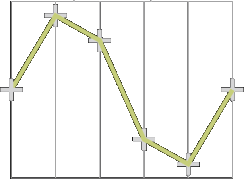
6 Samples per second
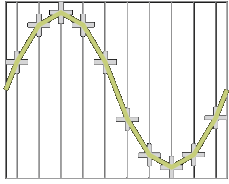
10 Samples per second
6 Hz
10 Hz
2 Hz
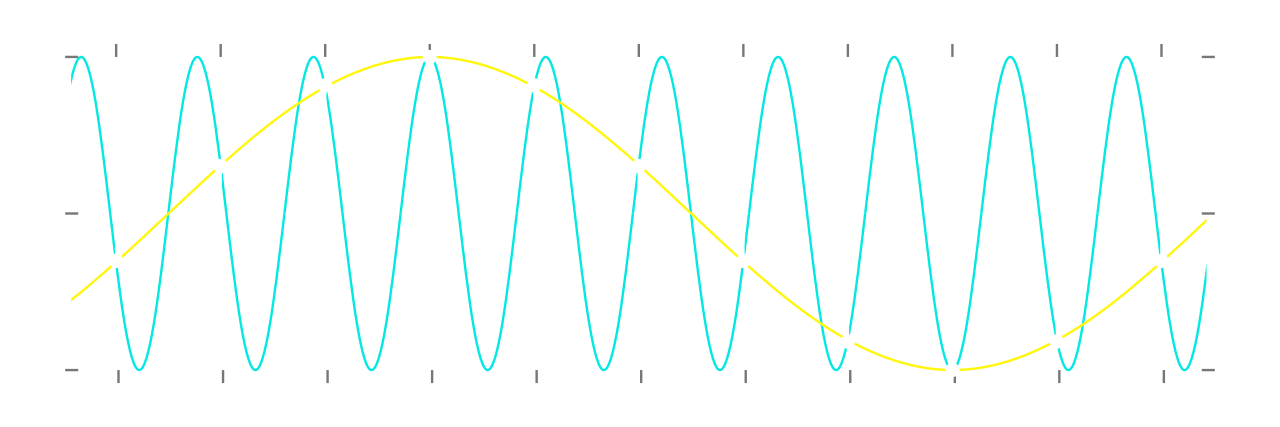
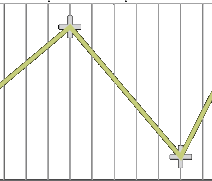
Aliasing
Original Signal
Sampled Points
Reconstructed Signal
Sampling Rate too low
A higher sampling rate is better
?
2 Floats
6 Floats
10 Floats
It's a trade-off!
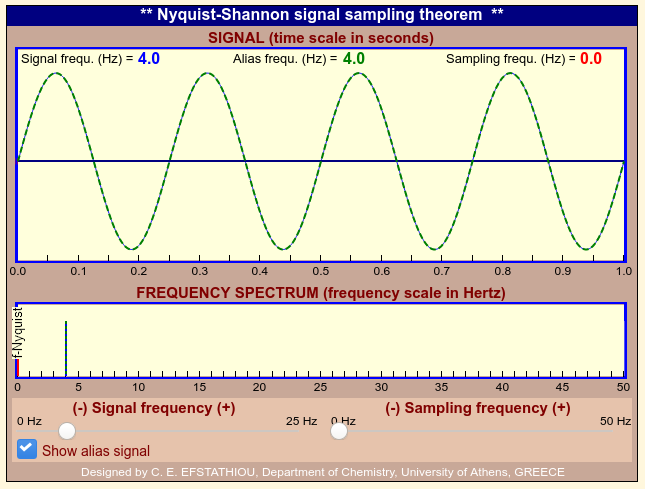
Nyquist-Shannon Theorem
sampling frequency > 2x signal frequency
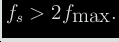
guarantees perfect reconstruction
What does that mean? And how do we get the signal frequency?
Fourier Analysis
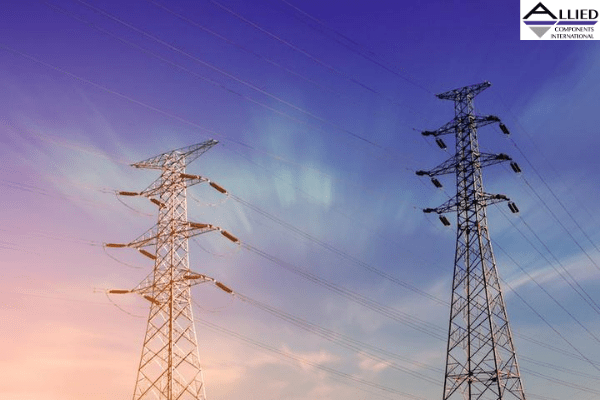
In the US: 60 Hz
In Europe: 50 Hz
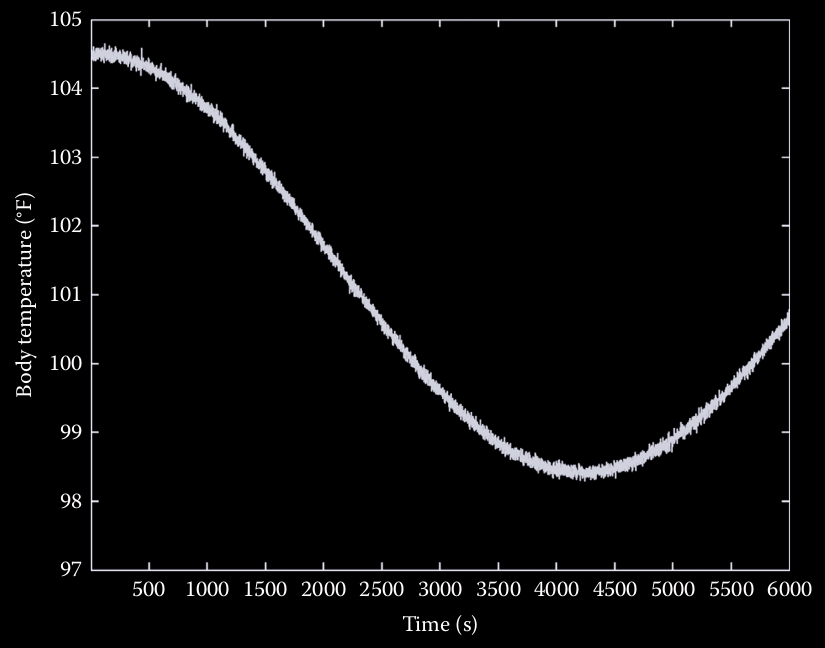
From Analog...
...to Digital
Distortions
Sampling Limitations
Noise
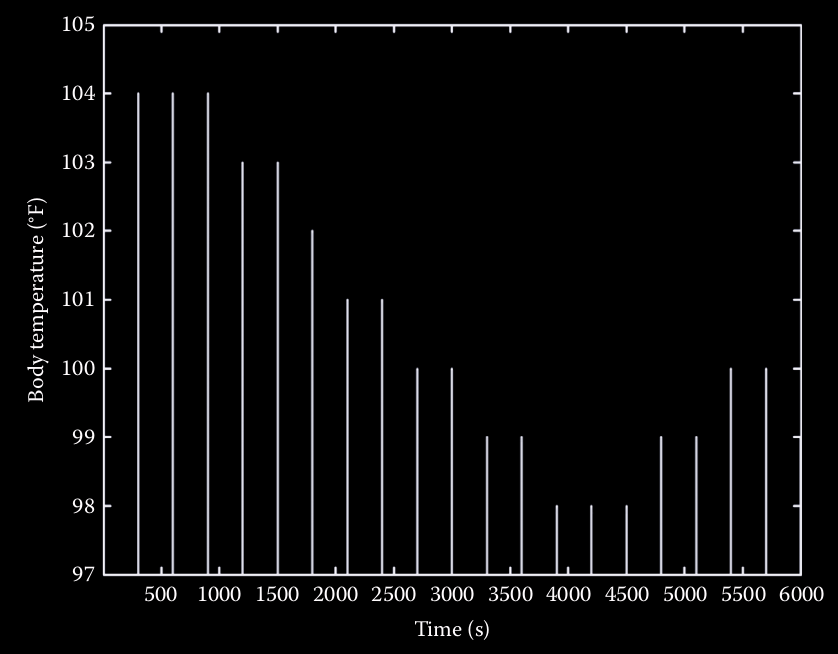
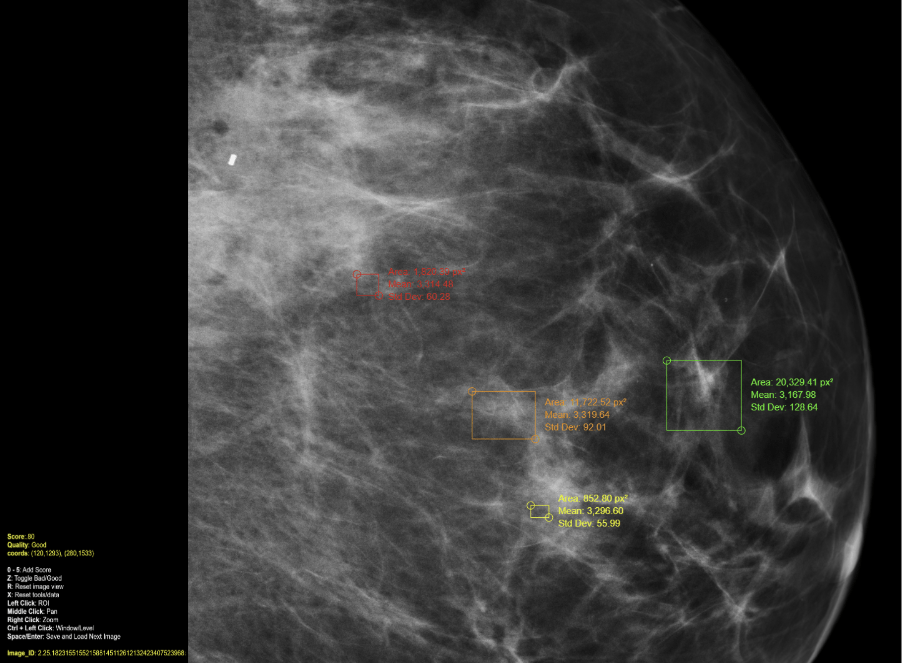
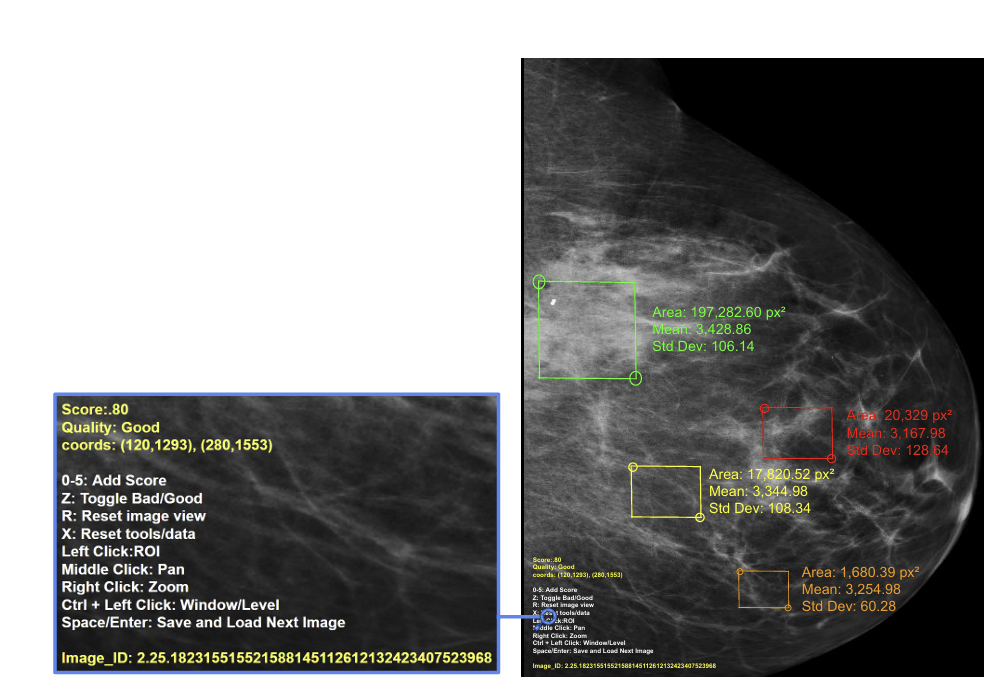
What is the sampling rate here?
19/6000s = 0.0032 Hz
[104, 104, 104, 103, 103, 102, 101, 101, 100, 100, 99, 99, 98, 98, 98, 99, 99, 100, 100]How to represent the data?
Show 3 simple plots (sine wave, square wave, noisy signal).
Then: Which one would be hardest to analyze automatically, and why?
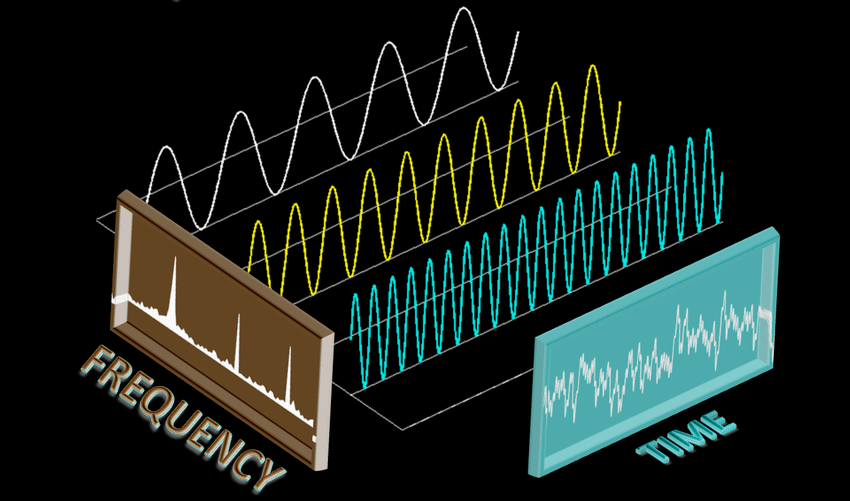
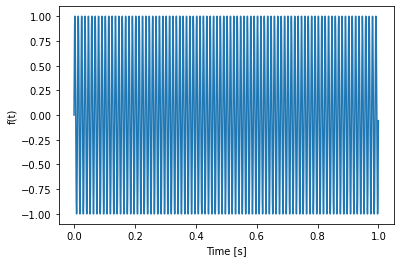
Fourier Analysis


Fourier Analysis
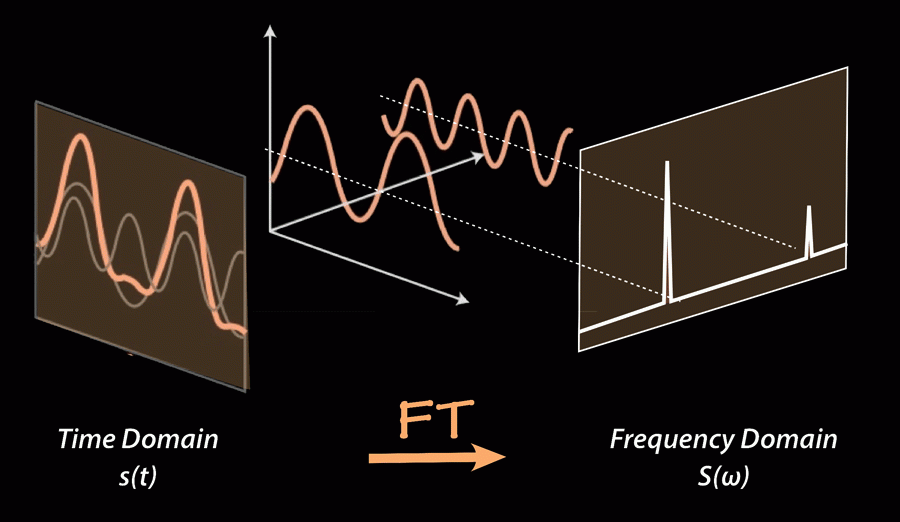
any signal can be decomposed into harmonic signal components
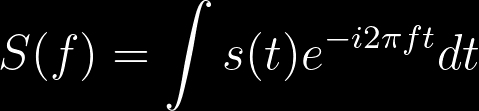
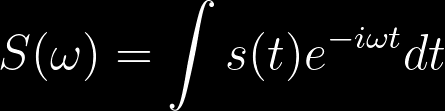
complex
with circular frequency
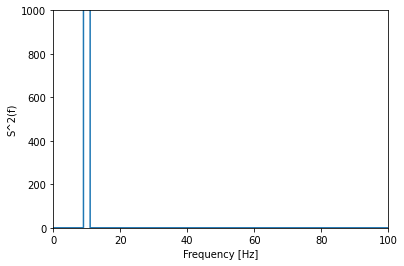
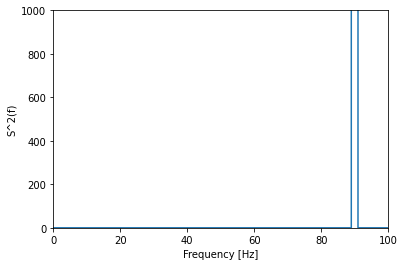
Power Spectrum (S_t ** 2)
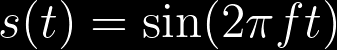
s_t
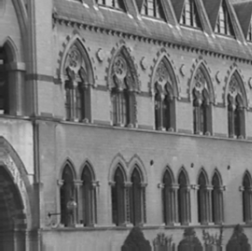
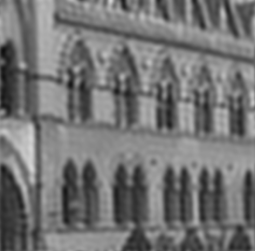
Frequency in images ~ level of detail
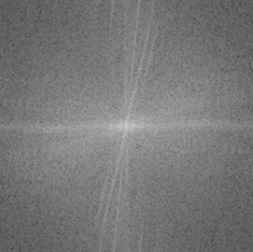
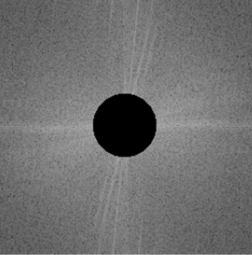
0
0
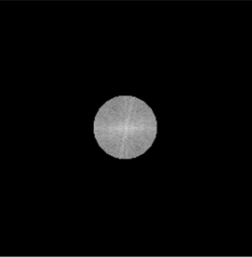
low pass filter
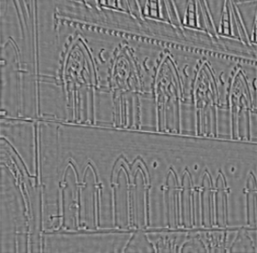
high pass filter
usually high frequency noise
60 Hz noise: electric humming around transformers
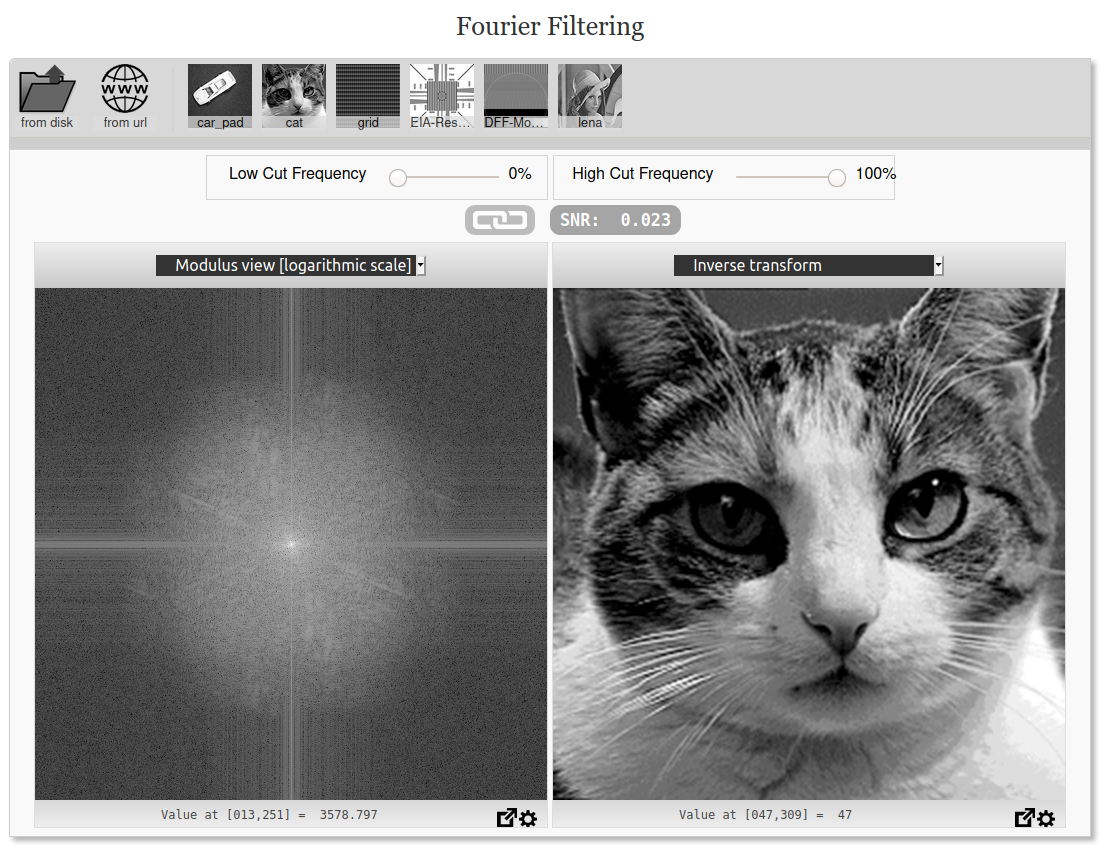
Low-pass == High-cut
High-pass == Low-cut


Intro to Research
How to read a paper
How to write a paper

+ 10 Sessions

JOURNAL
Before
Before
Before
Before
After
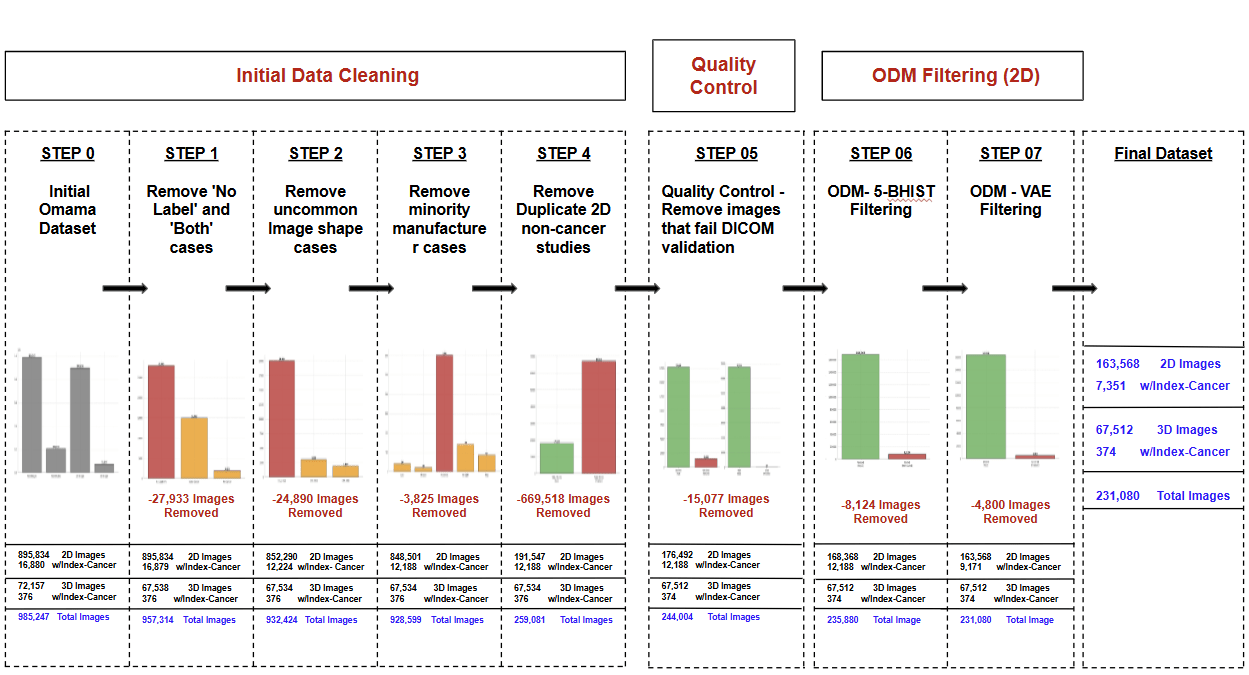
BEFORE
BEFORE
AFTER
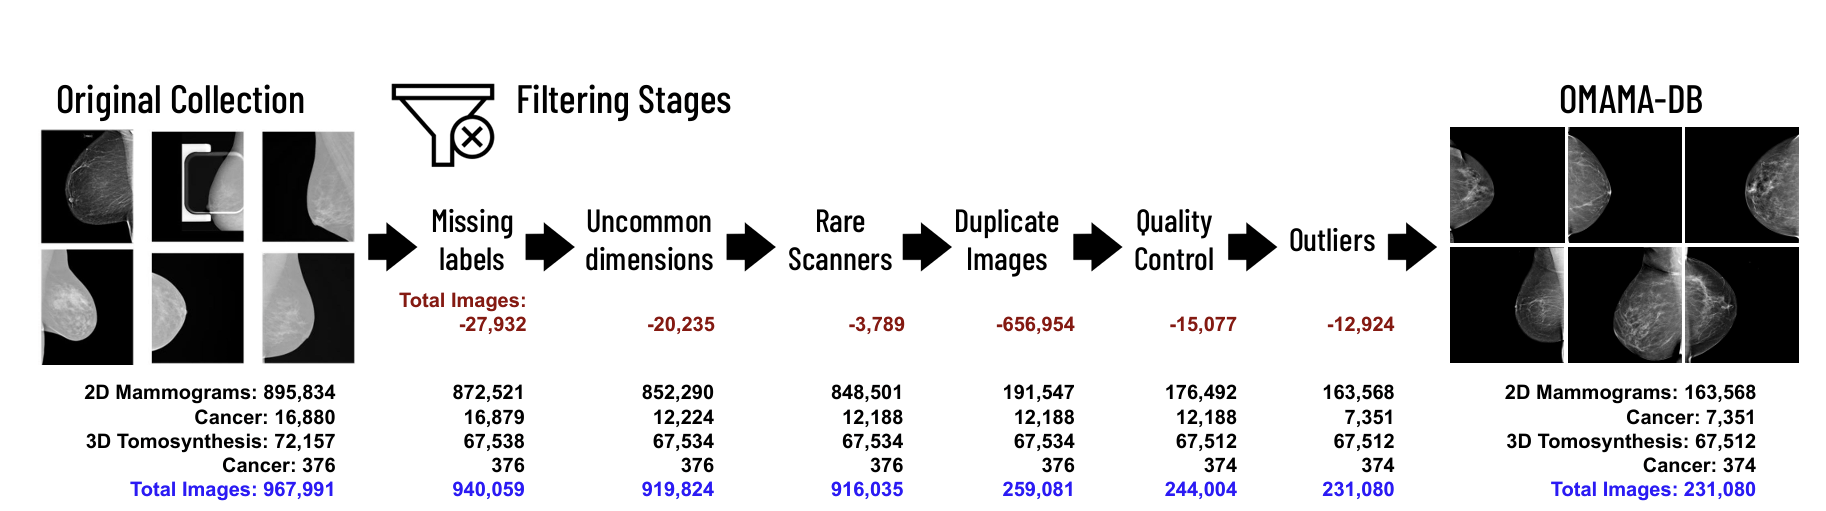
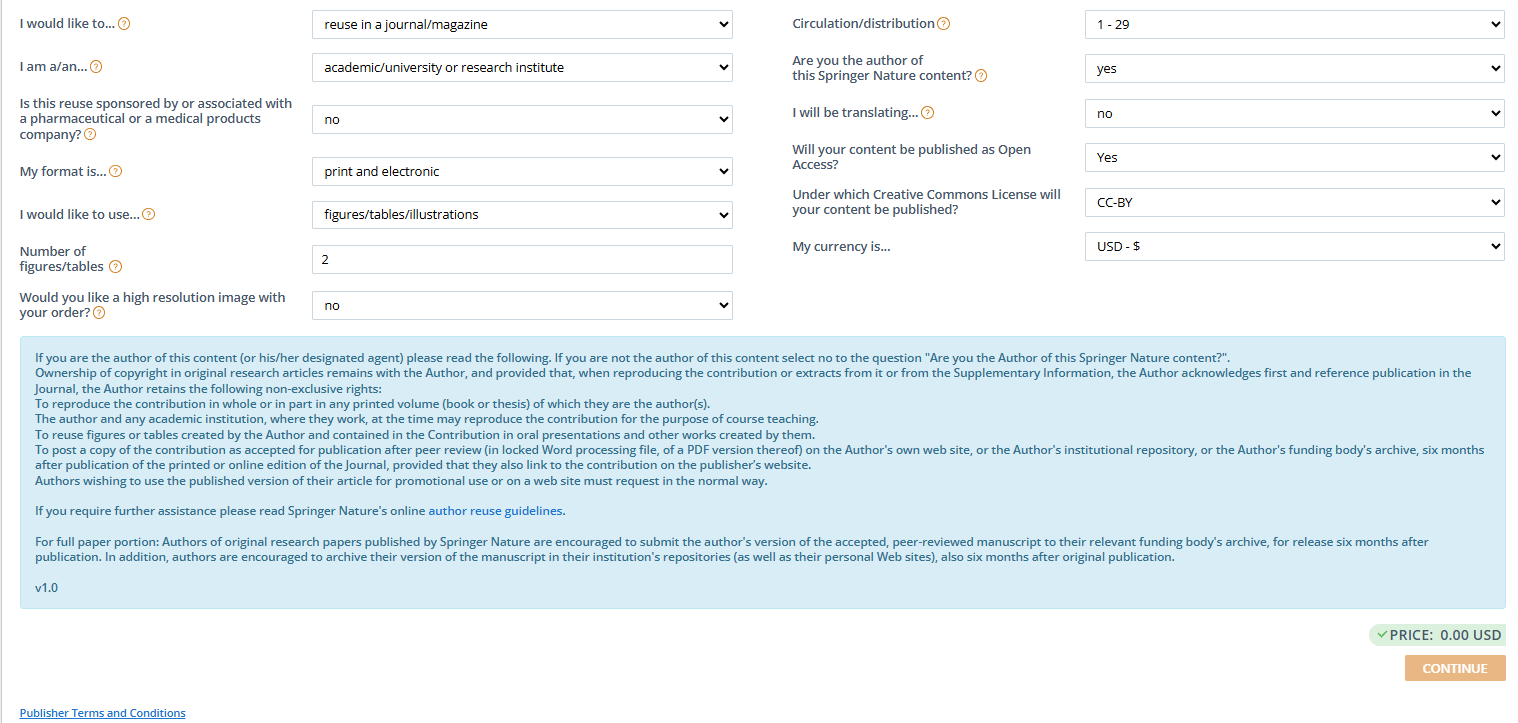
COPYRIGHTS ???

CS666 Lecture 02
By Avanith Kanamarlapudi
CS666 Lecture 02
Slides for CS666 Biomedical Signal and Image Processing at UMass Boston. See https://cs480.orghttps://cs480.org


