Data Analysis:
The Essential Bits
80% of Data Analysis == Cleaning & Preparing Data
-Not just the first step, iterative
- Encompasses a truly breathtaking amount of tasks
- Giving you a comprehensive overview of concepts/tools could easily fill two-three graduate courses.
- Data viz and statistical modeling (e.g. hypothesis testing) most focused on in teaching, represents 20% of work
- Students are not prepared for original research or real world experience
Concepts vs Tools
- Teaching different tools (Python, SQL, R, Tableau) takes time. I can point you in the right direction and give resources.
- Concepts are harder to grasp and find on your own
- Focus on core skills. Especially those you will not get in standard curricula. Examples I use will be in Python and Tableau.
- Having a vocabulary for 80% of your data analysis work is important for collaboration and reproducibility of your work
Core Concepts
- Tidy Data
- Merge Data (Joins, Union)
- Split-Apply-Combine Strategy
- Basics in spatial analysis
References
- Joins.
- Split-Apply-Combine: pandas
- Code vs GUI tools
- Split-Apply-Combine Paper by Hadley Wickham
- Tidy Data Paper - Hadley Wickham
- Spatial Joins-postgis
- Tableau Spatial Join
- Intro to maps in Tableau
- Choropleth maps - data classification
- When to use choropleth maps
- Color in Data Viz
- R for Data Science *The best*
Future Versions of This Presentation to Include:
- Concat or Union.
- Tidy Data and Data Viz - example of multiple years as columns and counts. Not tidy. T
- Melt, Pivot, Transpose Data. (under new tools to tidy [ttt])
- Join on multiple fields
- Top 5 Reasons a Data Set Is Messy (before ttt)
- More split-apply-combine examples
- Additional Spatial Topics: create new presentation
- Add examples in slides. Render Jupyter Notebook HTML:
- Consider adding in a section on Feature Engineering
- Consider adding in a section on how to count
- Add section on Data Analyst Trap
Title Text

Examples
- Wide to long (hypersegregation one racialethnic category >= 85%)
- Concat - MPROP different ownership and Longitudinal Census data (ACS 5 year estimates)
- Split-Apply-Combine - groupwise imputation, group and rank, )
Tidy Data
Has Anyone Ever Taught You How Data Should Be Structured?
Usually:
-
Asked to create presentation spreadsheet table
-
Encounter one in the wild
-
Tidy, beautiful datasets in class
-
Data are usually one table per analysis
Messy Datasets Cause Real Pain.
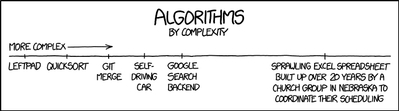
Source: xkcd

“[Of statistics/data analysis] Total disconnect between what people need to actually understand data and what was being taught.” - Hadley Wickam
Tidy Data
1. Each variable forms a column.
2. Each observation forms a row.
3. Each type of observational unit forms a table.
Hadley Wickham - "Like families, tidy datasets are all alike but every messy dataset is messy in its own way."
Your First Step Should Be Making Your Data Tidy
- Think about the data question you have
- What is Tidy will change based on various data questions
- The more you work with data, the more this will make sense
- Essential structure for data analysis and visualization (stacked bar chart example)
- Useful for evaluating new data
- This is abstract, so we will look at a real example
Tax Data
- Examine Data You Have
- Does each variable form a column?
- multiple variables are stored in one column (address and owner)
- Does each observation form a row?
- Tax year, delinquent amount
- Amount paid?
- Observation unit complete?
- Does each observational unit form a table?
- Owner's name
- What is the unique ID? (shorthand for observational unit)
Data Manipulation
Taken from Hadley Wickham's Tidy Data
- Filter: sub setting or removing observations based on some condition. By year or by owner.
Data Manipulation
Taken from Hadley Wickham's Tidy Data
- Transform: adding or modifying variables. These modifications can involve either a single variable (e.g., log-transformation), or multiple variables (e.g., computing density from weight and volume). Example owner data. Same owner for all tax delinquent year. Not paid. Add data later. Split by value.
Data Manipulation
Taken from Hadley Wickham's Tidy Data
-
Aggregate: collapsing multiple values into a single value (e.g., by summing or taking means) e.g. total current tax delinquency.
-
Transform and aggregate - total current delinquency for owners with an LLC. Often these techniques will be combined or chained together.
-
^ Another example of multiple values in one column
-
Data Manipulation
Taken from Hadley Wickham's Tidy Data
- Sort - changing the order of observations. Often very helpful when you need to rank data.
- Consider this: A landlord named Bob let's a property go into foreclosure. Then a new LLC is started by the same landlord and Bob buys back the property to avoid paying taxes. Bob does this for several other properties. To identify other potential examples where Bob did this, you can sort all tax delinquent properties owner after Bob.
Merge Data
Joins
Left Join
Multiple keys
Concat
What if You Want to Combine Your Data?
e.g. owner occupied, tax delinquent
Brief Discussion on Joins
- There are many joins. I will discuss the two most common - inner and left.

Inner Join
- INNER JOIN
An inner join only returns those records that have “matches” in both tables.

Left Join
- LEFT JOIN
A left join returns all the records in the “left” table (T1) whether they have a match in the right table or not..

Many to One or One to Many
- If the table you are merging has multiple rows per ID, all will be joined.
- Reason why data should be tidy.
- Excel cannot do many to many
- Example of Join on Multiple Columns
- e.g. Owner Occupancy per year.
Split Apply Combine Strategy
Intro to Split-Apply-Combine
- Many data analysis problems involve the application of a split-apply-combine strategy
- Break up a big problem into manageable pieces, operate on each piece independently and then put all the pieces back together
- Various tools use this strategy: Pivot tables in Excel, Groupby in SQL and Pandas, LOD in Tableau, and plyr in R
- It's a type of problem that crops up everywhere
Diagram of Split-Apply-Combine

Split Apply Combine Example
- How many years has this parcel been tax delinquent.
- Split (by year), apply count for each row, and combine
- Little bit more complex: How many parcels are tax delinquent for more than three years and have the same owner each of those years?
Basics In Spatial Analysis
Spatial Data Types
(vector)
- Polygon - used to represent areas that have a boundary e.g. zip code, city boundary, park
- Point - discrete point. Can be represented by latitude and longitude pair e.g. restaurant, residential home, incident of crime
- Line - linear feature e.g. river, street,
- Combination of the above
- Vector vs raster
Geocoding for Viz Basics
-
Get coordinates for street addresses
-
Identify purpose
-
choose geocoder (Texas A&M or Geocodio fail on large > 2500 datasets)
-
preprocess data
-
geocode
-
verfiy output
-
import to viz tool
Spatial Join:
Like Joins, But In Space.
-
"Allow you to combine information from different tables by using spatial relationships as the join key."
-
"Much of what we think of as “standard GIS analysis” can be expressed as spatial joins" - Postgis Documentation
Examples include:
- Point in polygon: how many homes with lead services lines are in Cold Spring Park?
- Polygon in point: which neighborhood has a grocery store?
- Line intersect Polygon: Which neighborhood has a river running through it
- Point to line: How many traffic accidents happened on this street block?
How Many Licenses are in The Near West Side?
- Spatial Join will always combine at least two datasets
- If you want to perform a spatial join in Tableau, beware:
- CRS must match
- Both datasets must be in shapefile format (open lat/long in QGIS, Geopandas, ArcGis and save as .shp)
Other Important Spatial Analysis Topics Not Covered
- Choropleth maps (color; diverging, sequential, categorical, classification scheme; how to bin distribution of the values, data normalization; choosing correct denominator; bivariate)
- Point pattern mapping, grid based mapping, and kernel density
- MAUP (modifiable areal unit problem)
- MOE (margin of error - important for census data)
Why Learn Python (or R)?
(Besides the feeling of superiority it gives you.)
Seriously, Why Code?
-
You only need one: "Python as Super Glue for the Modern Scientific Workflow" Data analysis requires you to port data to and from different programs and tools. Python can (almost) do it all.
- Reproducibility - anyone can recreate your work to get the same result
- Reuse - data analysis involves solving many similar sub-problems. A solution for one issue can be reused for another. Also loops.
- Automation - need to rerun the analysis multiple times/production.
- Free - SAS, SPSS, ArcGis are expensive.
- Can scale - Excel and ArcGis do not handle large data well/at all. Shapefile has a 2 GB limit. Excel's maximum rows: 1,048,576
- Collaboration - easier to assign sub-tasks and track progress.
- Required by Employers and Academics - look at any job posting
- Learn programming - learning to code opens the door to other tasks: build websites, web scraping.
Mike Bostock on Efficiency vs Generality:
" Despite these challenges, we’re still writing code, for myriad applications, more than ever before. Why? Are we masochists? (Maybe.) Are we unable to change? (In part.) Is there no better solution?
In general — and that is the critical qualifier — no. Code is often the best tool we have because it is the most general tool we have; code has almost unlimited expressiveness. Alternatives to code, as well as higher-level programming interfaces and languages, do well in specific domains. But these alternatives must sacrifice generality to offer greater efficiency within their domain."
Chris Moffit on Escaping Excel Hell:
Excel Hell: "A place of torment and misery caused by using Excel as your primary data manipulation tool."