建國中學
暑假地球科學讀書會
斜溫圖
Presenter: 122527 Brine
Index
INtroduction
commonly used thermodynamic diagrams
general purposed ones
- P-V diagram
- T-S(specific entropy) diagram
- H(enthalpy)-S diagram
- Psychrometrics chart
- cooling curve
You guys are smart and know these already right?
weather bois
- Emagram
- Stüve diagram
- Tephigram
- Skew T Log P diagram
weather bois
- Emagram
- Stüve diagram
- Tephigram
- Skew T Log P diagram
Emagram
- Devised by Heinrich Hertz
- P-T diagram based
- European
- First of the kind
Stüve diagram
- Used in the US
- P-T based
- No Clausius–Clapeyron relation
- No CAPE
- T-S(phi) based

I don't actually know
SKew T
- We'll talk about this later
"Preview"
things to know
what you will need to understand the following(maybe not)
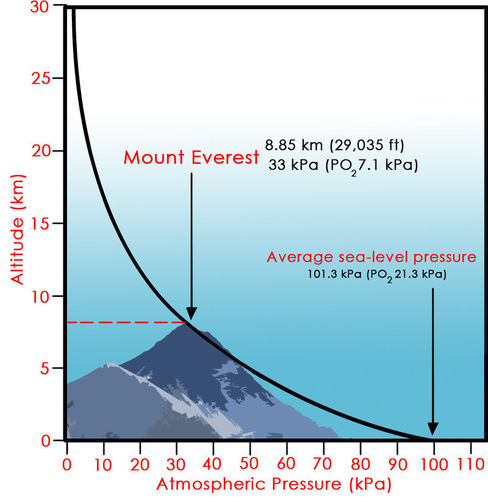
Physical quantities - bar
1\ bar = 100,000\ Pa \leftrightarrow 1\ mb = 1\ hPa
why switch?
SI\ units \rightarrow 1\ Pa = 1\frac{N}{m}
Entropy
\Delta S = \frac{\Delta Q}{T}
a\ reversible\ process\ should\ have\ an\ entropy\ of\ 0
"possibility"
First law of thermodynamics
\Delta Q = \Delta U + W
dH = TdS + vdp
Potential Temperature
how?
Potential Temperature
- We move air parcels to a certain height to compare their temperature at such altitude
\theta = T_0(\frac{P_r}{P_0})^\frac{R_d}{C_p}
\frac{\partial \theta}{\partial z} > 0
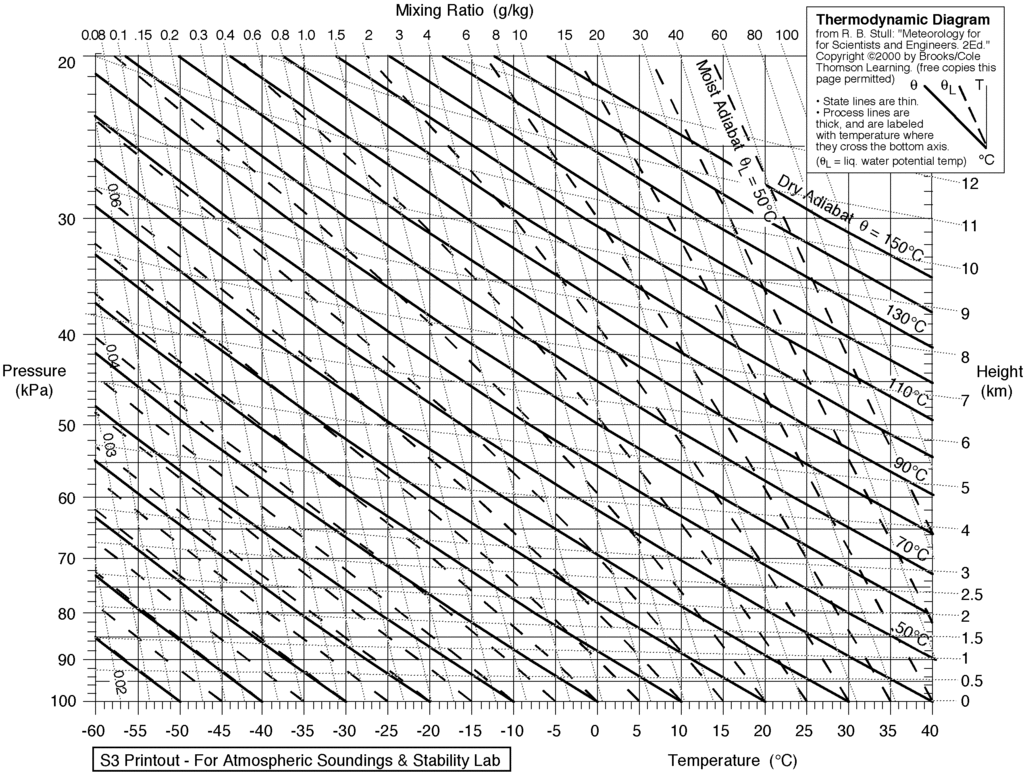
Basics of Skew-T
Introduction to what made me suffered
What a skew-T looks like
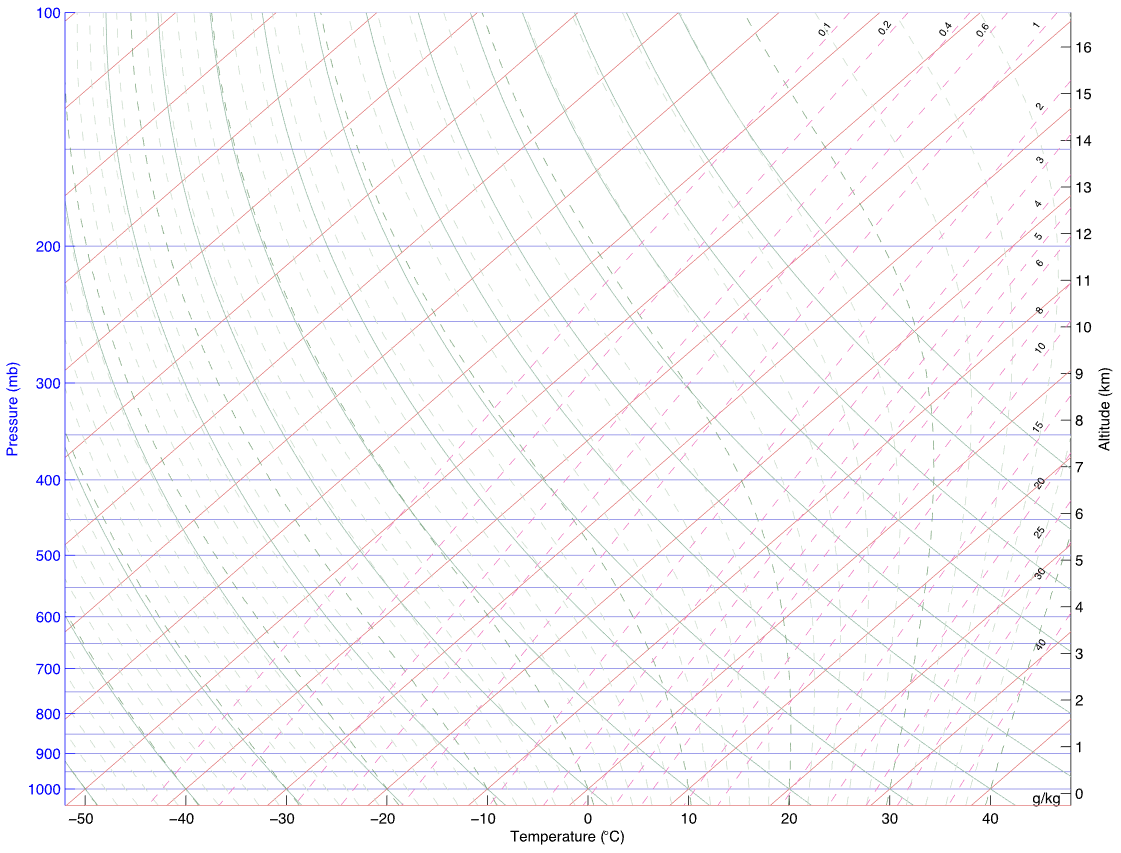
base element
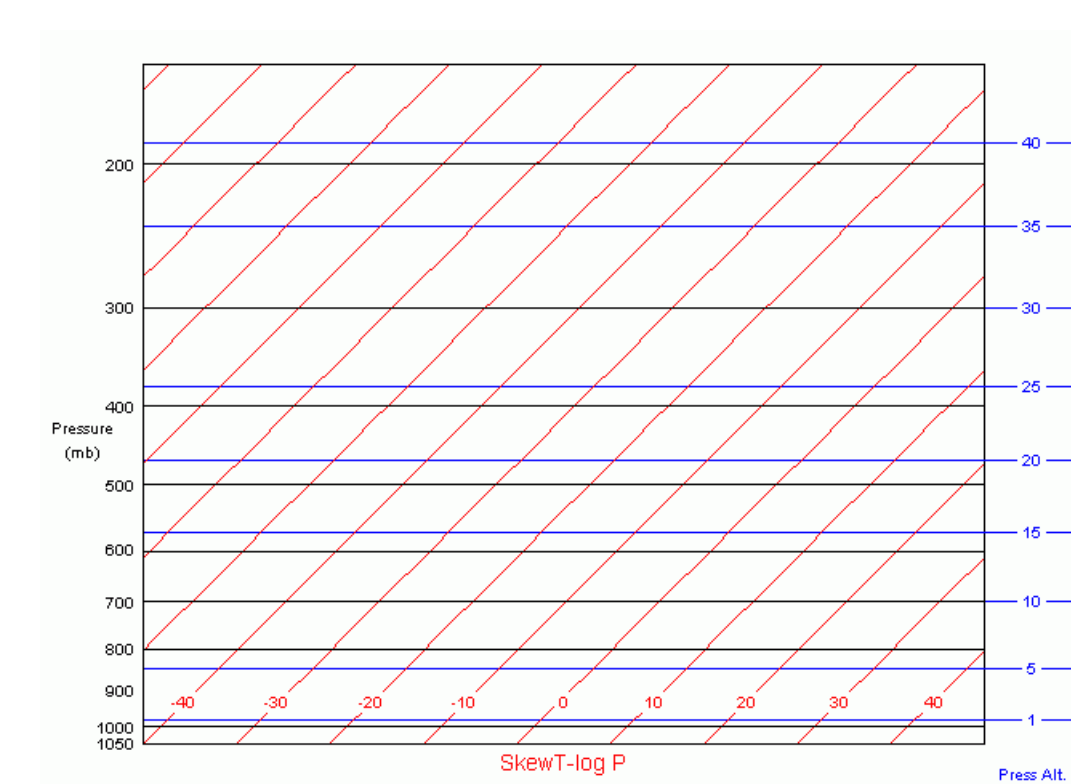
log where
Back to the graph
Adiabats
Saturation mixing ratio
Review
Before jumping into application
full picture
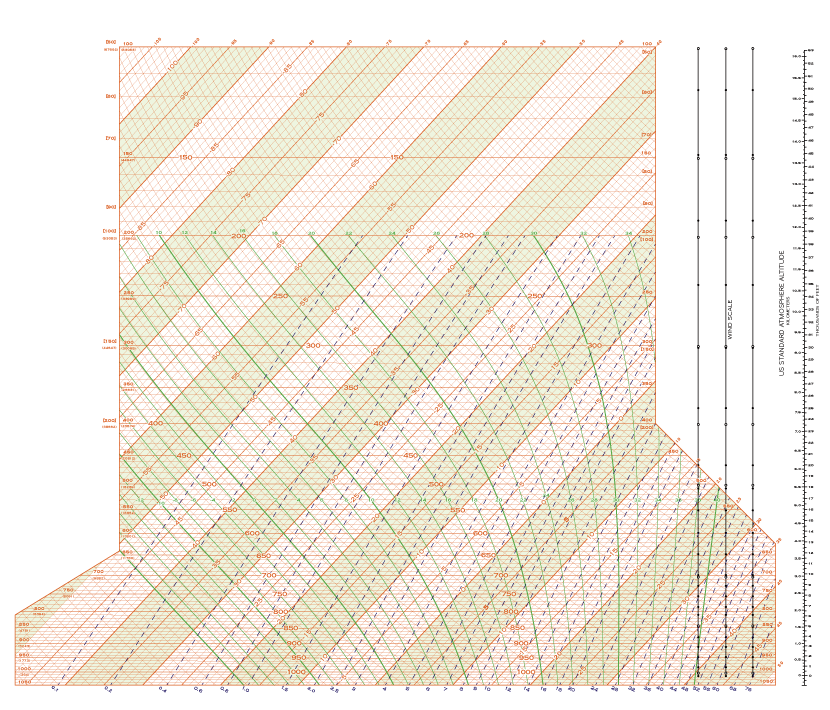
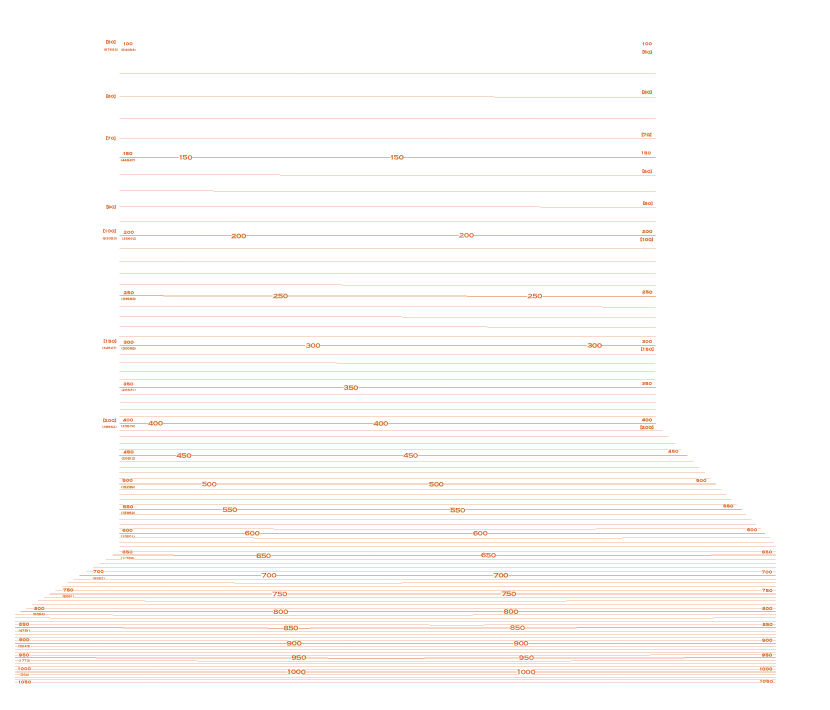
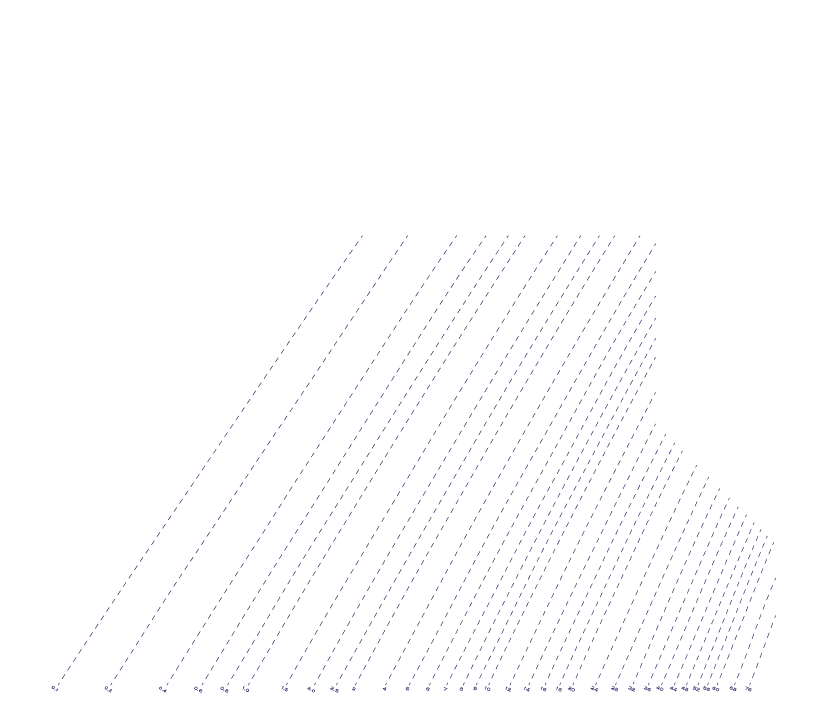
IsoBars
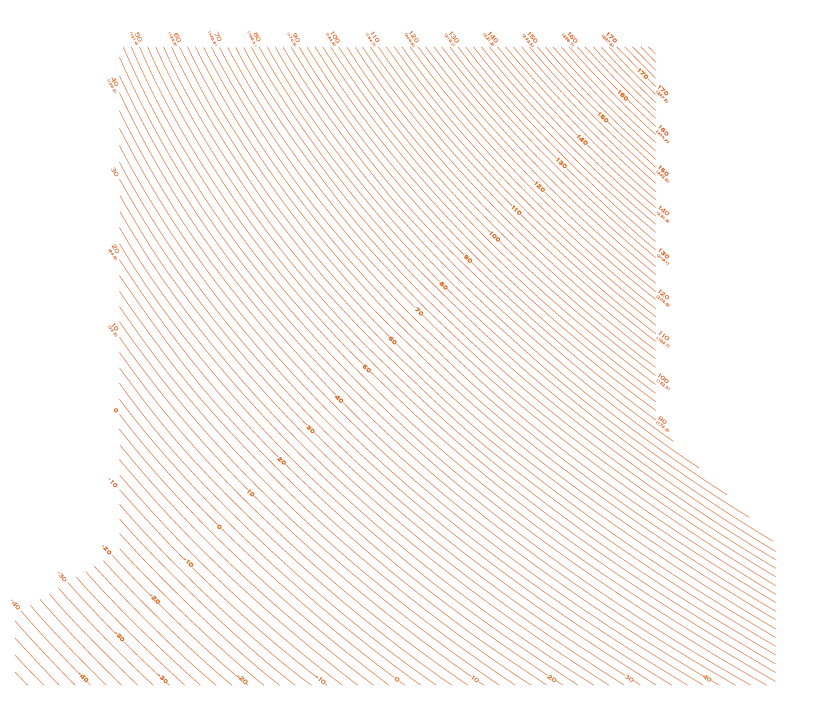
Isotherms
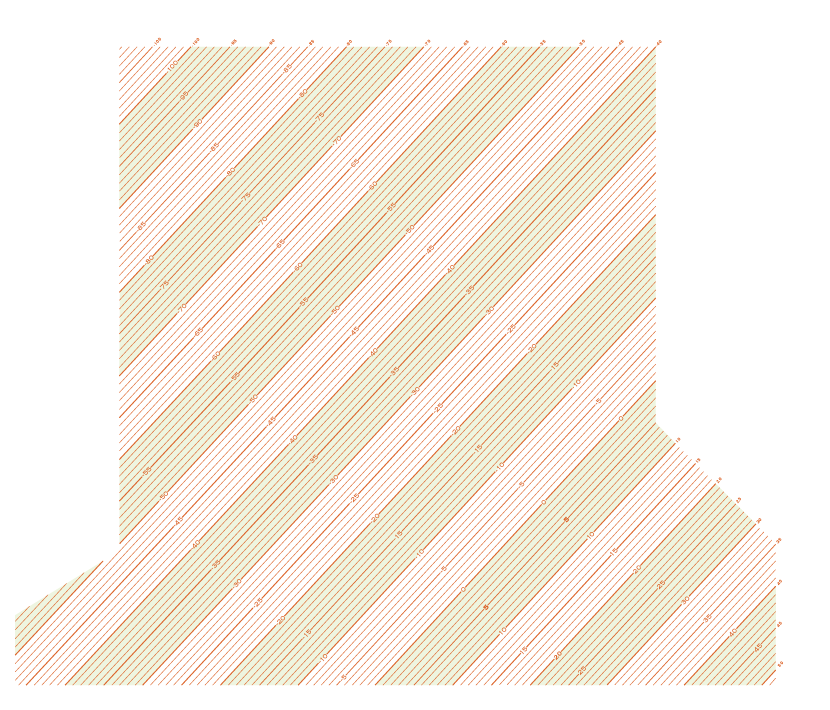
adiabats
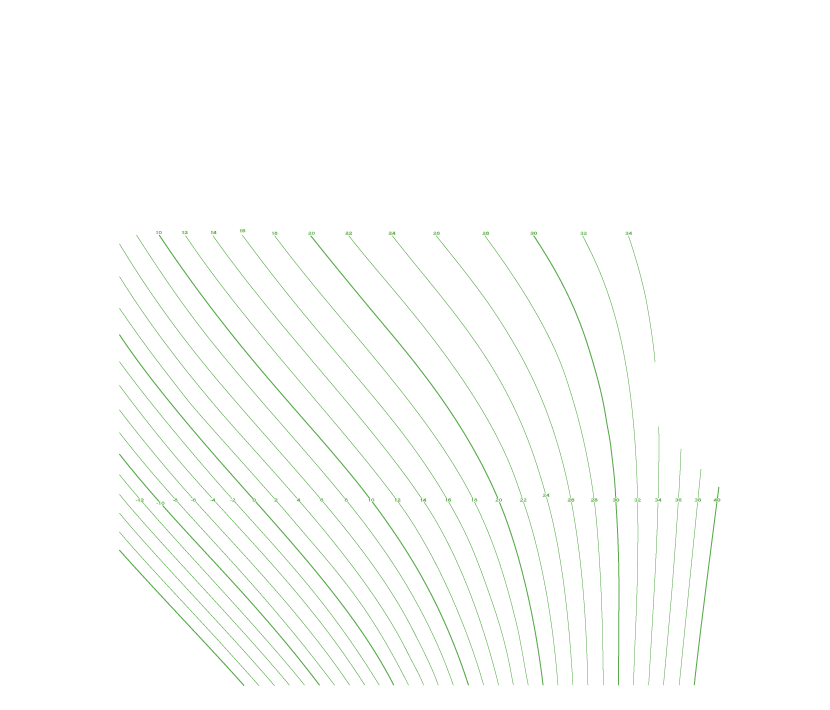
Saturation ratio
Other given info
The rest of the things that make this even more messy
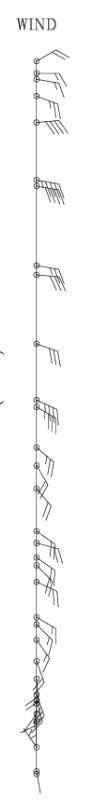
Wind

Dewpoint and temperature
what's\ this
Dewpoint and temperature
what's\ this
The rest of the info
- this is too much.
The rest of the info
- this is too much.
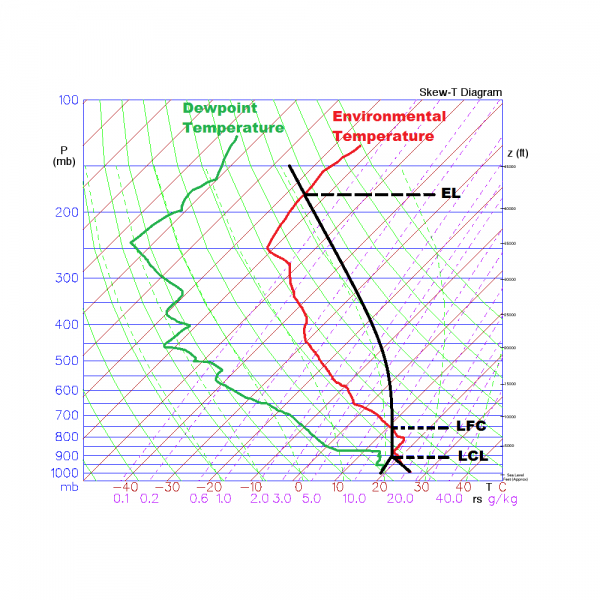
Condensation
that's\ a\ lot\ of\ names!
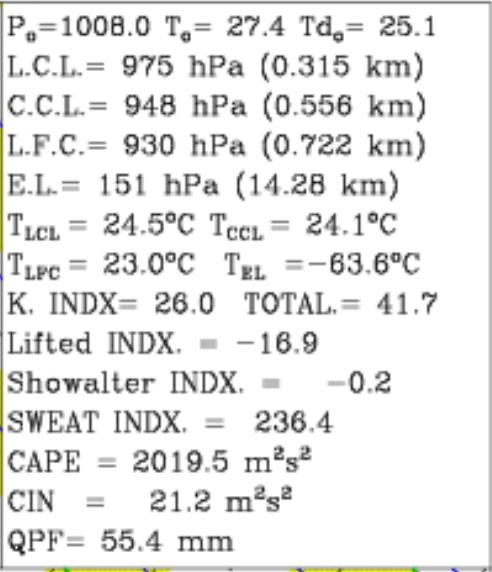
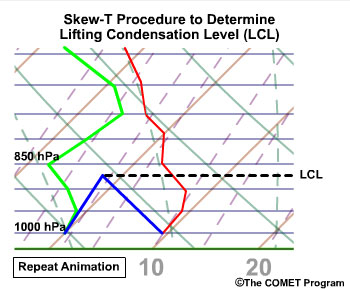
Lifting condensation level
level an air parcel would need to be raised to to become saturated
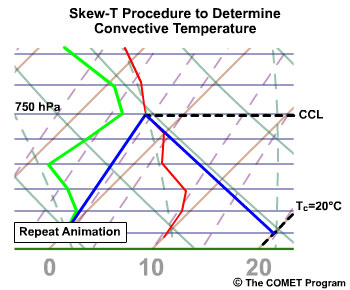
convective condensation level
a parcel, if heated to the “convective temperature,” would freely rise and form a cumulus cloud
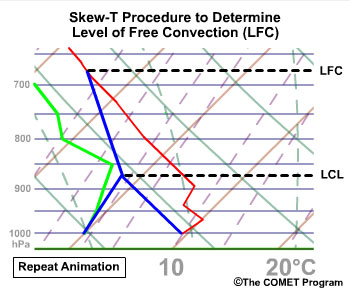
LeVel of free condensation
self-explanatory
Equilibrium level
It's time to stop.
CAPE
Convective Available Potential Energy
V_{max} = \sqrt{2CAPE}
1500,\ 2500
Convective Inhibition
\sout{cout}\ cin
Quantitative precipitation forecast
yes.
INdices
Some other tools to make forecasts
Total totals index
- yes
VT = T_{850 mb} - T_{500 mb}
CT = T_{dew\ 850 mb} - T_{500 mb}
TT = VT + CT
45,\ 50,\ 55(K)
K Index
K = T_{850 mb} + T_{dew\ 850 mb} - T_{500 mb}\\
- (T_{700mb} - T_{dew\ 700 mb})
around 30(K) $$\downarrow$$ less rain possibility
LIFTED Index
LI=T_{500 mb\ env} - T_{500 mb\ parcel}
-3,\ -6,\ -9
Showalter index
- I am not actually sure how this is calculated
SI=T_{500 mb\ env} - T_{850\rightarrow 500 mb\ parcel}
-3,\ -4,\ -6
SWEAT
- Severe WEAther Threat Index
- The fomula is too complicated
- It's meaningless to remember / know at this point
150,\ 300,\ 400
that's the end of introduction
- or is it?
- there are actually plenty more of them
- our brain is going to explode

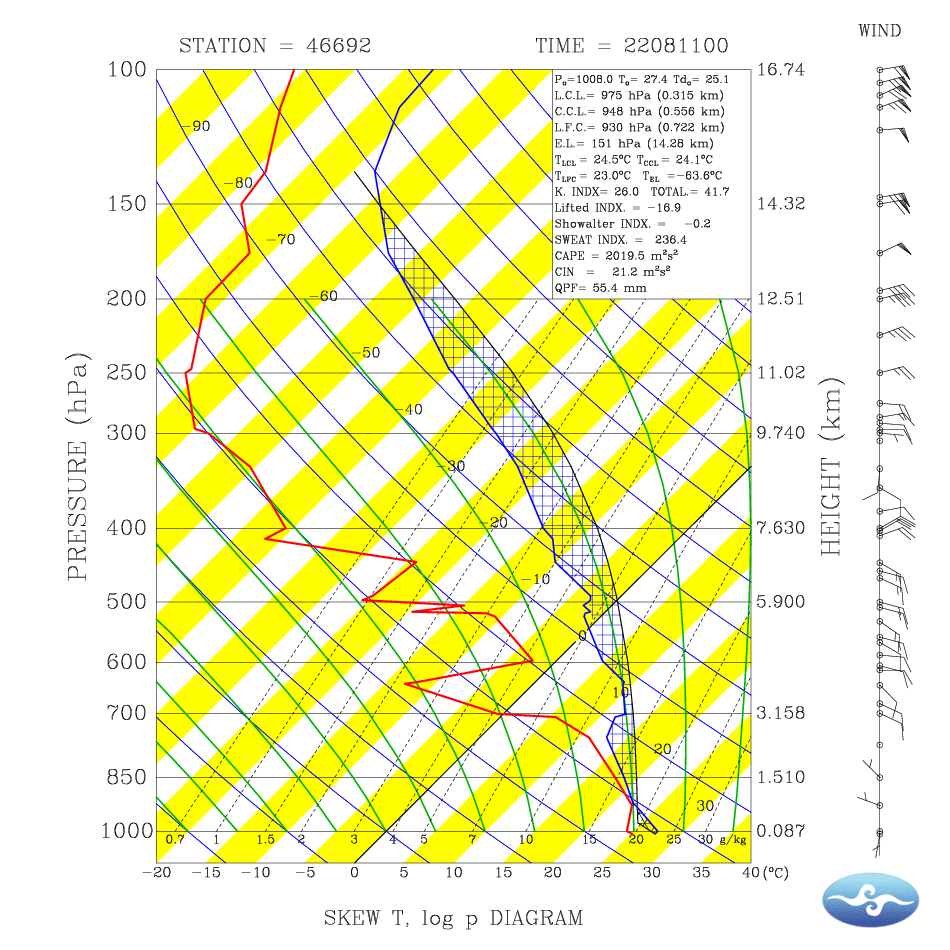
How to use Skew-T
This is an important skill, I suppose.
Use the pre-calculated info
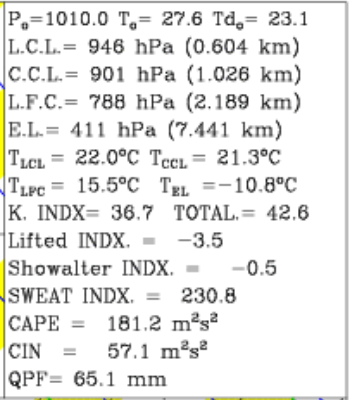
so\ simple!
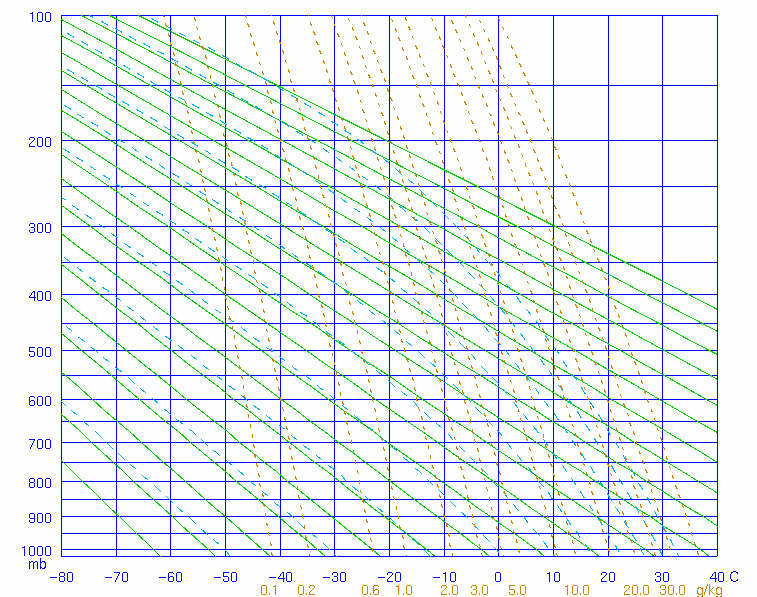
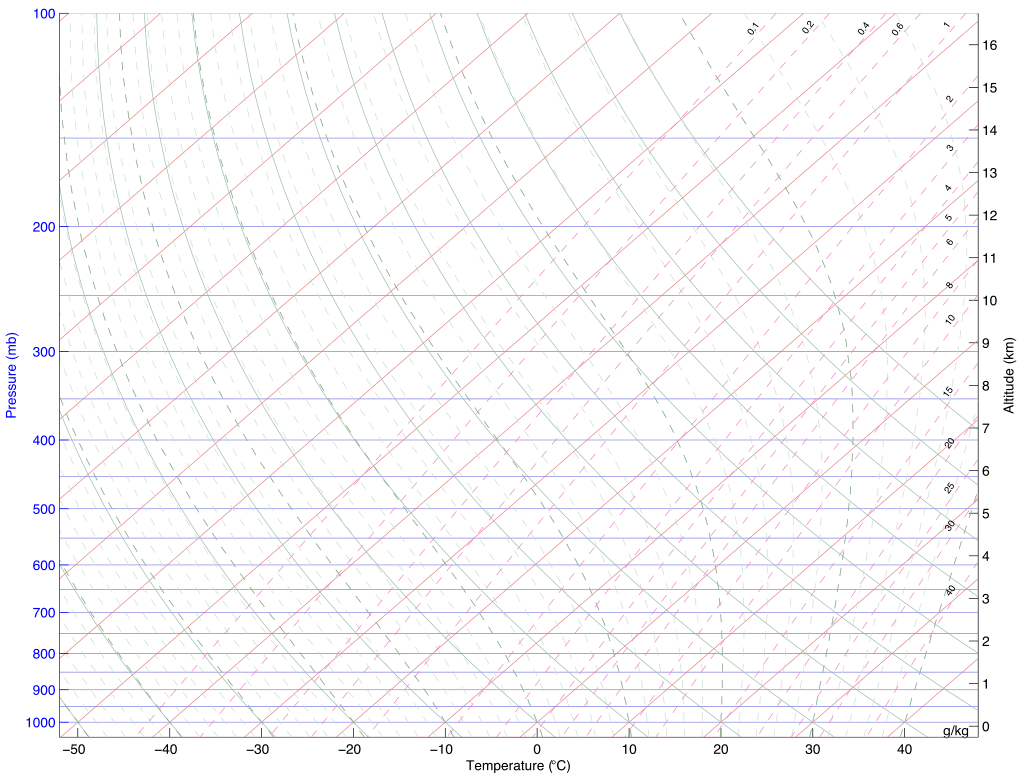
some skew-ts
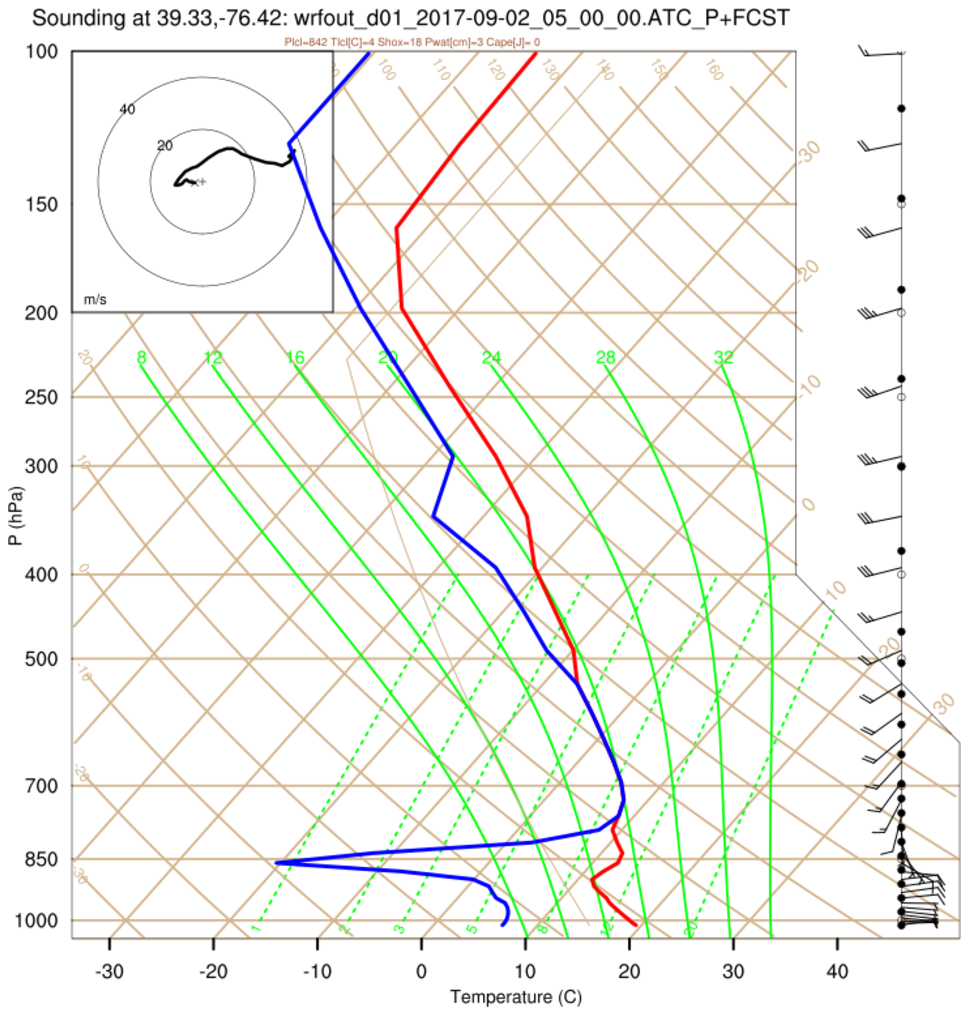
SOME SKEW-TS
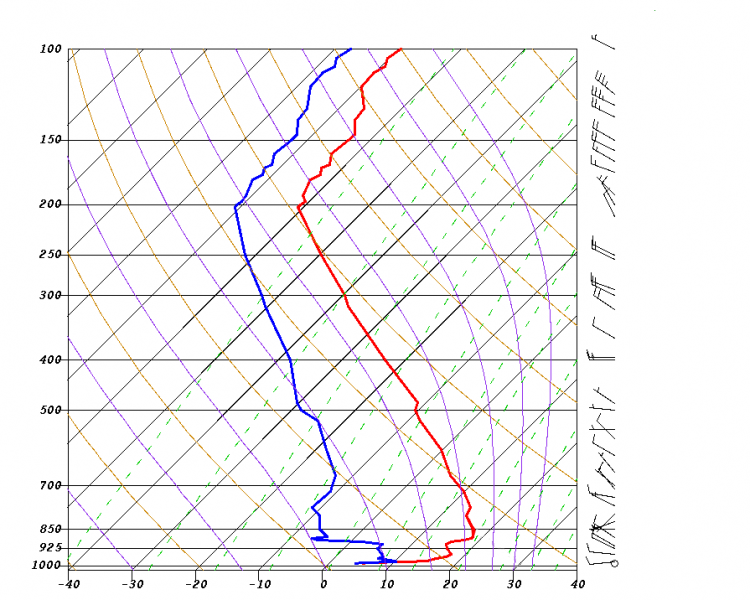
Some Skew-Ts
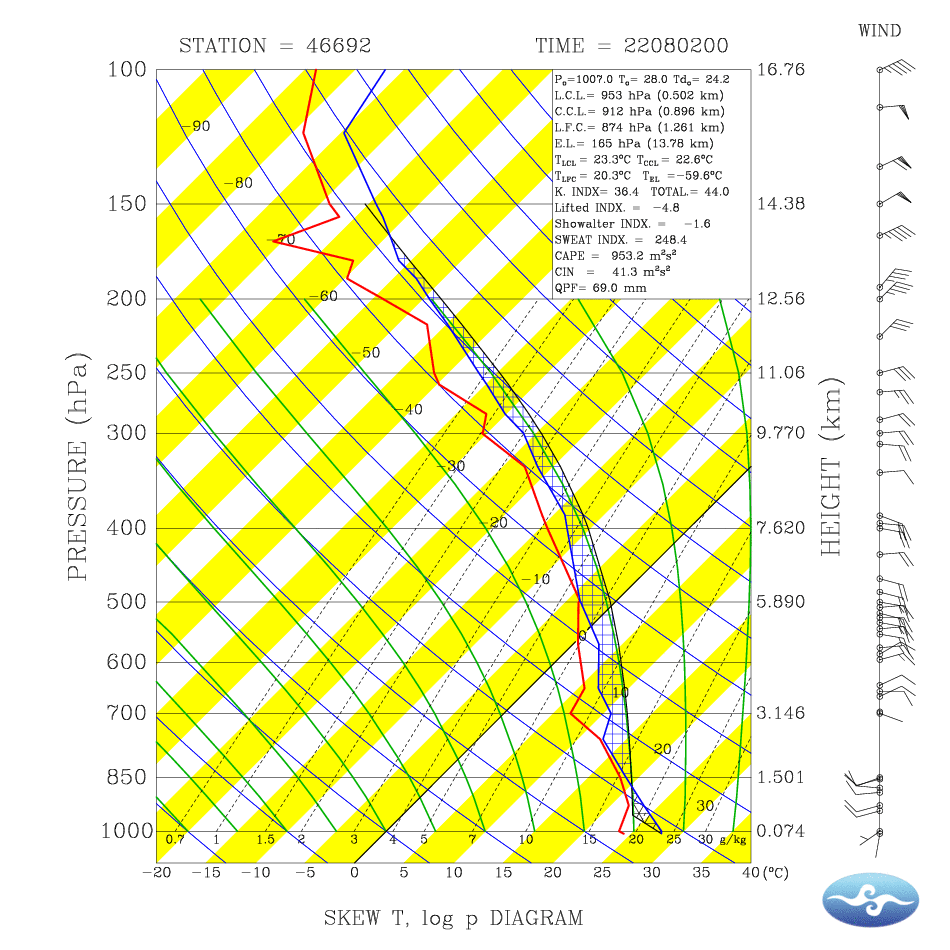
taiwan's skew t
8\ a.m.,\ 8\ p.m.
0:00\ UTC,\ 12:00\ UTC
That's IT
Thank you for listening.