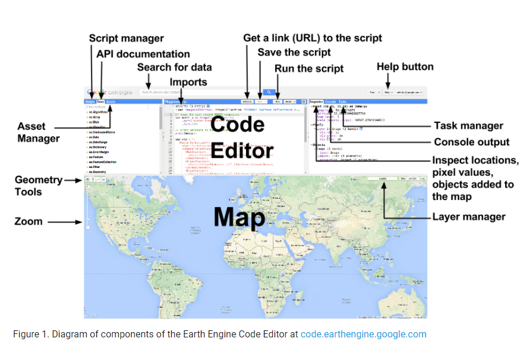
Google Earth Engine
Getting Started
- Render Sentinel 2 imagery
- Define region of interest (ROI)
- Create a cloudless orthomosaic
- Export an image
- import a different image to your project
- add legend
- share with the world as an app
What is Google Earth Engine?
- Computing platform and runs in your internet browser
- with a code editor,
- offers a compiler that runs in the Google cloud,
- hosts data on Google servers.
- Integrated Development Environment (IDE)
Google Earth Engine is a
Data Repository (data as a service)
Software as a Service (SaaS)
Platform as a service (PaaS)
User Interface
Take a look at available data here
Google Earth Engine Data Catalog
https://developers.google.com/earth-engine/datasets
As an example:
sentinel 2 It provides data suitable for assessing state and change of vegetation, soil, and water cover.
https://developers.google.com/earth-engine/datasets/catalog/COPERNICUS_S2_SR_HARMONIZED
Let's Look at the Meta Data (data about the data) together
- Read the description of the dataset.
- who supports this mission/dataset?
- Is this dataset global?
- How many bands are there?
- What are some of the other image properties?
ANSWERS:
- Read the description of the dataset.
- who supports this mission/dataset? -->Copernicus Land Monitoring studies- European Space Agency
- Is this dataset global? -->WARNING: 2017-2018 L2 coverage in the EE collection is not yet global.
- How many bands are there? --> 12 Bands
- What are some of the other image properties?
{JavaScript}
is an interactive front-end scripting language
Comments - explains what code does to the reader but not the compiler
// Displays a map
JavaScript is case sensitive
Statements - individual instruction or steps
statements end with a ;
Variable - tell the system to remember or store data or a value
First Declare a variable
Then assign a value to a variable
{Hello World}
Let's try some simple examples
Add Data and show it on the map
cut and paste this code into your code window
// call a country border vector file to set the region of interest (roi) from datasets - you are welcome to pick a different country.
var countries = ee.FeatureCollection('USDOS/LSIB_SIMPLE/2017');
var roi = countries.filterMetadata('country_na', 'equals', 'Aruba');


////select images only from Jan - the Wet Season in Aruba
var wet_S2_collection = ee.ImageCollection('COPERNICUS/S2_HARMONIZED')
  .filterDate('2025-01-01', '2025-01-31')
  .filterMetadata('CLOUDY_PIXEL_PERCENTAGE', 'less_than', 5);

  //reduce to an image to the median value and clip to area
var wet_S2_mosaic = wet_S2_collection.median().clip(roi);

//call bands from Sentinel 2

var S2_display = {bands: ['B4', 'B3', 'B2'], min: 0, max: 3000};


//render map
Map.addLayer(wet_S2_mosaic, S2_display, "Wet True Color");

//center the map on the roi
Map.centerObject(roi);
What do you see?
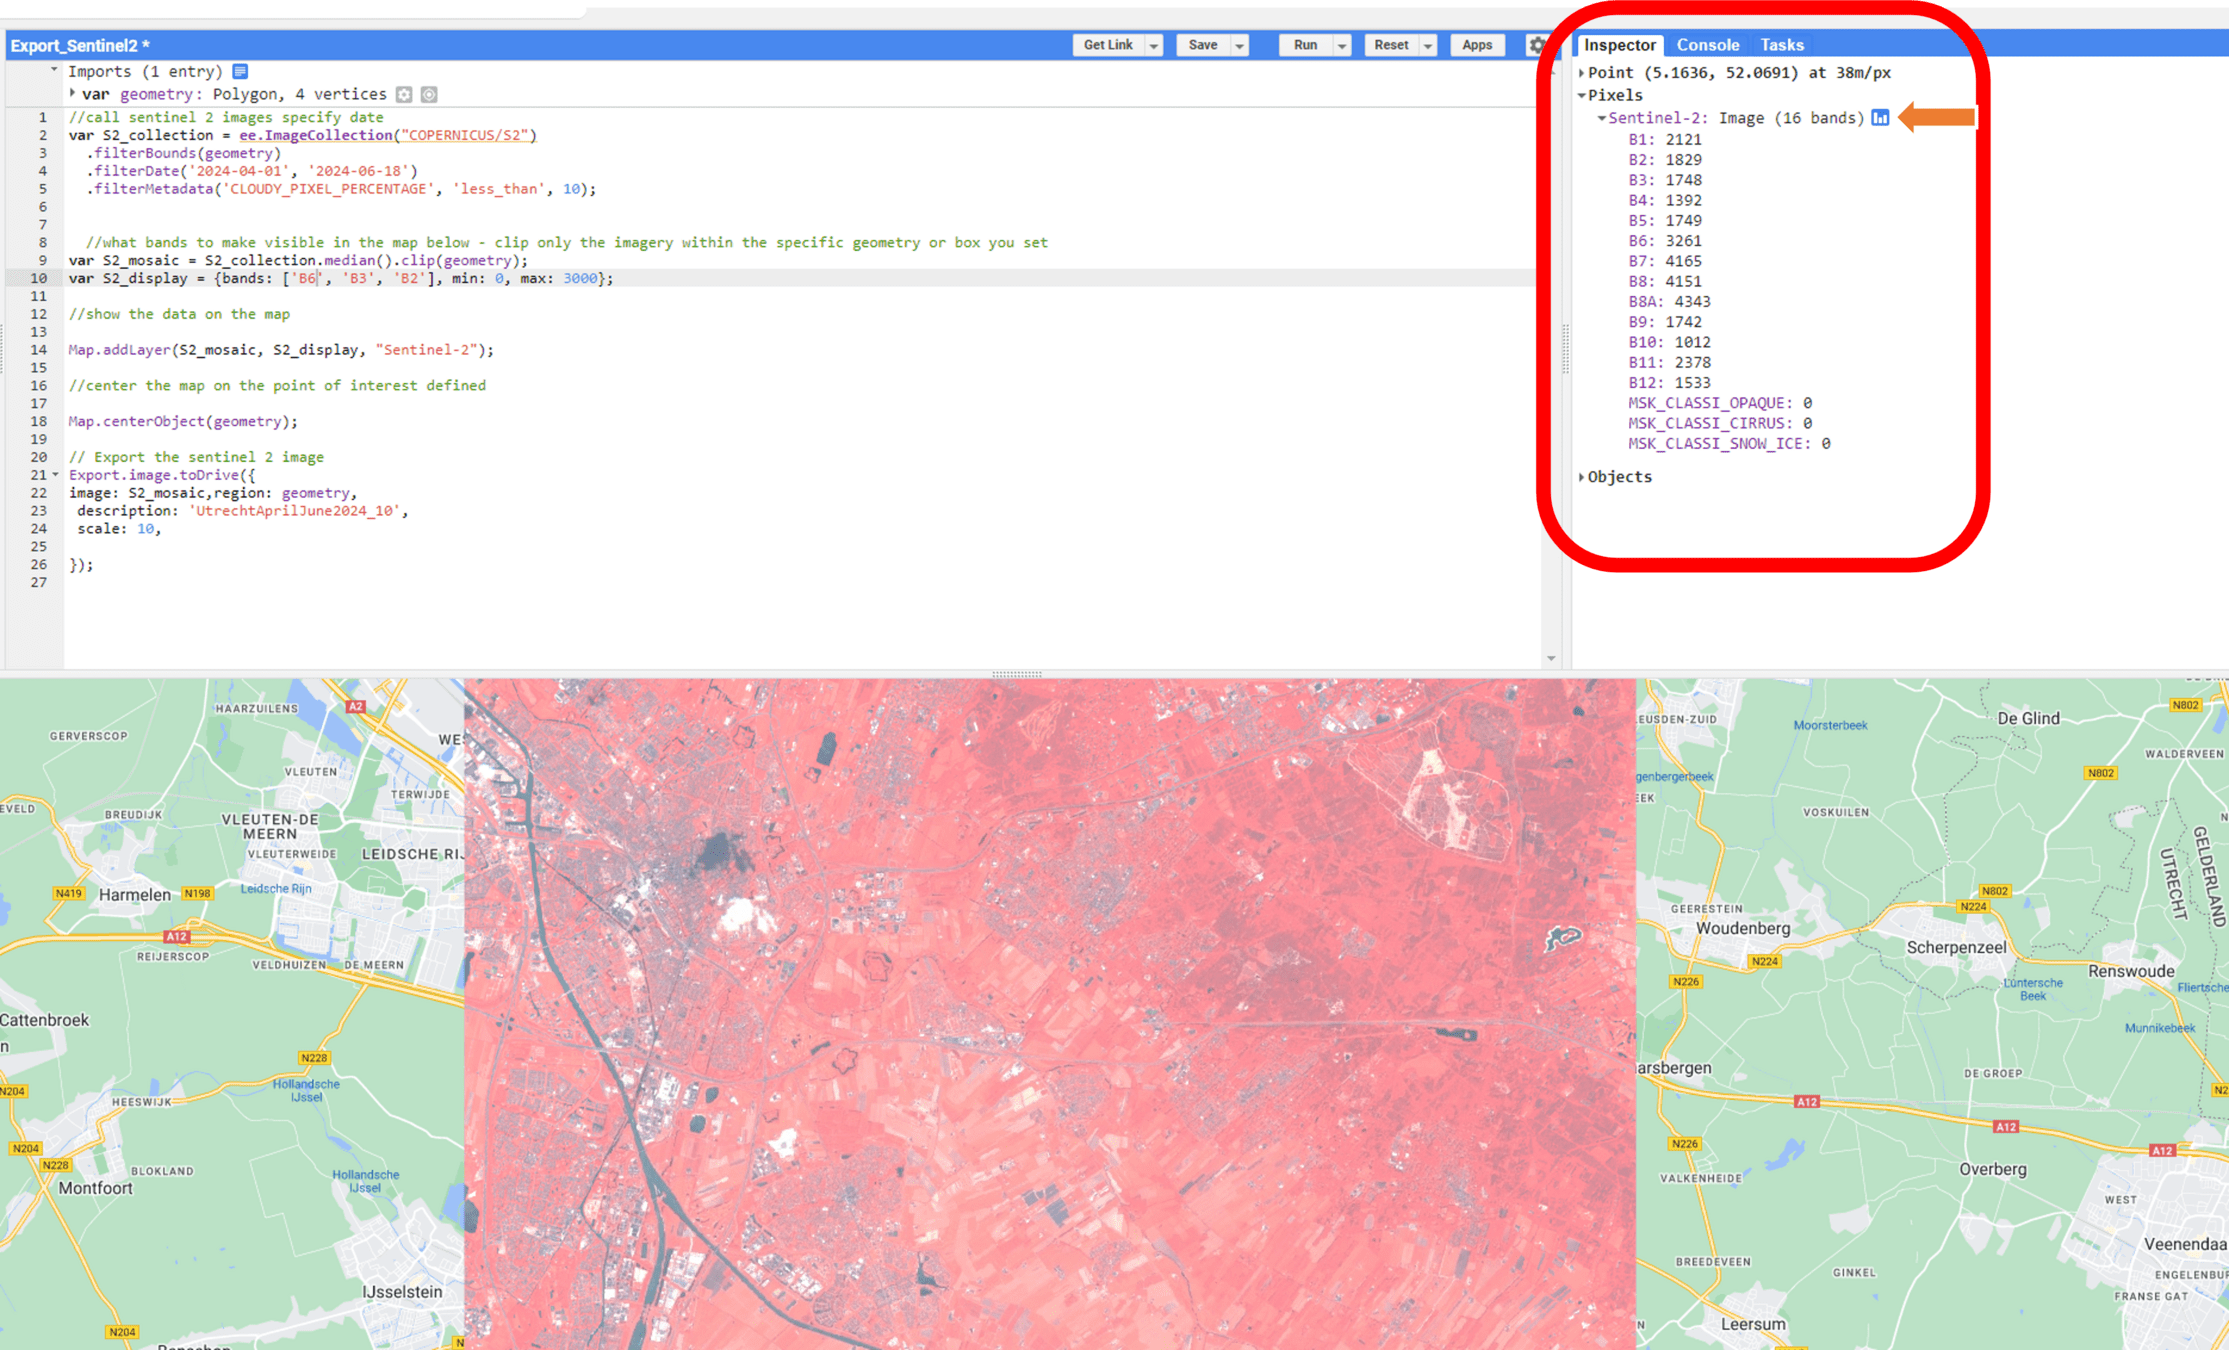
select the Inspector tab on the top right
Then Click anywhere in your map
Notice there is a DN for each band
Example
In this example, it renders the sentinel images for the entire world, for a given date range.
Now let's change
- the date range
- the center of the map - by moving the geometry box
- to save energy - clip to the region of interest set when you manually drew that box
set the geometry manually - draw the box
in the map interface and adjust the transparency - add a line of code and then hit run
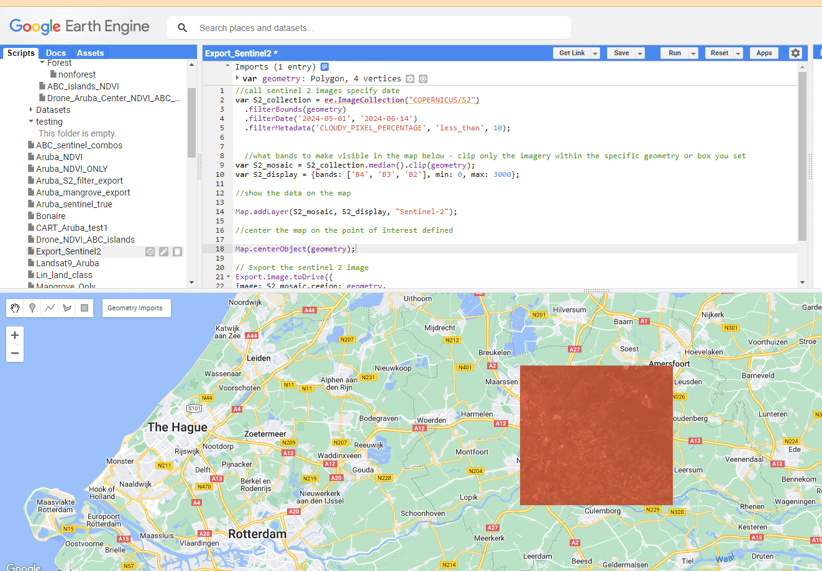
//call sentinel 2 images - specify date and cloudless pixels
////notice that the geometry is not set - no geometry variable yet! You use the square box in the map pane to draw your bounding box and those coordinates will be generated.
var S2_collection = ee.ImageCollection('COPERNICUS/S2_HARMONIZED')
  .filterBounds(geometry)
  .filterDate('2025-05-01', '2025-06-14')
  .filterMetadata('CLOUDY_PIXEL_PERCENTAGE', 'less_than', 10);


 //calculate and select the median value of each cloudless pixel from the above date range and clip to the roi/geometry set

var S2_mosaic = S2_collection.median().clip(geometry);


 //tell which bands to make visible in the map below
var S2_display = {bands: ['B4', 'B3', 'B2'], min: 0, max: 3000};


 //add the following variable to be visible in the map below
Map.addLayer(S2_mosaic, S2_display, "Sentinel-2");

//center the map on the point of interest defined

Map.centerObject(geometry);
Now change some of the parameters
just to explore
change the band combinations
Change the date ranges
export the image mosaic
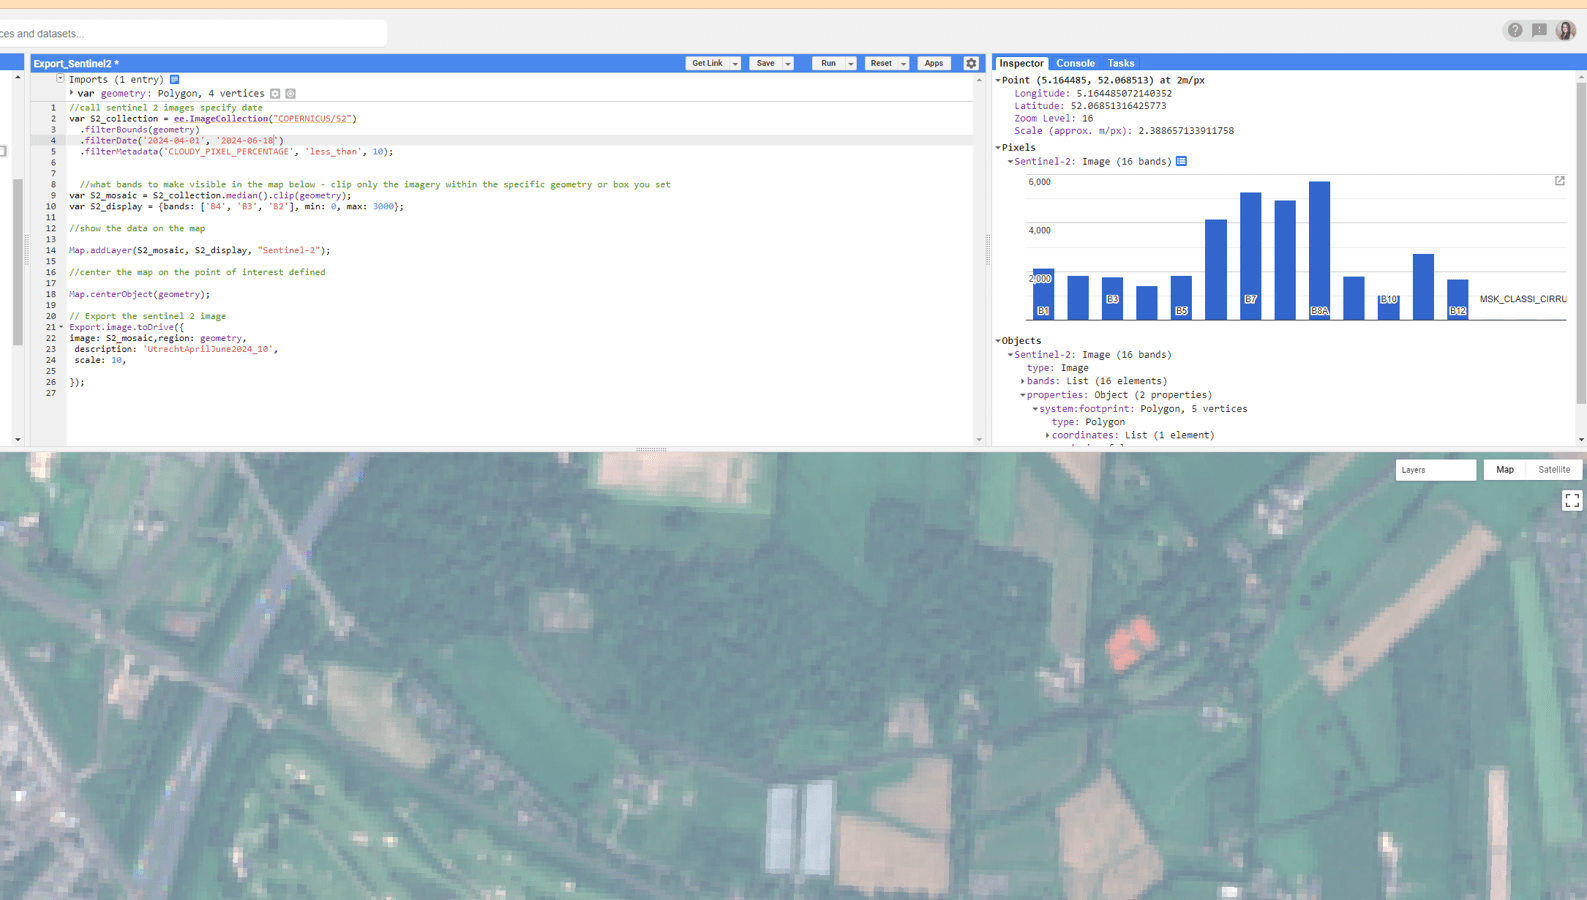
//To export your image add the following code to the bottom of your existing code
// Dont forget to change the name of the file to reflect the region you picked.
Export.image.toDrive({
image: S2_mosaic,region: geometry,
 description: 'Utrecht May-June2025',
 scale: 30,

});Subtitle
var geometry = //set this using the method described with drawing a box or bringing in your own shp file

//call sentinel 2 images specify date
var S2_collection = ee.ImageCollection('COPERNICUS/S2_HARMONIZED')
  .filterBounds(geometry)
  .filterDate('2025-05-01', '2025-06-14')
  .filterMetadata('CLOUDY_PIXEL_PERCENTAGE', 'less_than', 10);


 //calculate and select the median value of each cloudless pixel from the above date range and clip to the roi/geometry set

var S2_mosaic = S2_collection.median().clip(geometry);


 //tell which bands to make visible in the map below
var S2_display = {bands: ['B4', 'B3', 'B2'], min: 0, max: 3000};


 //add the following variable to be visible in the map below
Map.addLayer(S2_mosaic, S2_display, "Sentinel-2");

//center the map on the point of interest defined

Map.centerObject(geometry);

// Export the sentinel 2 image
Export.image.toDrive({
image: S2_mosaic,region: geometry,
 description: 'Utrecht May-June2025',
 scale: 30,

});
I removed geometry variable - set it yourself by drawing a bounding box
- Hit Run to run the code
- Then the Tasks Tab should turn orange
- Click it
- You will see the file name will appear with a button that says Run
- click run to start the export process
- It will be saved to the root directory of your Google Drive (unless you specify otherwise)
To export the image
ArcGIS Pro classification wizard
Now go through the assignment in the word document
answer the questions along the way
AFTER you have classified your image in ArcGIS Pro
Bring your classifed image into GEE
In GEE navigate to Assets-->New-->GeoTiff and select your classified image
may take a few minutes to show up in your assets folder
Then click the arrow to put it in your script
Set the visualization parameters and hit run
make your map interactive
import your final classified image into Google Earth Engine
When you want to put your final class image online
enter this code in Google Earth Engine
//first set the var image: by following directions in the video in the last slide - this code alone will not work without it
//your classified image will have as many classes as you set - mine had six - I used colorbrewer2.org for color advice - make yours better :)
var imageViz = {min: 0, max: 6, palette: ['e41a1c', '377eb8', '4daf4a', '984ea3', 'ff7f00', 'ffff33']};
//call your variable image to render, call variable to stylize it, set the visible layer name, and true to render it
Map.addLayer(image, imageViz, 'classes', true);
//tell map to center on your classified image
Map.centerObject(image);
what is missing?
A Legend! Here is the code to add one. Read comments carefully so you can replace my colors and classes with your own.
//your classified image will have as many classes as you set - mine had six - I used colorbrewer2.org for color advice - make yours better :)

var imageViz = {min: 0, max: 6, palette: ['e41a1c', '377eb8', '4daf4a', '984ea3', 'ff7f00', 'ffff33']};

//call your variable image to render, call variable to stylize it, set the visible layer name, and true to render it

Map.addLayer(image, imageViz, 'classes', true);
//tell map to center on your classified image
Map.centerObject(image);

//now add a legend
// set position of panel of the legend
var legend = ui.Panel({
  style: {
    position: 'bottom-left',
    padding: '8px 15px'
  }
});

// Create legend title
var legendTitle = ui.Label({
  value: 'Land class Legend',
  style: {
    fontWeight: 'bold',
    fontSize: '18px',
    margin: '0 0 4px 0',
    padding: '0'
    }
});

// Add the title to the panel
legend.add(legendTitle);

// Creates and styles 1 row of the legend.
var makeRow = function(color, name) {

      // Create the label that is actually the colored box.
      var colorBox = ui.Label({
        style: {
          backgroundColor: '#' + color,
          // Use padding to give the box height and width.
          padding: '8px',
          margin: '0 0 4px 0'
        }
      });

      // Create the label filled with the description text.
      var description = ui.Label({
        value: name,
        style: {margin: '0 0 4px 6px'}
      });

      // return the panel
      return ui.Panel({
        widgets: [colorBox, description],
        layout: ui.Panel.Layout.Flow('horizontal')
      });
};

//  Palette needs to match your map - copy and paste the colors you used above
var palette =['e41a1c', '377eb8', '4daf4a', '984ea3', 'ff7f00', 'ffff33'];

// name of the legend need to match your classes
var names = ['urban','rural','water','agriculture','semi-urban','other'];

// Add color and and names change the number 6 to how many classes you have
for (var i = 0; i < 6; i++) {
  legend.add(makeRow(palette[i], names[i]));
  }

// add legend to map (alternatively you can also print the legend to the console)
Map.add(legend);
Alternatively - do the whole assignment in Google Earth Engine
// Load a Landsat composite for input.
var input = ee.ImageCollection('LANDSAT/COMPOSITES/C02/T1_L2_32DAY')
  .filterDate('2001-05', '2001-06')
  .first()
  .clip(geometry);


Map.centerObject(geometry);
Map.addLayer(ee.Image().paint(geometry, 0, 2), {}, 'region');

// Make the training dataset.
var training = input.sample({
  region: geometry,
  scale: 30,
  numPixels: 5000
});

// Instantiate the clusterer and train it.
var clusterer = ee.Clusterer.wekaKMeans(15).train(training);

// Cluster the input using the trained clusterer.
var result = input.cluster(clusterer);

// Display the clusters with random colors.
Map.addLayer(result.randomVisualizer(), {}, 'clusters');
for Sentinel 2 see this good tutorial