Interactive "Ibry" + MetroNorth
+ framework for self learning dataviz
Cameron Yick
DVS NYC Chapter - June 2019 Edition


Outline
1. Motivation:
Why build Ibry (Marey) Charts of MetroNorth Data?
2. Process:
A Prioritization Framework for Side Learning Projects
3. Demo (🚂)
4. RECAP (Slides will be shared)
-
🏊♂️ Swimmer
- Season Progress
- Splits, fatigue rate, DPS, SPS
-
⚡️ Studying Electrical Engineering
- Signal processing/ brain data (MATLAB)
-
🧠 Studying Cognitive Science / Design
- Visual perception
- Motivation (game design, menus, playgrounds)
-
🕵️♂️ Data Engineer / Analyst
- Data quality (esp "public data") over time
-
📊 Software Engineer for Data Visualization Product
- Reusability/Performance (Interactivity / Density)
- Exploratory vs Tactical/Operational Tooling
My Visualization Past
#location-nyc

Data collected / analyzed / visualized by Stephanie Coker
Outline
1. Motivation:
Why build Ibry Charts of MetroNorth Data?
2. Process:
A Prioritization Framework for Side Learning Projects
3. Demo
4. Recap

E.J. Marey's rendition (Concept by Charles Ibry)

1847 Traffic Engineering: Constructing, not just displaying
(via Sandra Rendgren's Post)


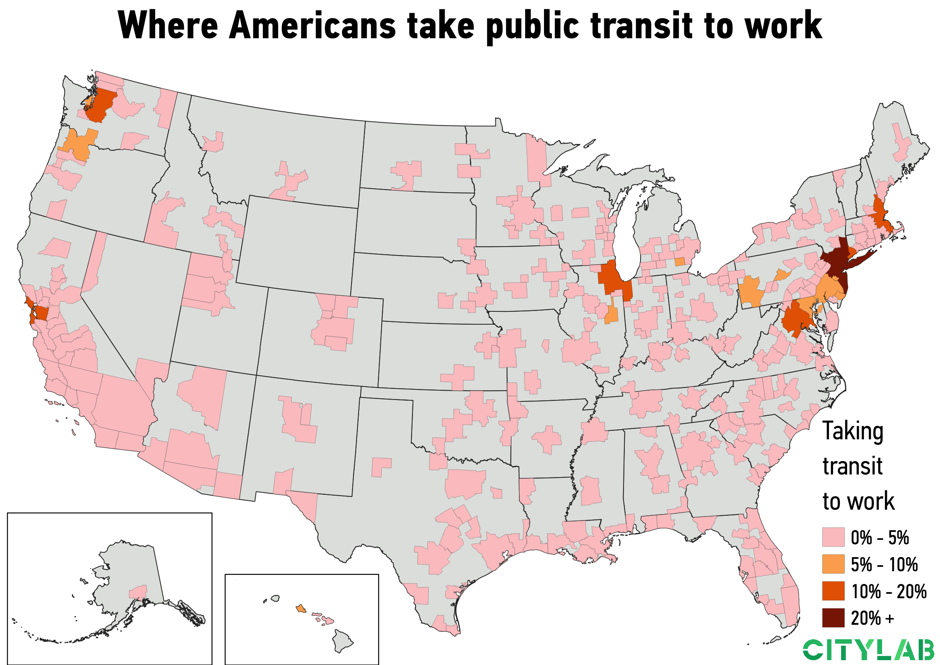
MetroNorth enables 2 of the top 7!
2017 U.S. Census American Community Survey
Karen King's CityLab Analysis
Graph via Vega-Lite Editor
Just 7 US Metros where 10%+ workers take public transit to work.
Existing Train Tables
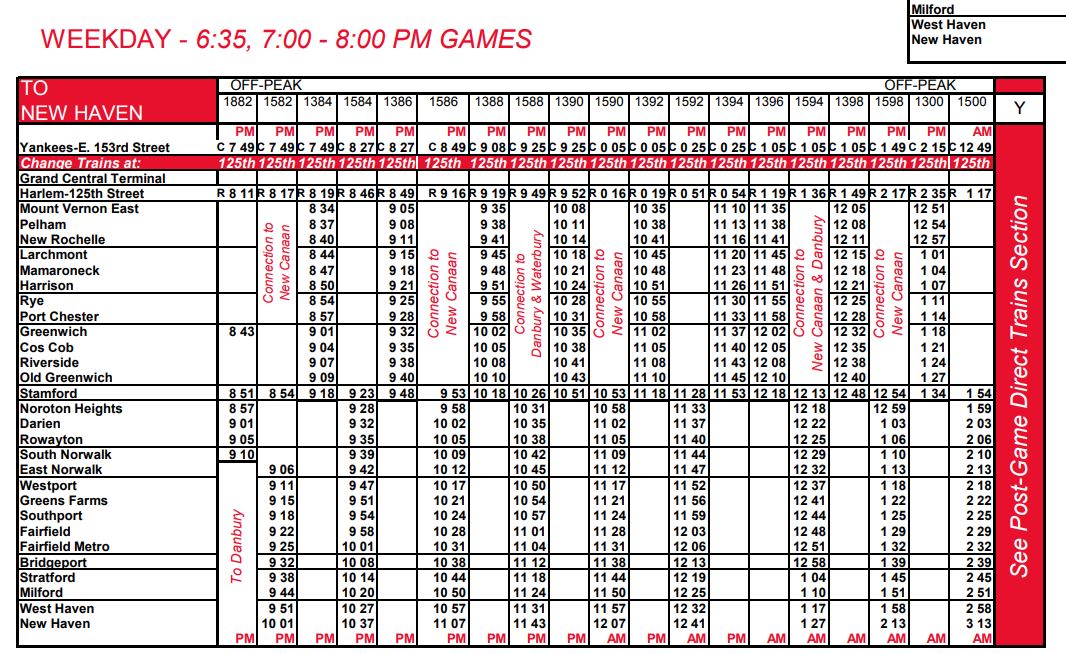
(See Physical Handouts)
Checkpoint
1. Motivation:
Why Build an Ibry Chart of MetroNorth Transit Data?
2. Process:
My Prioritization Framework for Side Learning Projects
3. Demo
4. Recap
Why Sharing Learning Approaches Matters in Data Visualization
Many (most?) practitioners are self taught!


Data: github.com/data-visualization-society/data_visualization_survey
Survey by Elijah Meeks, data rendered in Tableau
Cathy O'Neil - most important lesson in data science


How can we keep people in the room?
Obstacles To Self Directed Learning
- Common fears
- What if the result is bad?
- What if I waste time?
- Overwhelmed by possibilities
- Can happen at start, in the middle...
- 🐰 Rabbit Holes
Taming Rabbit Holes
- Tutorial blog post you started with
- Javascript / Python Syntax Cheatsheet
- StackOverflow Answers
- Links from Slack
- Pudding / 538 / NYT / Kantar IIB Awards
- Property "x" does not exist
- Github issues open since 2015
- undefined is not a function
- New charting library
- What is this React thing?
- Property "y" is not a date
- etc...


Make it run,
Make it right,
Make it fast.


- Kent Beck (Software Engineer)
Skipping Steps?
Who needs "first drafts" / "validation"?
Agile - not just for work

- Sandi Metz (Rubyist)
- Purpose of design is to enable doing design later
- Goal of design is to reduce the cost of change
Design and Code Quality Extras
- Uncle Bob (Robert Martin) - "Clean Architecture"
- Enable defer architectural choice as late as possible
- You'll have more information later, which will help with making better decisions
Over time- drafts get cleaner, but the ceiling moves
Design and Code Quality Extras
Overcoming Obstacles with Remakes
-
Common fears
- What if the result is bad?
- What if I waste time?
-
Overwhelmed by possibilities
- Can happen at start, in the middle...
- 🐰 Rabbit Holes
You already like the idea
The mantra gives you milestones
You're guaranteed to learn
Making it (run|right|fast) in practice
Make it Run: Overview
- Find existing code
- Find your own data
- Adapt (2) to fit (1) (or vice versa)
Goal:
Decide quickly if spending more time is worth it!
Making it Run - Find Code + Test Drive

Google, Slack, Pinterest, Blockbuilder-Search (Links Below)
Prior Art - Code
-
San Francisco - Mike Bostock
-
MBTA (Massachusetts) - Twitter Viz
-
Explore variety of transit data
-
-
Metra (Chicago) - Nicholas Rougeux
-
Examine impact of removing some lines
-
Prior Art - History
- Tufte Bulletin on Graphical Timetables
- Sanda Rendgren - From Paris with Love (1845)
- Charles Ibry Chart not Marey Chart
- (Rename project?)
- (h/t Jason Forrest)
Prior Art - Usecases
- Singapore Open Data - Catching a Rogue Train
-
Analyzing the Flow of Work with Marey Charts (Agile)
- Reading patterns
- Attend to slope of line
- Attend to what lines are in parallel
- Attend to whether segments overall line up
- Reading patterns
- TrainVis Student Final Project
Make it Run: Data
- Finding MTA data
- 26 Hours in a day
- Data Enrichment/parsing/cleaning
- Vincenty Distance (non spherical)
- Precompute Slopes
- Jupyter Notebook for Route 3 - Link (pre-open)
- Python environment to mix code + docs

MTA Data - 10 TXT Files

Data Quality with Missingno


Vincenty Distance Data Quality Check

- 1 Giant file

(historical re-enactment w/ 2019 data)
Speedbumps
- Where to parametrize?
- Showed coworker different line
- Hardcoded separate file
- Magic numbers
- Global variables
- CPU fan working hard 🚀
- Visual Noise
- Updating the DOM was verbose/tricky
It Runs - We're Done? 🏁
- MVP January 2018 (D3 V4)
- Unsure about next steps
- Filtering
- Changing source
- (Data-view relationship)
- Skills / Goals Gap
- Unsure about next steps
- Plan
- Bridge gap, then return
- OR wait for a need
The Return: Making it "Right"
- Revisited April 2019
- What Changed?
- New tools (React/Redux/Typescript/Parcel)
- Motivated by "run" problems
- Copied other things
- Practiced teaching (writing/in person)
- DVS #historical-viz / #location-nyc
- New tools (React/Redux/Typescript/Parcel)
Making it "Right" - 2 Hats
- Design
- Chasing a moving target


- Technical
- It already "runs"
- Enabling Change
- Wrangling State (Power Cycle)
Defining "Right"
- Reusability with React
- Declarative / Modular
- Contain state
- Safety with Typescript / Redux Dataflow
- Smart Spellcheck + Complete (demo)
- Visualizations Enabling Visualization
- Time Travel
- Livecode Debugging
- Fast Feedback!
Evolution (Sessions)
- Starting: Pure HTML / JS / D3, with Prepros to bundle
- Prepros out, parcel in Parcel
- Breakup large file into reusable functions
- Commit to react, replace Parcel with CRA
- Add "rescripts" for HMR (demo)
- Incremental SVG -> Canvas with Konva
- (Managed positioning bugs)
- Redux in a single file (copy from prev app)
- Add Rewired-typescript to type reducer/actions
- Use reselect
- Rewrite reducer with typesafe-actions
- React-hooks / redux hooks (released last month)
- Future - web workers, gatsby, svelte, elm?
Defining Right
- Where do trains usually bunch up?
- How many trains is the MTA managing right now? (Empathy)
- Assess options to get from (A,B,C) to (F)
...
Too many trains to visualize all at once! (Common Q)
Future: commuter (me) vs Train Engineer
Picking Features
Fun to make
Useful to have
Error handling
Login form
Xenographics*
Exit animations*
👌
(not to scale)
"Sweet Spot"
Gradients*
Date parsing
Selected Features
- Data source toggle
- IBM Carbon
- Widen Audience
- Station Filter
-
Redux + Typescript
- typesafe-actions
- Reduce noise
-
Redux + Typescript
- Time Filter (Brush)
-
Integrating d3-brush with React
- @vx/brush (framework pivot)
- Direct Manipulation (Schneiderman)
-
Integrating d3-brush with React

- Fun
- Useful
Make it Fast (Optional 🐰!)
- (No extra work) - React Fiber Updates
- Caching in Redux with Reselect
- "Recently Visited" Shelf @ Library
- SVG + Canvas Together
- SVG for axes
- Canvas for workhorse elements
- React-Konva
- Future
- Optimize data structures (~50k stops)
- Web workers
- (Very easy to get distracted with optimizations)
- Talk to me later for details!
Outline
1. Motivation:
Why Build a Marey Chart of MetroNorth Transit Data?
2. Process:
A Prioritization Framework for Side Learning Projects
3. Demo
- Filters, Brushing, HMR, Devtools, Time-Travel
4. Recap
Checkpoint
1. Motivation:
Why Build a Marey Chart of MetroNorth Transit Data?
2. Process:
A Prioritization Framework for Side Learning Projects
3. Demo
- Filters, Brushing, HMR, Devtools, Time-Travel
4. Next Steps / Recap
Next Steps
- Pull requests welcome!
- Sync state to URL (make settings shareable)
- Mobile friendly / responsive
- Investigate late night data issues
- Filter trips by direction
- Replace Jupyter pipeline
- Layer in true "lateness" data
Next Steps
-
UI overhaul
- Thoughtful control panel
- "Admin" visual variables / canvas size
-
Tooltips
- MVP: onClick to console
- Fare, track #, pricing zone
- Marginal plots (trip count per time instant)
- Express vs semi-express vs local trips
- Animation / transitions
Takeaways
1. Motivation: Remake classics with modern data
- "Ibry Charts" reveal patterns tables don't
- MetroNorth train schedules affect millions
2. Process: This works for me, YMMV
- Frameworks help manage 🐰 holes + keep you sane!
- Make it run, make it right, make it fast (use both hats)
3. Demo:
- Try it / share with a fellow commuter!
- Try it on other movement data (races, agile, progress, etc)
Interactive "Ibry" Charts / Structuring Self-Learning
Twitter / Github: @hydrosquall
Blog: serendipidata.com (Writeup coming soon)
Thanks!