Interactive "Ibry" + MetroNorth

+  framework for self learning dataviz


Cameron Yick

DVS NYC Chapter - June 2019 Edition


Outline

1. Motivation:

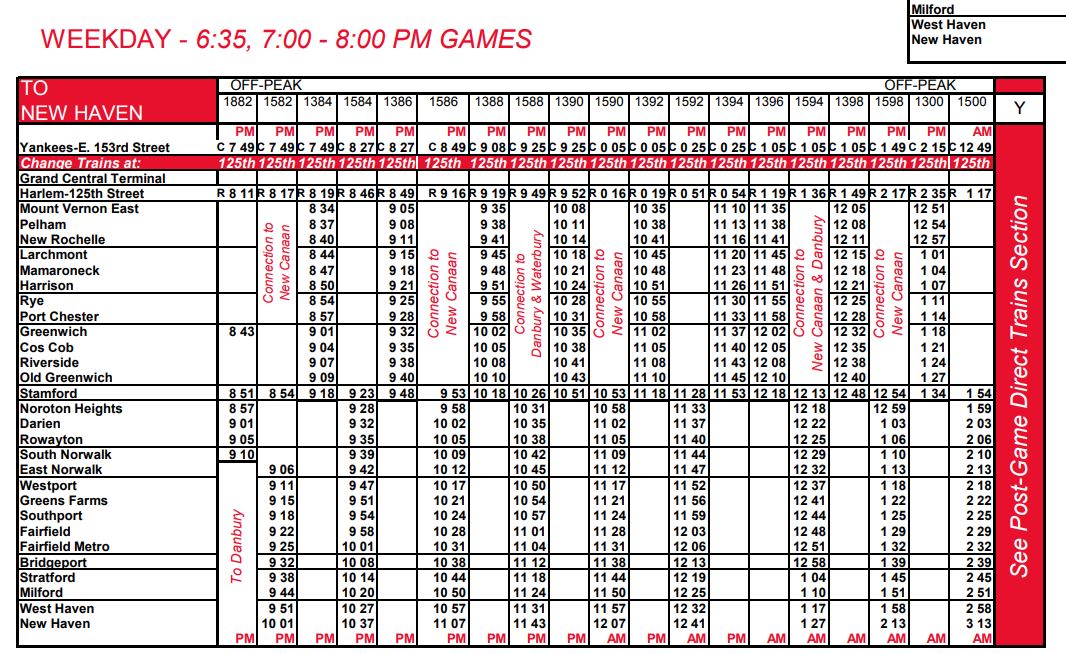
     Why build Ibry (Marey) Charts of MetroNorth Data?


2. Process:

     A Prioritization Framework for Side Learning Projects


3. Demo (🚂)


4. RECAP (Slides will be shared)

  • 🏊‍♂️ Swimmer
    • Season Progress
    • Splits, fatigue rate, DPS, SPS
  • ⚡️ Studying Electrical Engineering
    • Signal processing/ brain data (MATLAB)
  • 🧠 Studying Cognitive Science / Design
    • Visual perception
    • Motivation (game design, menus, playgrounds)
  • 🕵️‍♂️ Data Engineer / Analyst
    • Data quality (esp "public data") over time
  •  📊 Software Engineer for Data Visualization Product
    • Reusability/Performance (Interactivity / Density)
    • Exploratory vs Tactical/Operational Tooling

My Visualization Past

#location-nyc

Data collected / analyzed / visualized by Stephanie Coker

Outline

1. Motivation:

     Why build Ibry Charts of MetroNorth Data?

2. Process:

     A Prioritization Framework for Side Learning Projects

3. Demo

4. Recap

E.J. Marey's rendition (Concept by Charles Ibry)

1847 Traffic Engineering: Constructing, not just displaying

(via Sandra Rendgren's Post)

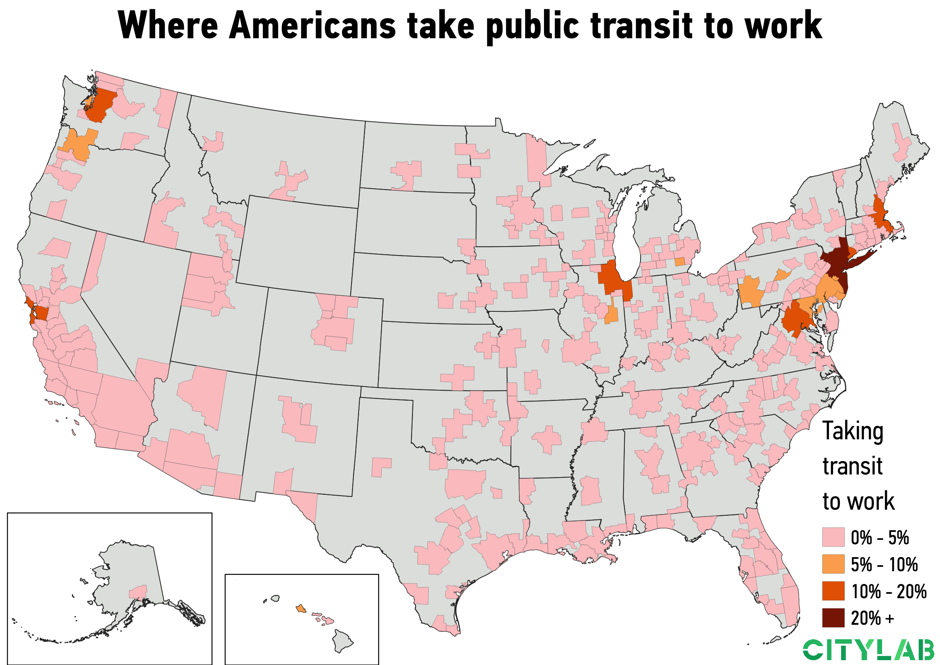
MetroNorth enables 2 of the top 7!


2017 U.S. Census American Community Survey

Karen King's CityLab Analysis

Graph via Vega-Lite Editor

Just 7 US Metros where 10%+ workers take public transit to work.

Existing Train Tables

(See Physical Handouts)

Checkpoint

1. Motivation:

     Why Build an Ibry Chart of MetroNorth Transit Data?

2. Process:

     My Prioritization Framework for Side Learning Projects

3. Demo

4. Recap

Why Sharing Learning Approaches Matters in Data Visualization

Many (most?) practitioners are self taught!


Data: github.com/data-visualization-society/data_visualization_survey

Survey by Elijah Meeks, data rendered in Tableau

Cathy O'Neil - most important lesson in data science

How can we keep people in the room?

Obstacles To Self Directed Learning


  • Common fears
    • What if the result is bad?
    • What if I waste time?
  • Overwhelmed by possibilities
    • Can happen at start, in the middle...
    • 🐰 Rabbit Holes 

Taming Rabbit Holes


  • Tutorial blog post you started with
  • Javascript / Python Syntax Cheatsheet
  • StackOverflow Answers
  • Links from Slack
  • Pudding / 538 / NYT / Kantar IIB Awards
  • Property "x" does not exist
  • Github issues open since 2015
  •  undefined is not a function
  • New charting library
  • What is this React thing?
  • Property "y" is not a date
  • etc...

Make it run,


Make it right,


Make it fast.


- Kent Beck (Software Engineer)

Skipping Steps?

Who needs "first drafts" / "validation"?

Agile - not just for work

  • Sandi Metz (Rubyist)
    • Purpose of design is to enable doing design later
    • Goal of design is to reduce the cost of change

Design and Code Quality Extras


  • Uncle Bob (Robert Martin) - "Clean Architecture"
    • Enable defer architectural choice as late as possible
    • You'll have more information later, which will help with making better decisions


Over time- drafts get cleaner, but the ceiling moves

Design and Code Quality Extras

Overcoming Obstacles with Remakes


  • Common fears
    • What if the result is bad?
    • What if I waste time?
  • Overwhelmed by possibilities
    • Can happen at start, in the middle...
    • 🐰 Rabbit Holes

 You already like the idea

The mantra gives you milestones

You're guaranteed to learn

Making it (run|right|fast) in practice

Make it Run: Overview


  1. Find existing code
  2. Find your own data
  3. Adapt (2) to fit (1) (or vice versa)


Goal:

Decide quickly if spending more time is worth it!

Making it Run - Find Code + Test Drive

Google, Slack, Pinterest, Blockbuilder-Search (Links Below)

Prior Art - Code

Prior Art - History

Prior Art - Usecases

Make it Run: Data 

  • Finding MTA data
    • 26 Hours in a day
  • Data Enrichment/parsing/cleaning
    • Vincenty Distance (non spherical)
    • Precompute Slopes
  • Jupyter Notebook for Route 3 - Link (pre-open)
    • Python environment to mix code + docs

MTA Data - 10 TXT Files

Data Quality with Missingno

Vincenty Distance Data Quality Check

- 1 Giant file


(historical re-enactment w/ 2019 data)

Speedbumps

  • Where to parametrize?
    • Showed coworker different line
    • Hardcoded separate file
  • Magic numbers
  • Global variables
  • CPU fan working hard 🚀
  • Visual Noise
  • Updating the DOM was verbose/tricky

It Runs - We're Done? 🏁

  • MVP January 2018 (D3 V4)
    • Unsure about next steps
      • Filtering
      • Changing source
      • (Data-view relationship)
    • Skills / Goals Gap
  • Plan
    • Bridge gap, then return
    • OR wait for a need

The Return: Making it "Right"

  • Revisited April 2019
  • What Changed?
    • New tools (React/Redux/Typescript/Parcel)
      • Motivated by "run" problems
    • Copied other things
    • ​Practiced teaching (writing/in person)
    • DVS #historical-viz / #location-nyc

Making it "Right" - 2 Hats


  • Design 
    • Chasing a moving target


  • Technical
    • It already "runs"
    • Enabling Change
    • Wrangling State (Power Cycle)

Defining "Right"

  • Reusability with React
    • Declarative / Modular
    • Contain state
  • Safety with Typescript / Redux Dataflow
    • Smart Spellcheck + Complete (demo)
  • Visualizations Enabling Visualization
    • Time Travel
    • Livecode Debugging
    • Fast Feedback!

Evolution (Sessions)

  1. Starting: Pure HTML / JS / D3, with Prepros to bundle
  2. Prepros out, parcel in Parcel
  3. Breakup large file into reusable functions
  4. Commit to react, replace Parcel with CRA
    1. Add "rescripts" for HMR (demo)
  5. Incremental SVG -> Canvas with Konva
    1. (Managed positioning bugs)
  6. Redux in a single file (copy from prev app)
  7. Add Rewired-typescript to type reducer/actions
  8. Use reselect
  9. Rewrite reducer with typesafe-actions
  10. React-hooks / redux hooks (released last month)
  11. Future - web workers, gatsby, svelte, elm?

Defining Right

  1. Where do trains usually bunch up?
  2. How many trains is the MTA managing right now? (Empathy)
  3.  Assess options to get from (A,B,C) to (F)


...

Too many trains to visualize all at once! (Common Q)


Future: commuter (me) vs Train Engineer

Picking Features

Fun to make

Useful to have

Error handling

Login form

Xenographics*

Exit animations*

👌

(not to scale)

"Sweet Spot"

Gradients*

Date parsing

Selected Features

  • Data source toggle
    • IBM Carbon
    • Widen Audience
  • Station Filter
    • Redux + Typescript
      • typesafe-actions
    • Reduce noise
  • Time Filter (Brush)
    • Integrating d3-brush with React
      • @vx/brush (framework pivot)
    • Direct Manipulation (Schneiderman)
  • Fun
  • Useful

Make it Fast (Optional 🐰!)

  • (No extra work) - React Fiber Updates
  • Caching in Redux with Reselect
    • "Recently Visited" Shelf @ Library
  • SVG + Canvas Together
    • SVG for axes
    • Canvas for workhorse elements
      • React-Konva
  • Future
    • Optimize data structures (~50k stops)
    • Web workers
  • (Very easy to get distracted with optimizations)
  • Talk to me later for details!

Outline

1. Motivation:

     Why Build a Marey Chart of MetroNorth Transit Data?

2. Process:

     A Prioritization Framework for Side Learning Projects

3. Demo

   - Filters, Brushing, HMR, Devtools, Time-Travel

4. Recap

Checkpoint

1. Motivation:

     Why Build a Marey Chart of MetroNorth Transit Data?

2. Process:

     A Prioritization Framework for Side Learning Projects

3. Demo

   - Filters, Brushing, HMR, Devtools, Time-Travel

4. Next Steps / Recap

Next Steps

  • Pull requests welcome!
    • Sync state to URL (make settings shareable)
    • Mobile friendly / responsive
    • Investigate late night data issues
    • Filter trips by direction
    • Replace Jupyter pipeline
    • Layer in true "lateness" data

Next Steps

  • UI overhaul
    • Thoughtful control panel
    • "Admin" visual variables / canvas size
  • Tooltips
    • ​MVP: onClick to console
    • Fare, track #, pricing zone
  • Marginal plots (trip count per time instant)
  • Express vs semi-express vs local trips
  • Animation / transitions

Takeaways

1. Motivation: Remake classics with modern data

  - "Ibry Charts" reveal patterns tables don't

  - MetroNorth train schedules affect millions


2. Process: This works for me, YMMV 

   - Frameworks help manage 🐰 holes + keep you sane!

   - Make it run, make it right, make it fast (use both hats)

3. Demo:

   - Try it / share with a fellow commuter!

   - Try it on other movement data (races, agile, progress, etc)

Interactive "Ibry" Charts / Structuring Self-Learning 


Twitter / Github: @hydrosquall

Blog: serendipidata.com (Writeup coming soon)

Demo: metronorth-viz.netlify.com

Slides: slides.com/cameronyick/metronorth-train-viz

Thanks!

Interactive Ibry Charts of the MetroNorth Trains

By Cameron Yick

Interactive Ibry Charts of the MetroNorth Trains

Why + how to make interactive visualizations of train schedules, and a framework for making the most out of learning from side projects.

  • 2,950