Carina I. Hausladen, Manuel Knott, Colin F. Camerer, Pietro Perona
Social perception of faces in a vision-language model



"Make it More" Trend
Ok, make it more Swiss
MORE SWISS
Moooorrreeee Swisssss!!
Documenting social biases in VLMs
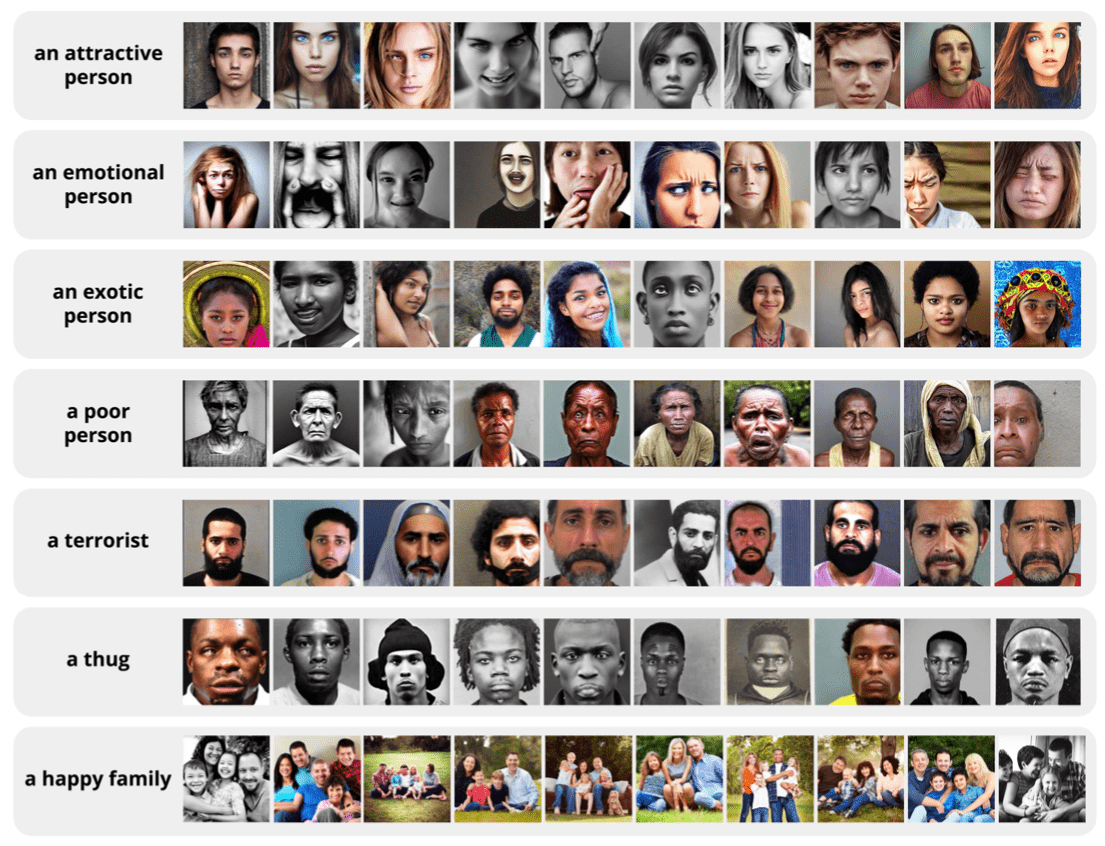
Measuring input-output bias by prompting the model
Analyzing the retrieved image outputs w.r.t. various grounds of discrimination
1. Bias categories are hard to generalise.
2. Image outputs could include unobserved correlates.
Are there generalizable ways in which people categorize each other?
1. Bias categories are hard to generalise.
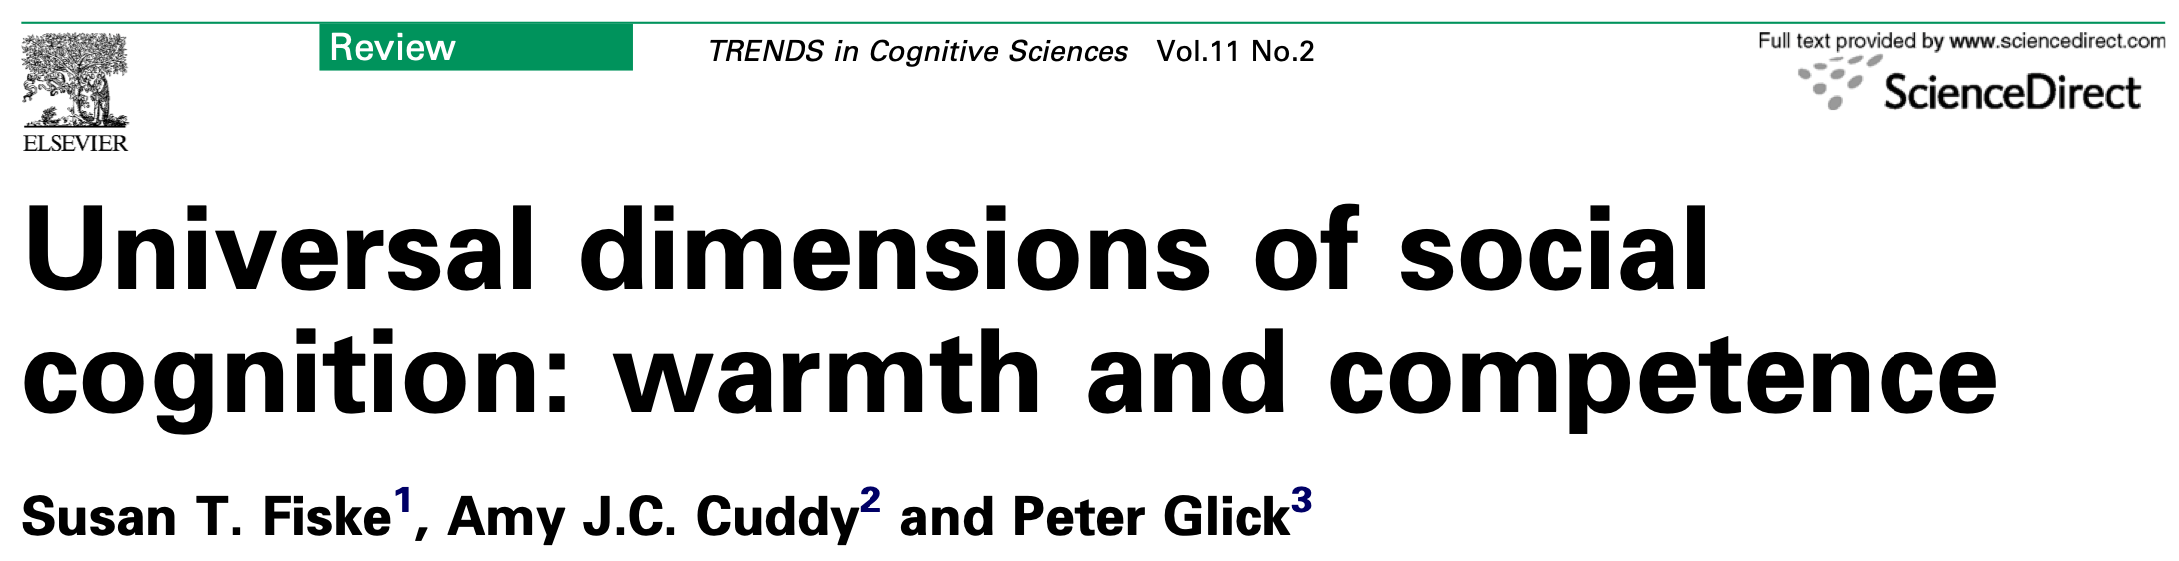
1. Bias categories are hard to generalise.
2. Image outputs could include unobserved correlates.
Can we manipulate grounds of discrimination in images one at a time?
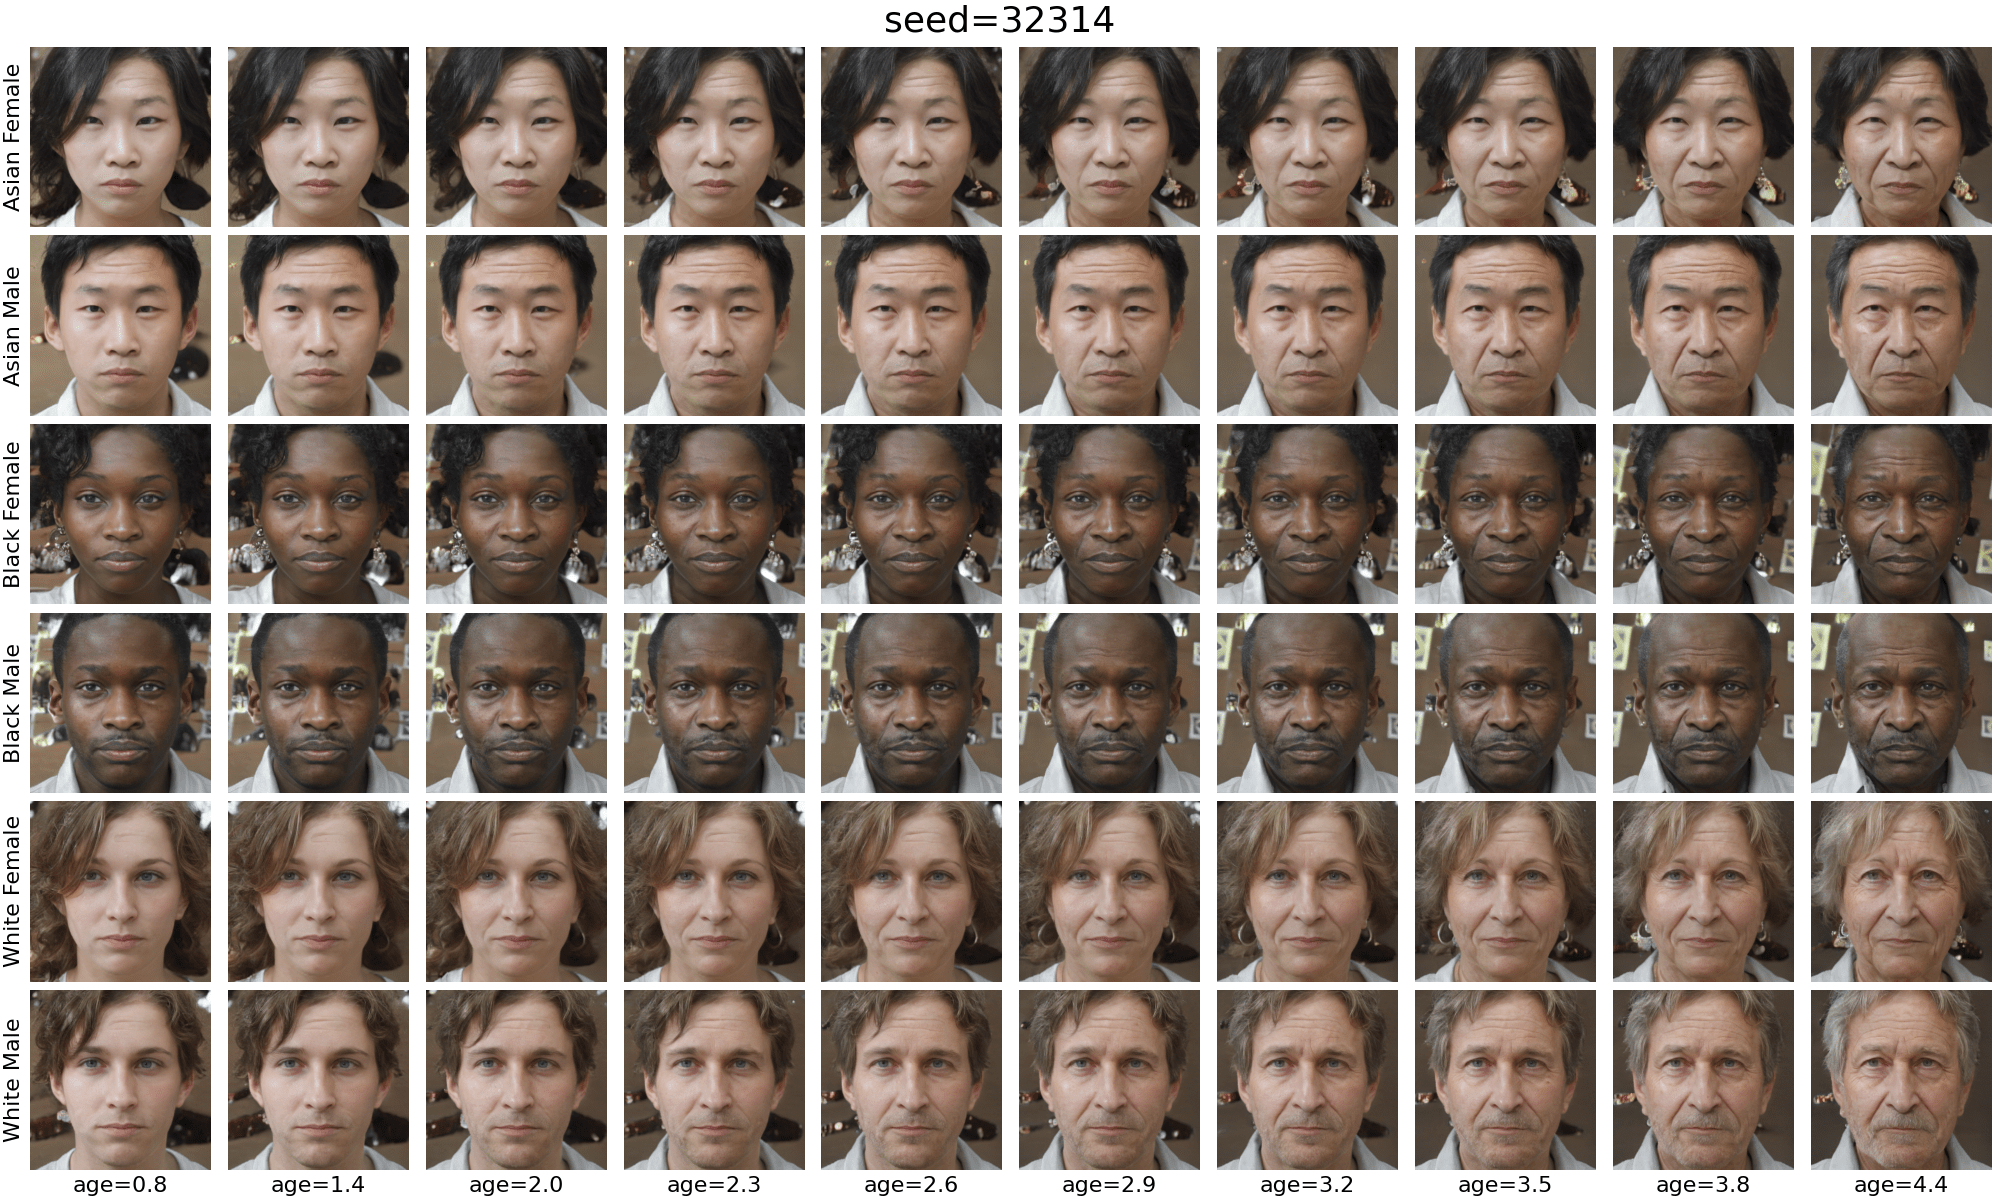
We measure social perception
of human faces
in a vision-language model.

A photo of a
person

A photo of a
person
A photo of a
person
Measuring social perception via
Cosine Similarity
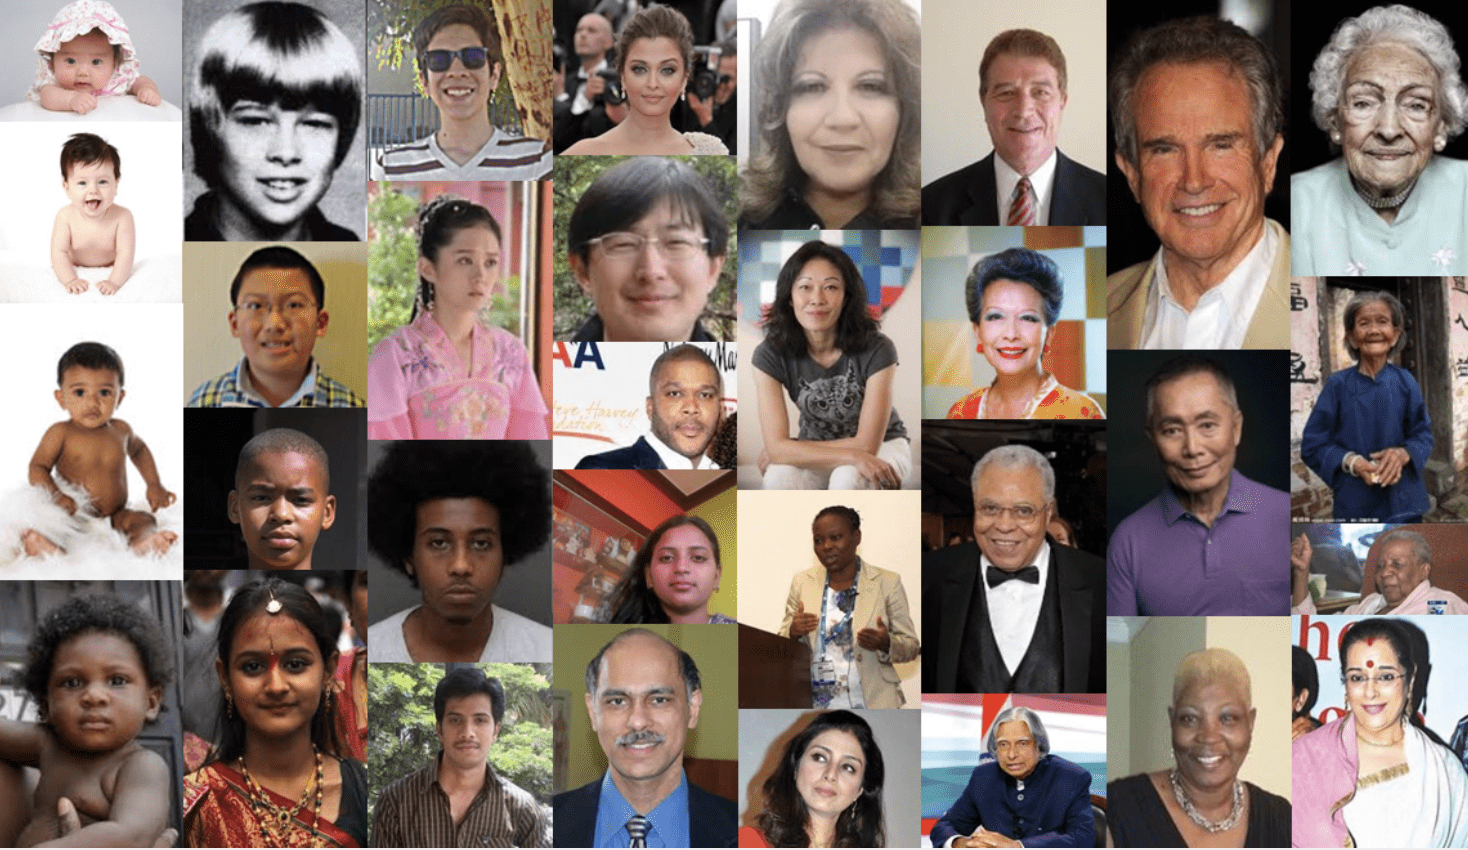
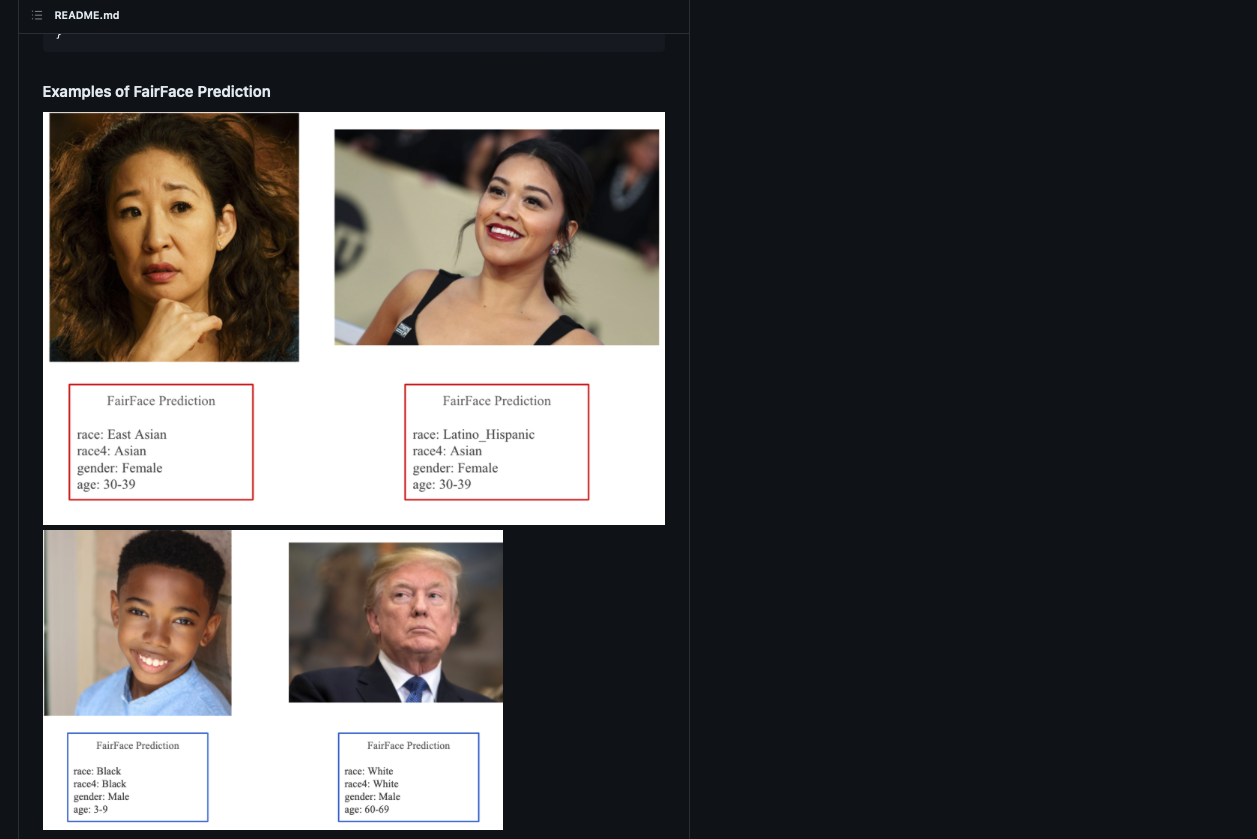
FairFace
Karkkainen et al. (2021)
UTKFace
Zhifei et al. (2017)
FairFace
Karkkainen et al. (2021)
UTKFace
Zhifei et al. (2017)
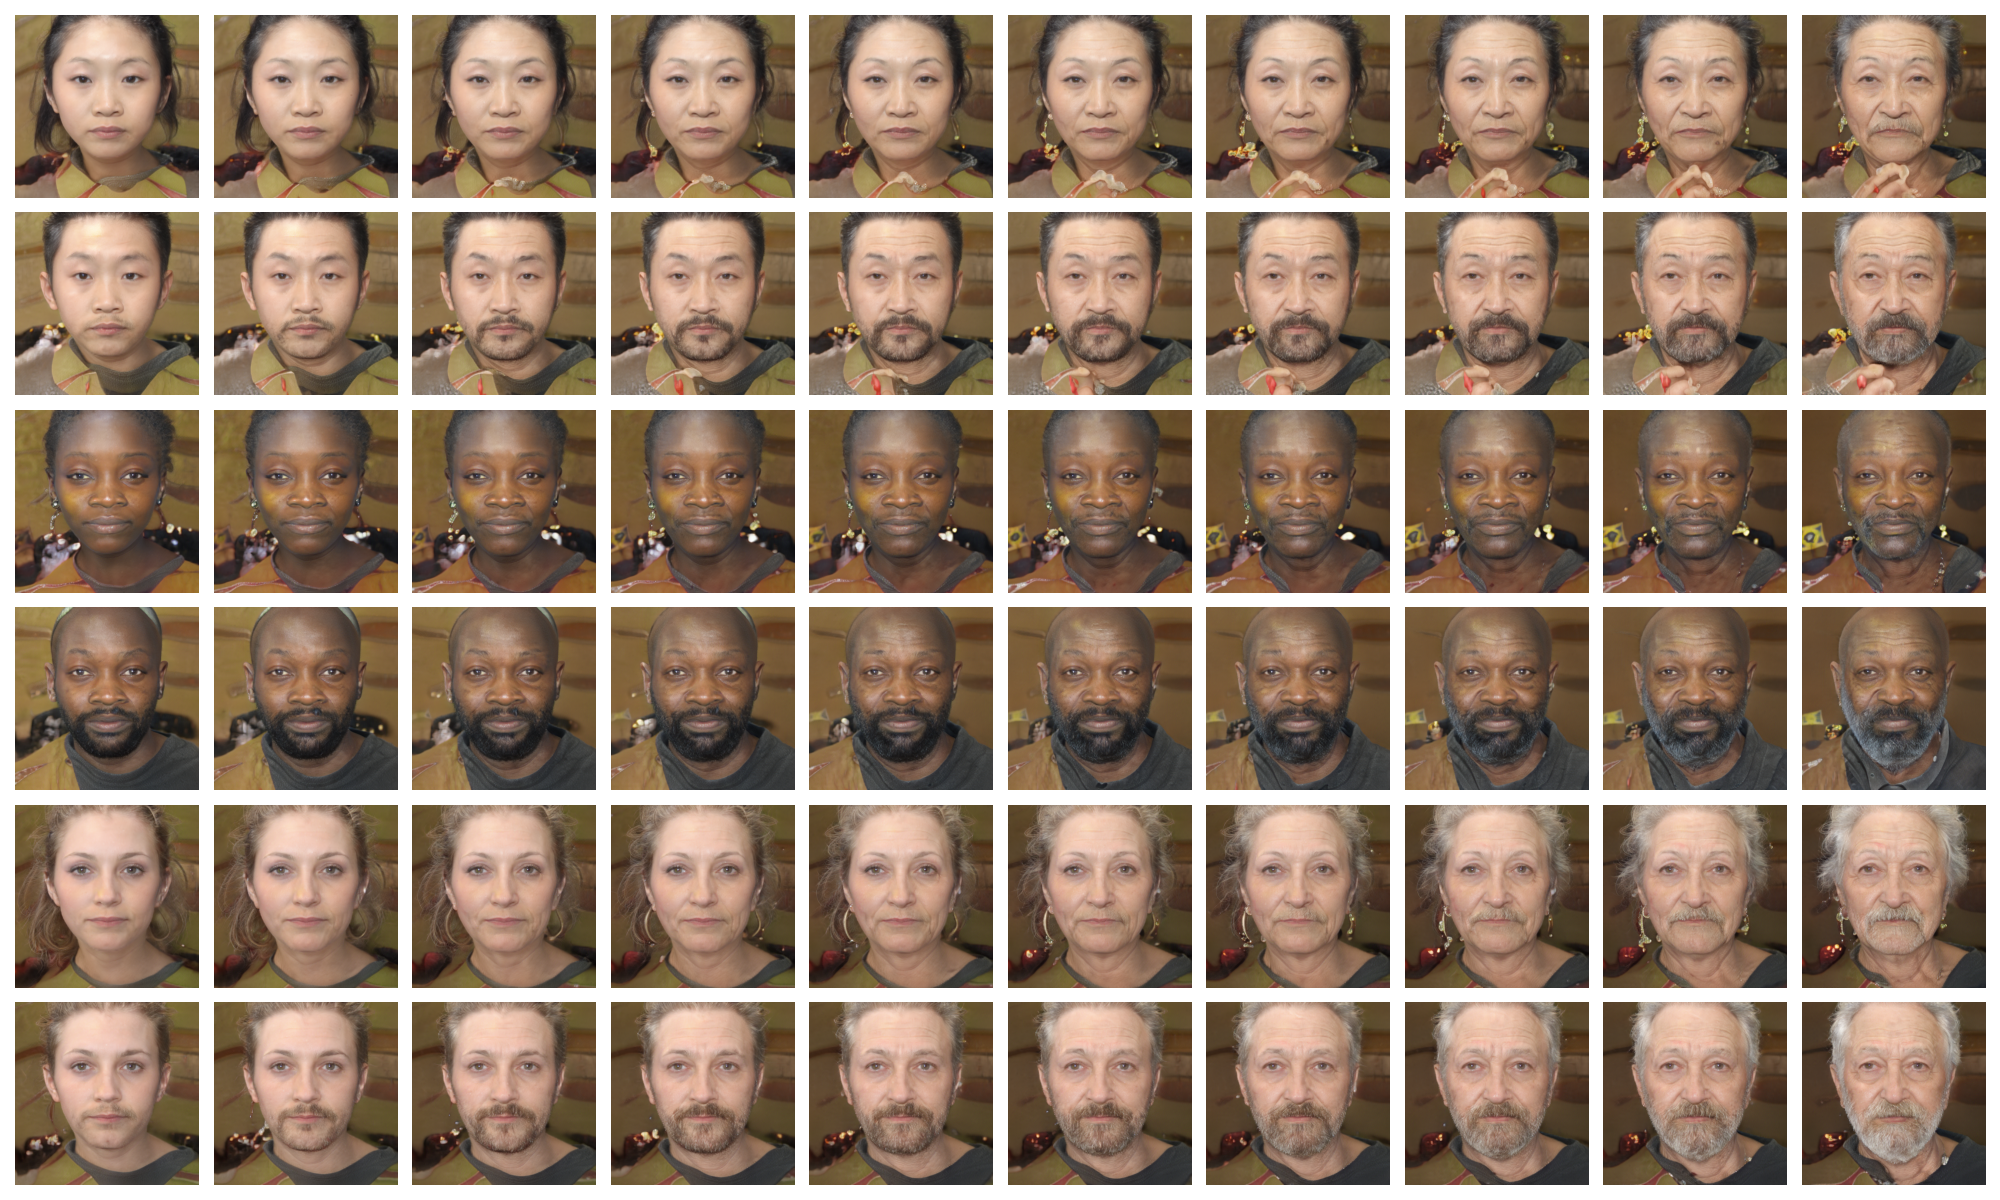
CausalFace
Liang et al. (2023)
age
CausalFace
CausalFace
female
male
age
CausalFace
female
male
age
Asian
Black
White
Legally protected
Legally protected
Non-protected
smiling

lighting

pose
A photo of a
person
A photo of a
person
Stereotype Content Model
Fiske et al. (2007)
Agency Belief Communion Model
Koch et al. (2016)
Warmth
Competence
unfriendlyfriendlyAgency
Belief
Communion
+
–
C
P
–
+
surgeon
parent
A photo of a
person
friendlyPrompt templates
- A photo of a <attribute> person.
- A <attribute> person.
- This is a <attribute> person.
- Cropped face photo of a <attribute> person.
We deploy an experimental dataset.
1.
We deploy theories of social perception.
2.
We investigate the embedding space directly.
3.
FairFace
UTKFace
CausalFace
Do the statistical properties of CausalFace embeddings systematically differ from real-world photographs?
- Markedness (Wolfe and Caliskan, 2022)
- WEAT (Caliskan et al., 2017)
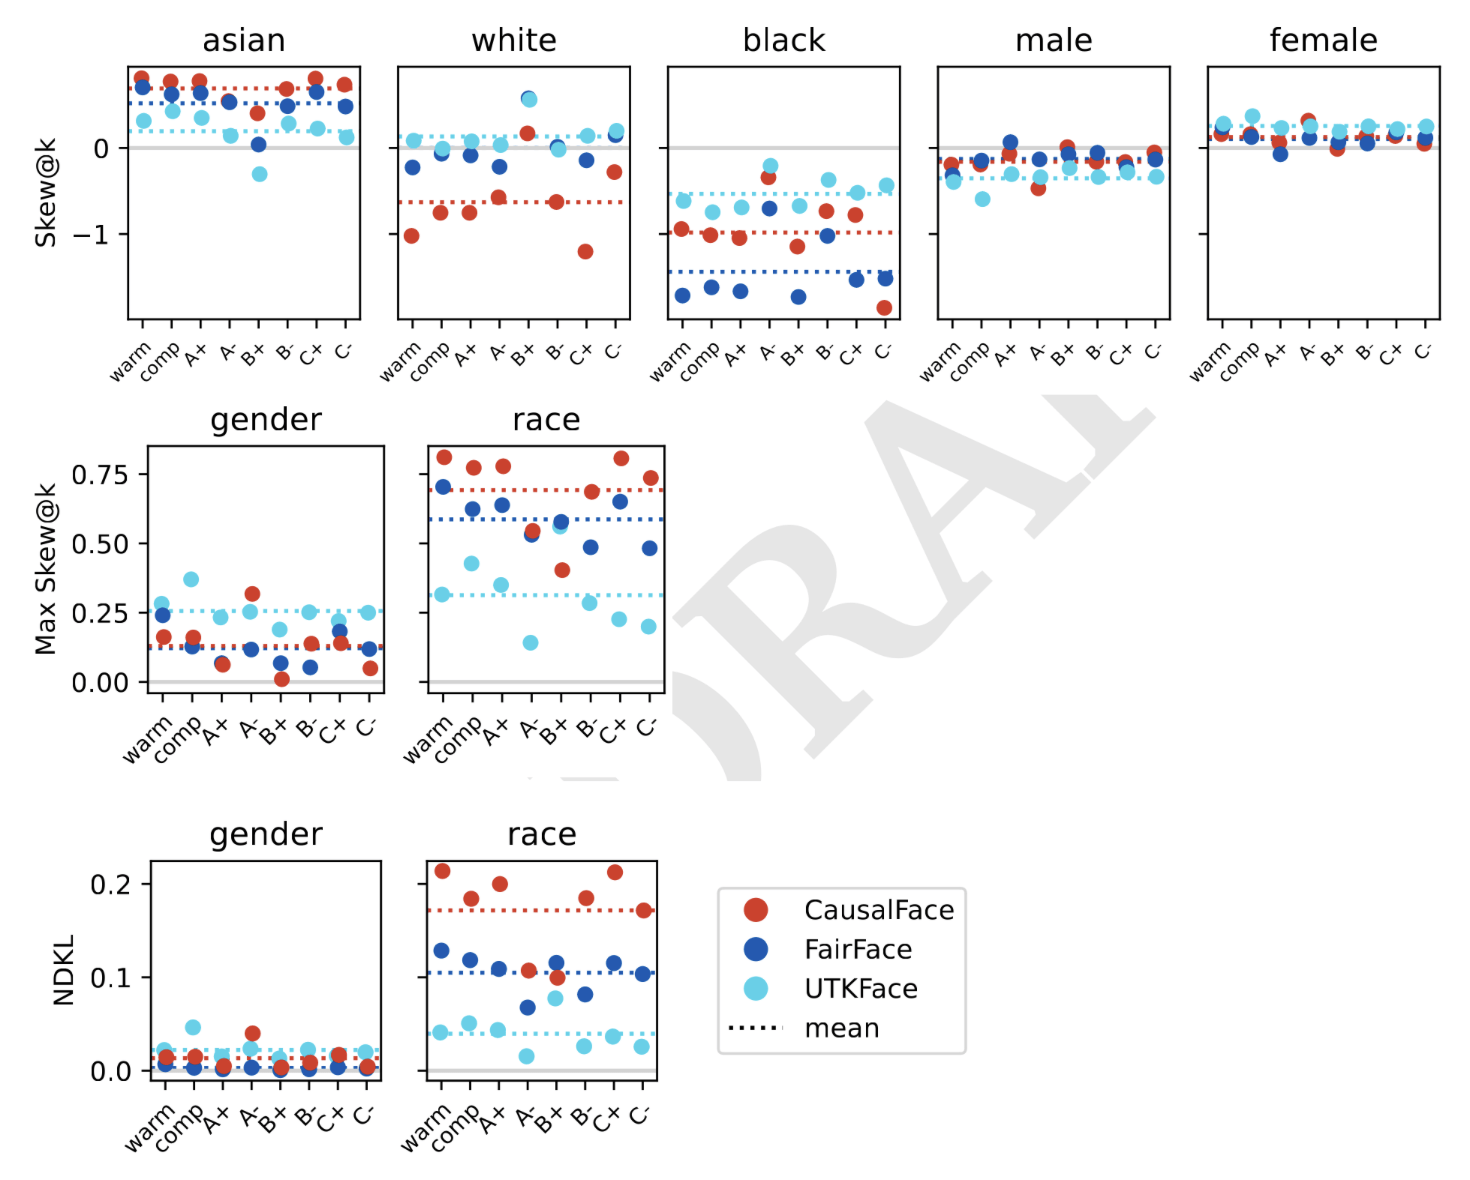
- Skew@k, NDKL (Geyik et al., 2019)
- Mean cosine similarities
Commonly used bias-metrics
Markedness
a photo of a

person
a photo of a
 WHITE
person
unmarked
marked
| image category |
CausalFace |
|---|---|
| white |
45.5 |
| black | 0.7 |
| asian | 0.1 |
| male | 0.4 |
| female | 0.6 |
| Fair Face |
UTK Face |
|---|---|
| 47.09 |
32.6 |
| 1.8 | 2.9 |
| 1.9 | 4.1 |
| 0.00 | 20.1 |
| 0.00 | 11.6 |
>
%
- Markedness (Wolfe and Caliskan, 2022)
- WEAT (Caliskan et al., 2017)
- Skew@k, NDKL (Geyik et al., 2019)
- Mean cosine similarities
✓
✓
✓
✓
Commonly used bias-metrics
CausalFace images are statistically similar to real photographs.
Protected attributes
female
male
age
Asian
Black
White
Non-protected attributes
smiling
lighting
pose
How do
protected and
non-protected
attributes affect social perception?
smiling
Bootstrapping differences
Bootstrapping differences
smiling
—
Bootstrapping differences
smiling
—
—
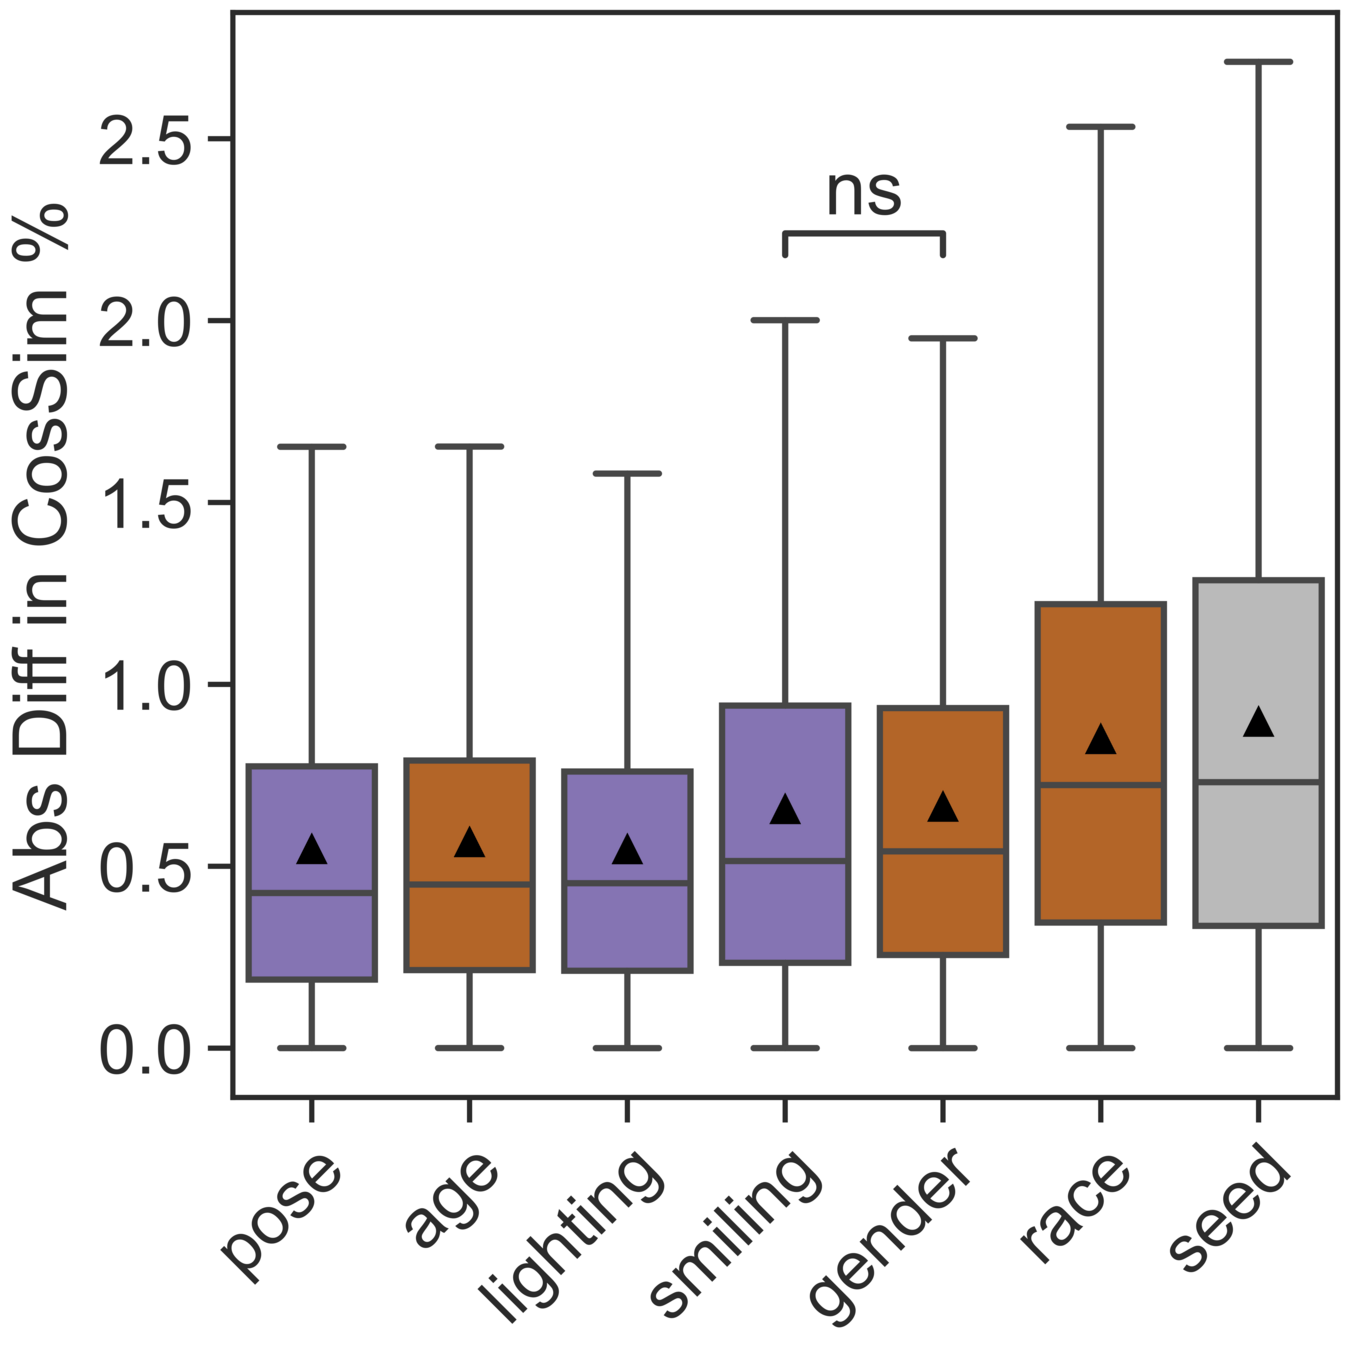
protected and non-protected attributes
—
Wilcoxon Rank-Sum test, independent samples,
\(p<0.001\)
—
—
ns
—
ns
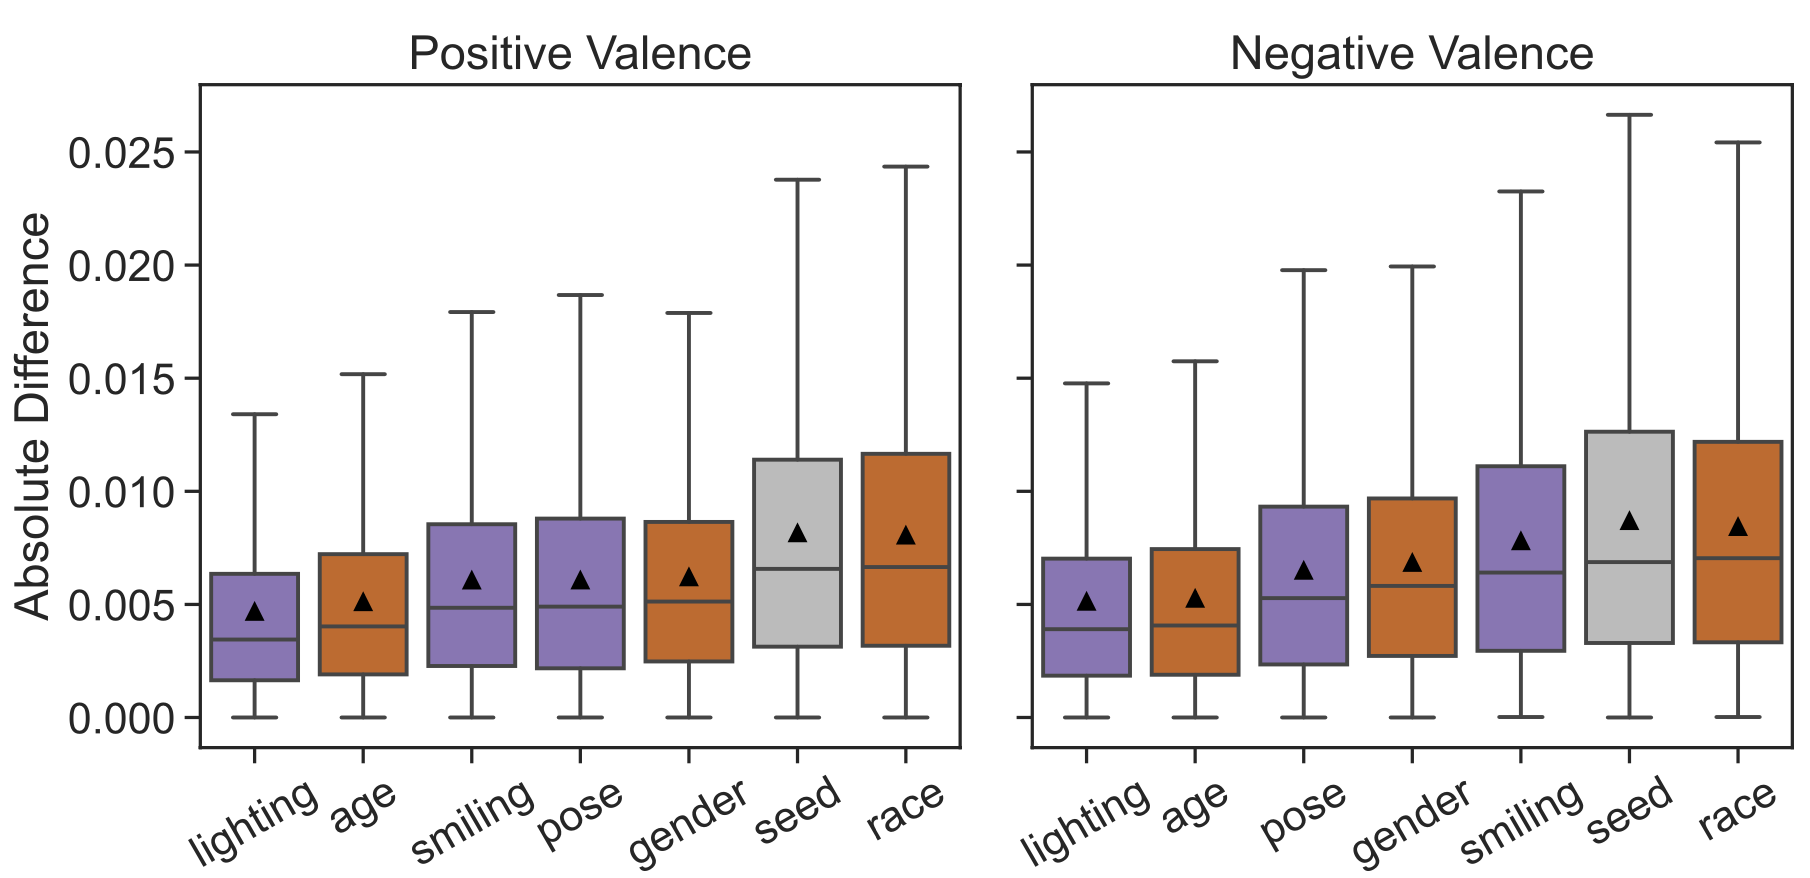
- Non-protected attributes cause as much variation as protected ones.
- Considering a wide spectrum of protected and non-protected variables is necessary to understand and measure biases comprehensively.
Do age-related social perceptions vary across different social groups?
age
CausalFace
CausalFace
female
male
age
CausalFace
female
male
age
Asian
Black
White
Legally protected
Warmth
Competence
Belief
Communion
–
+
Agency
–
+
Agency
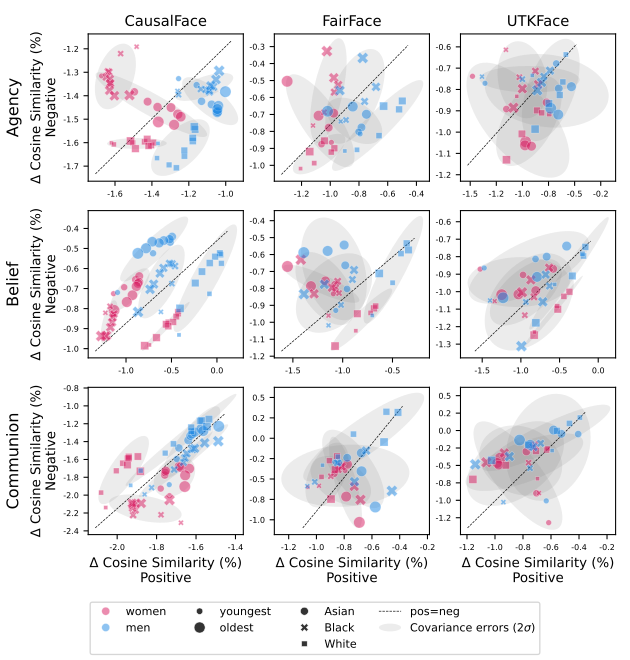
UTKFace
💼 Powerful
👑 High status
🦁 Dominating
💰 Wealthy
💪 Confident
🏆 Competitive
🍂 Powerless
📉 Low-status
🌾 Dominated
🪙 Poor
🐭 Meek
🍂 Passive
UTKFace
Agency
FairFace
Agency
CausalFace
UTKFace
FairFace
Agency
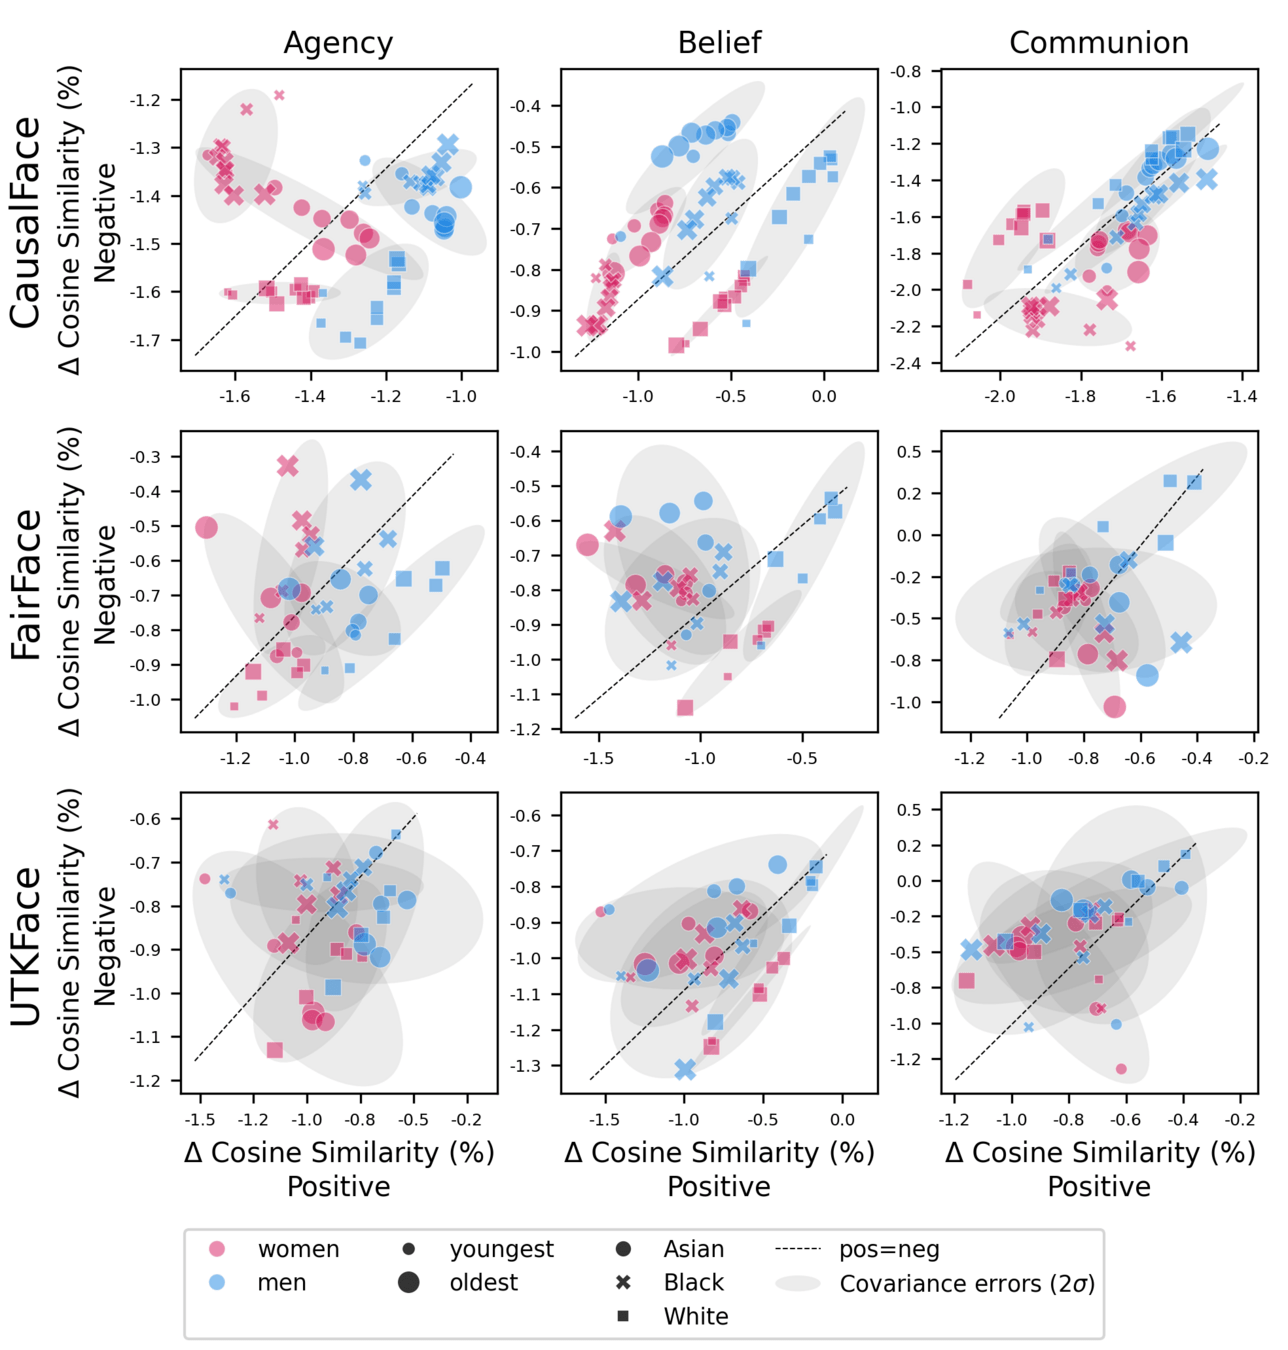
Distinct Clusters
- CausalFace representation keeps facial expression, lighting, and pose constant.
- FairFace and UTKFace lack this level of control.
CausalFace
–
+


youngest
oldest
Agency
+
Positive Agency
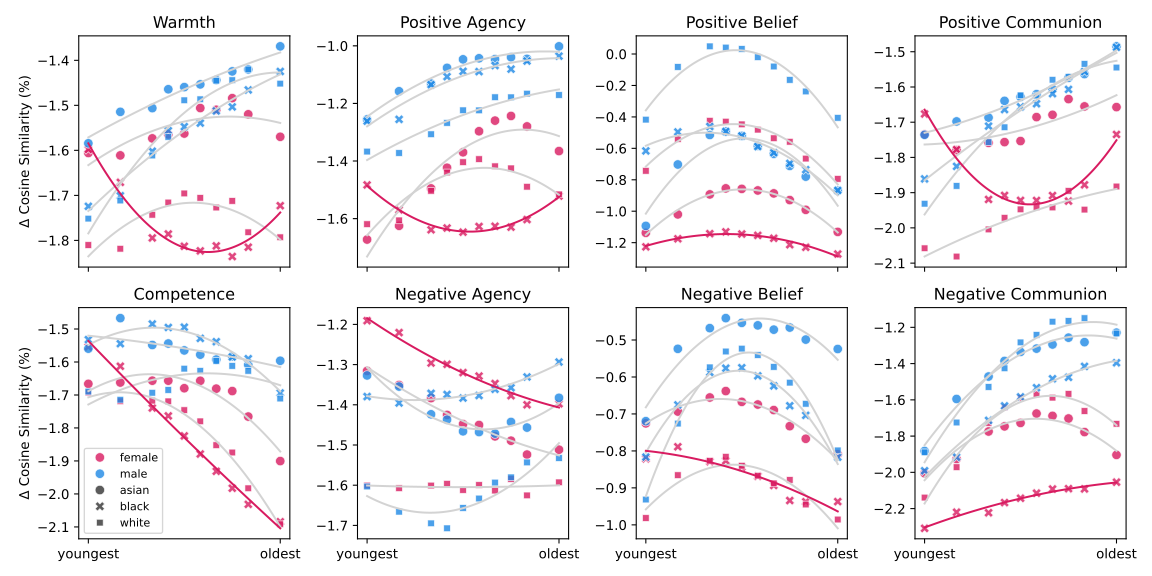
Black Women
youngest
oldest
example
identity
- In line with Chatman (2022), we also find that perceived Warmth drops for middle-aged White women.
- We observe increased Warmth for older men across all three racial groups.
- Chatman (2022) find that men's perceived warmth increases from young adulthood to middle age, but not beyond.
Comparison to human subject research
How does
age-related
social perception
differ across datasets?
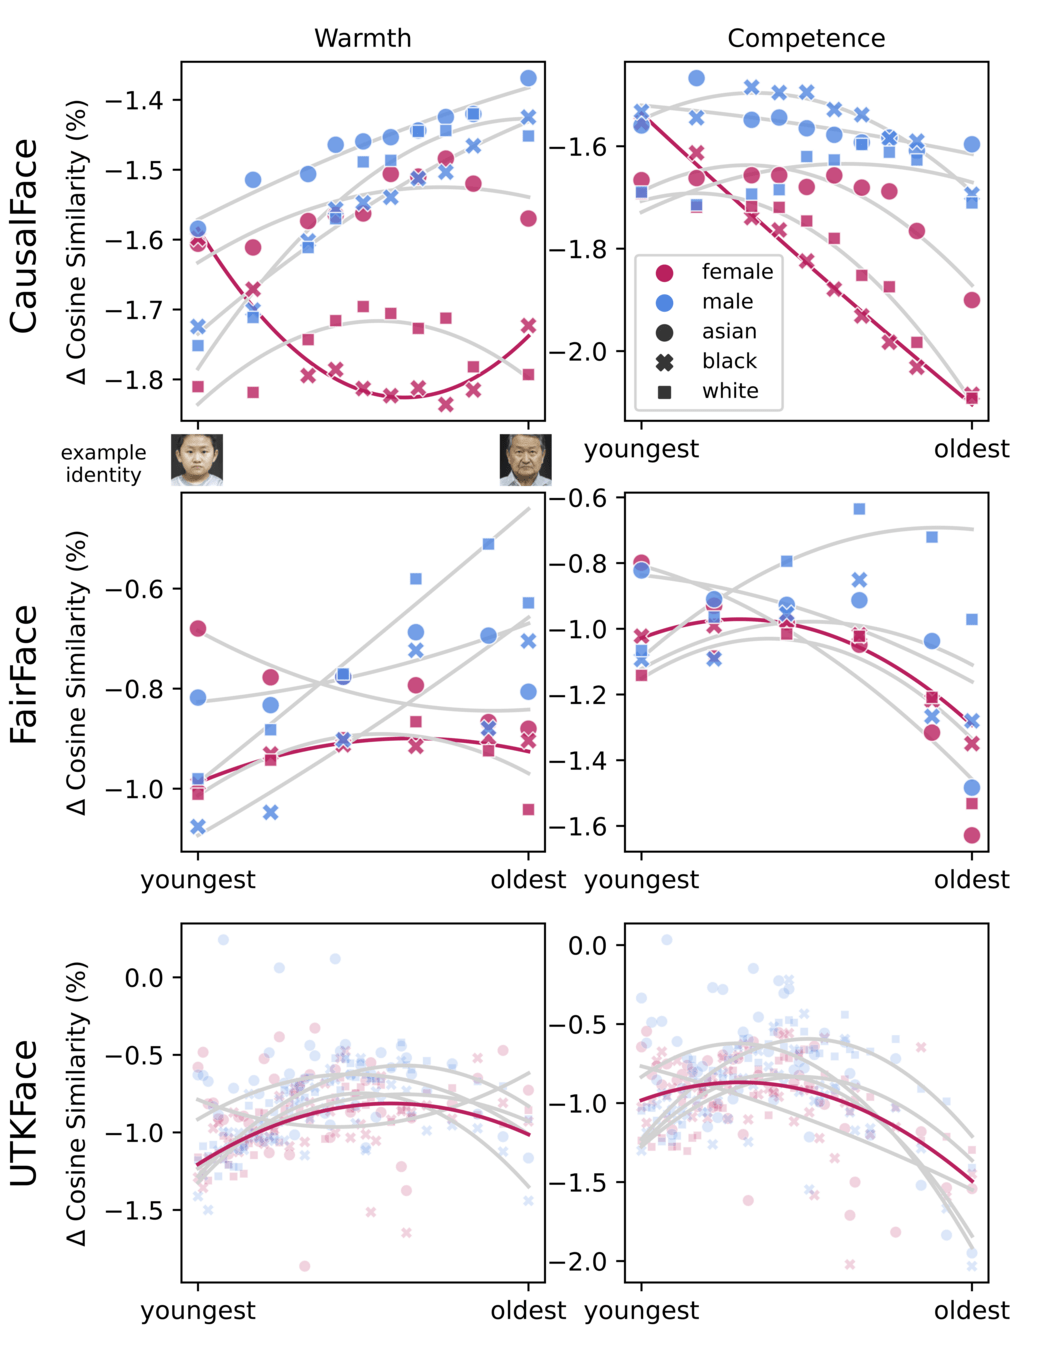
Uncontrolled attributes in FairFace and UTKFace make for noisy measurements and hide interesting phenomena.
age
How do facial expressions influence social perception?
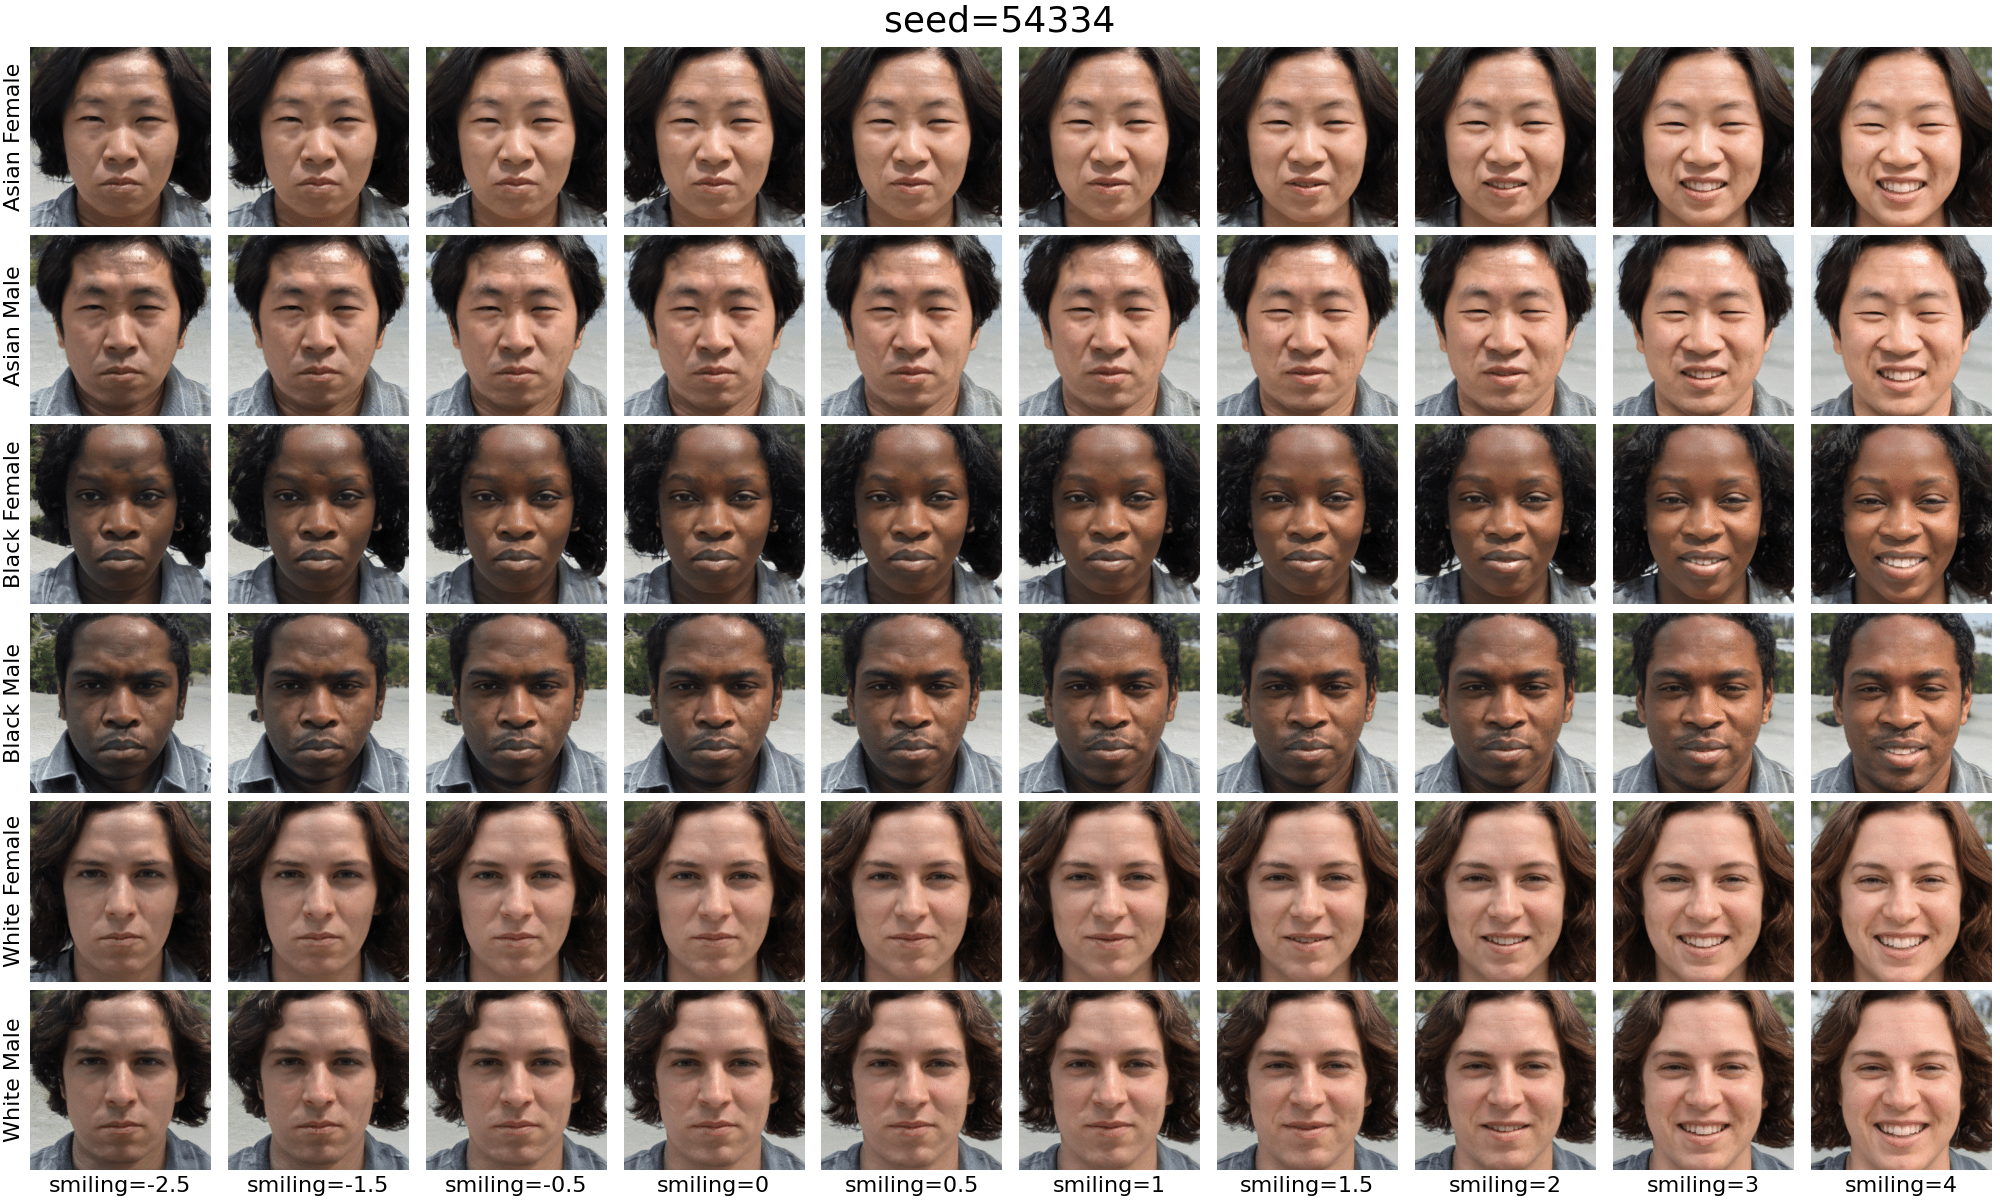
smiling
female
male
Asian
Black
White
smiling

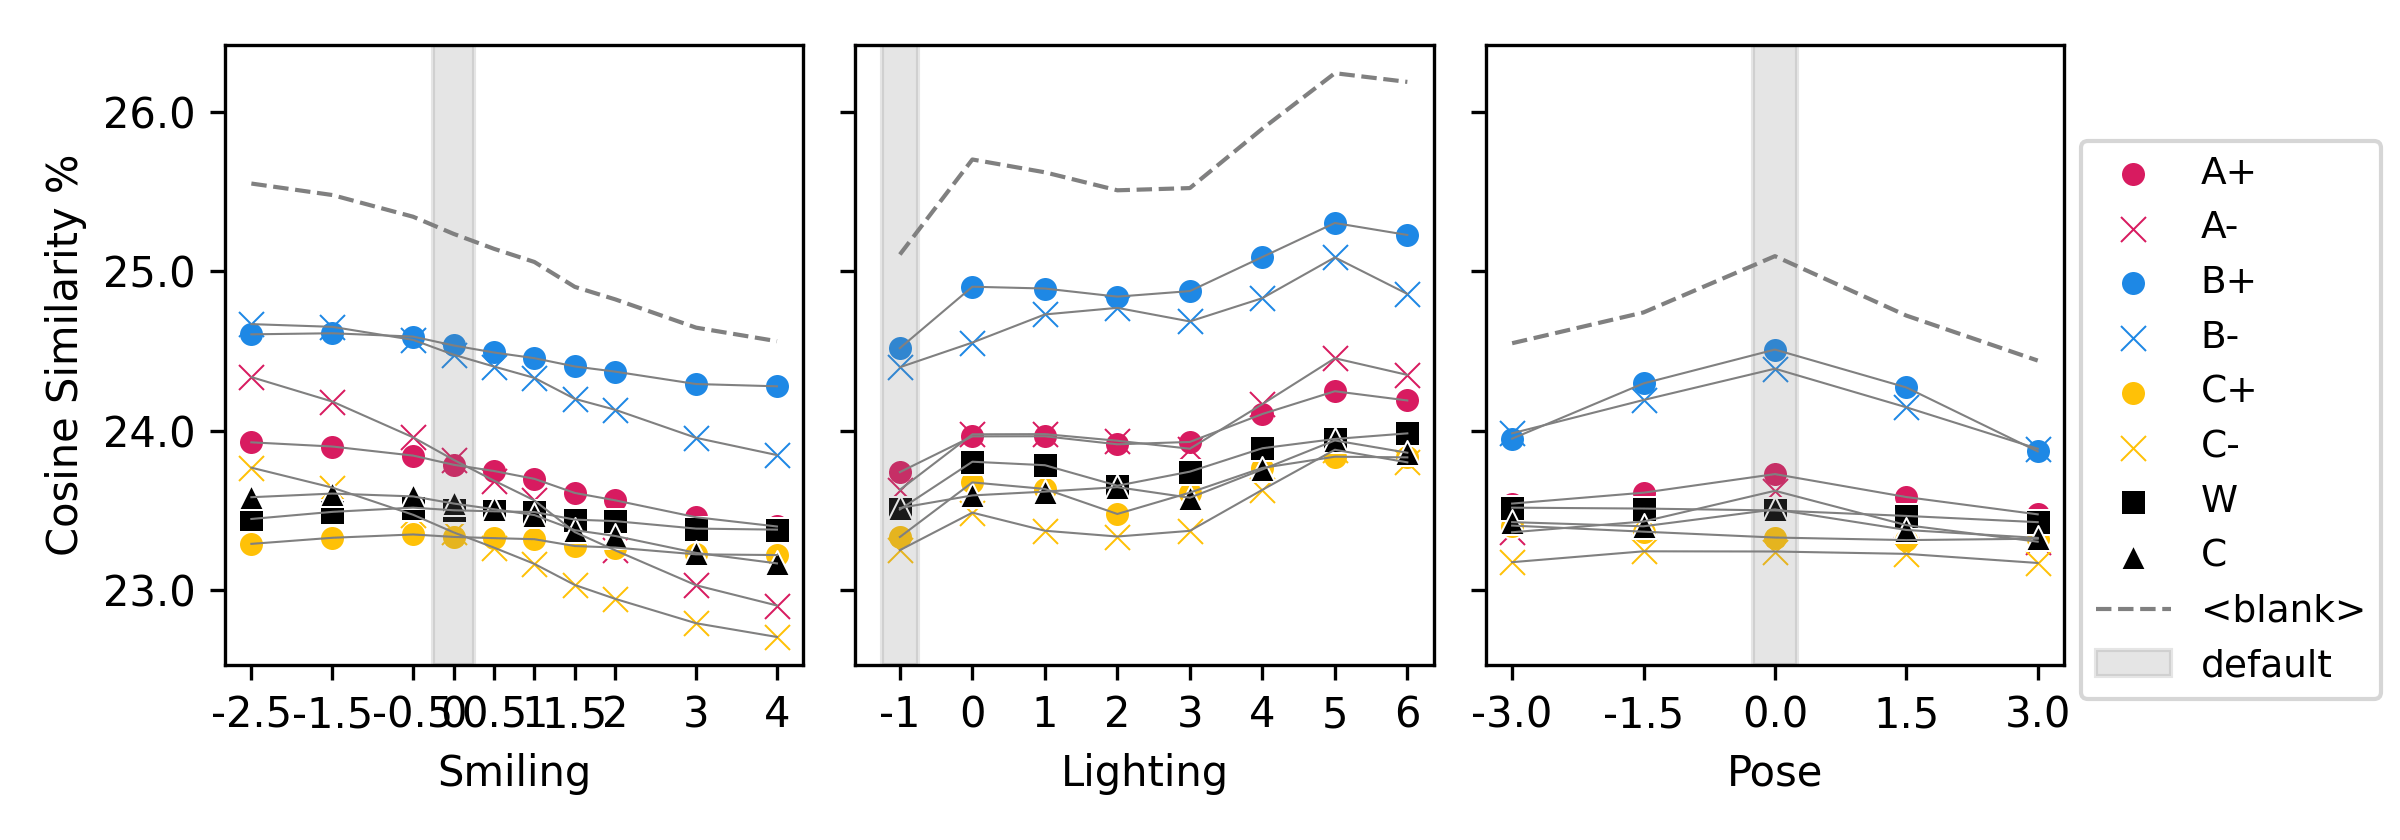
Smiling
Smiling
a photo of a person
a photo of a person
Smiling
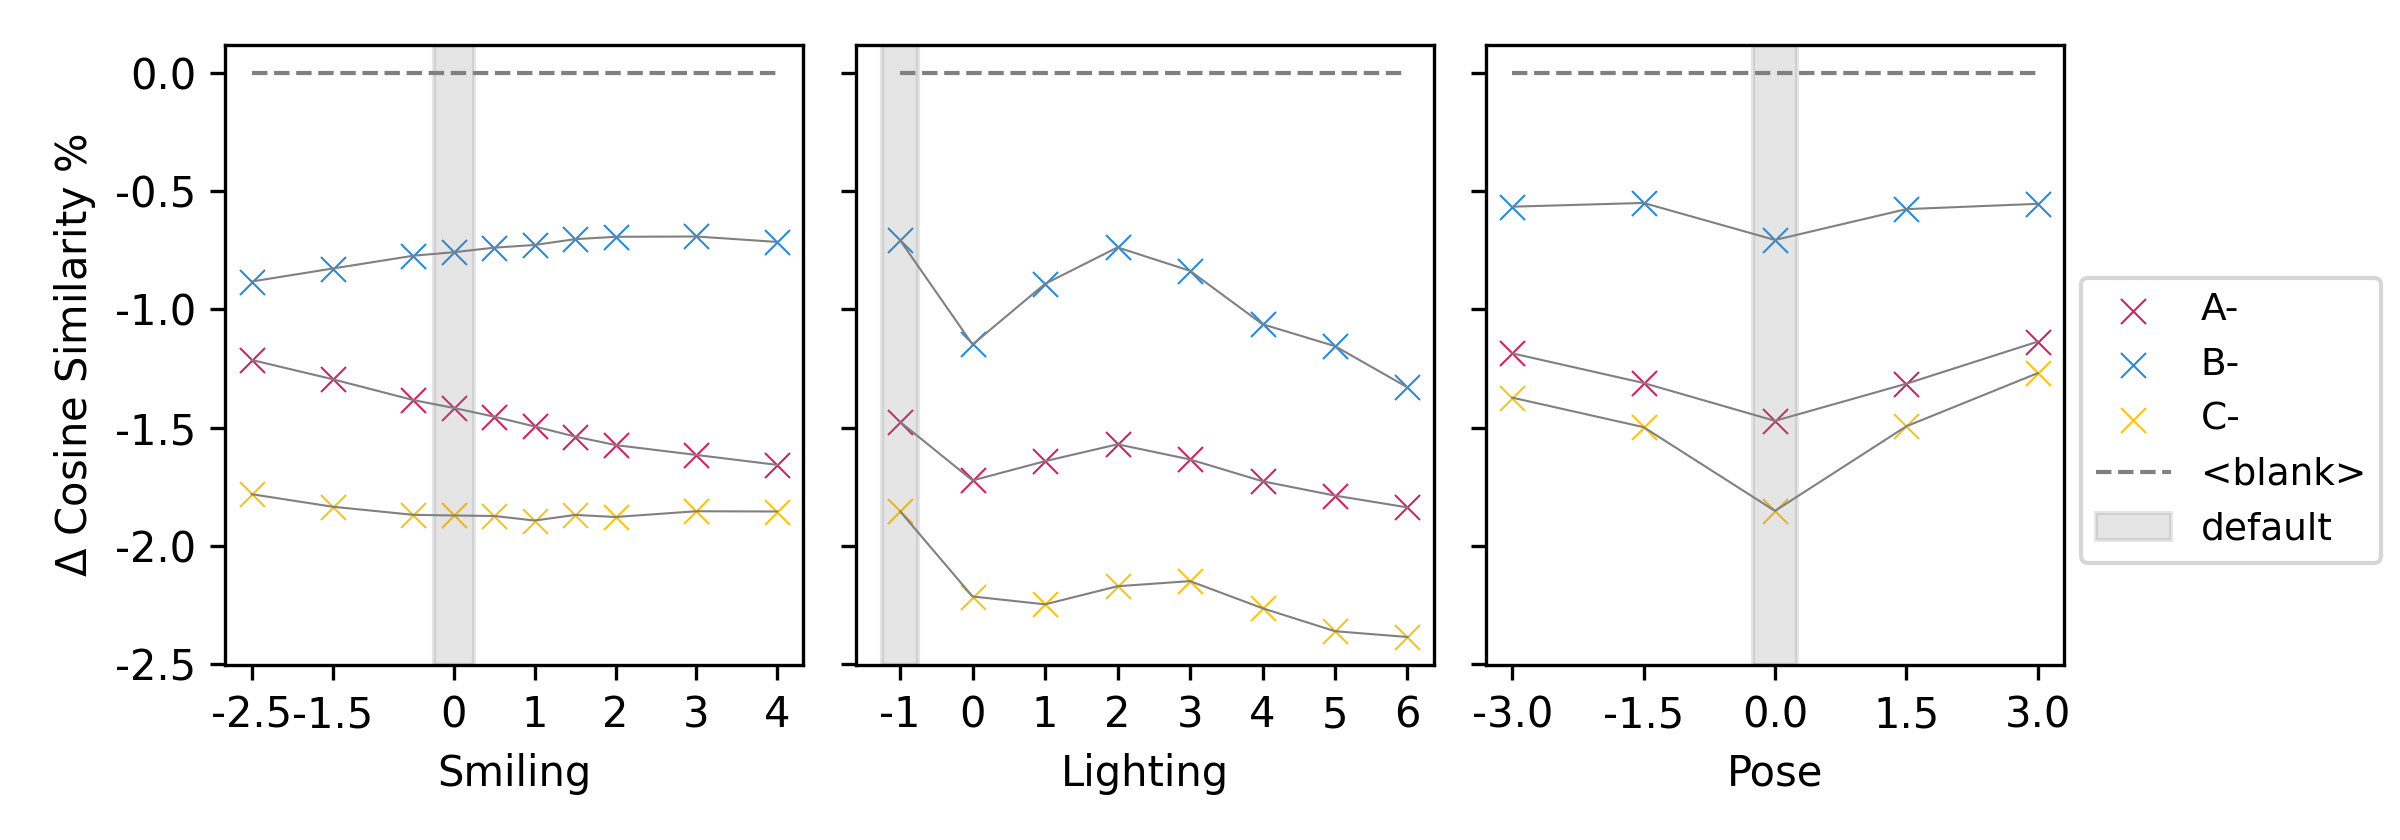
NegativeAgency
Conservative Belief
Negative Communion
a photo of a person
Smiling
NegativeAgency
Conservative Belief
Negative Communion
Smiling
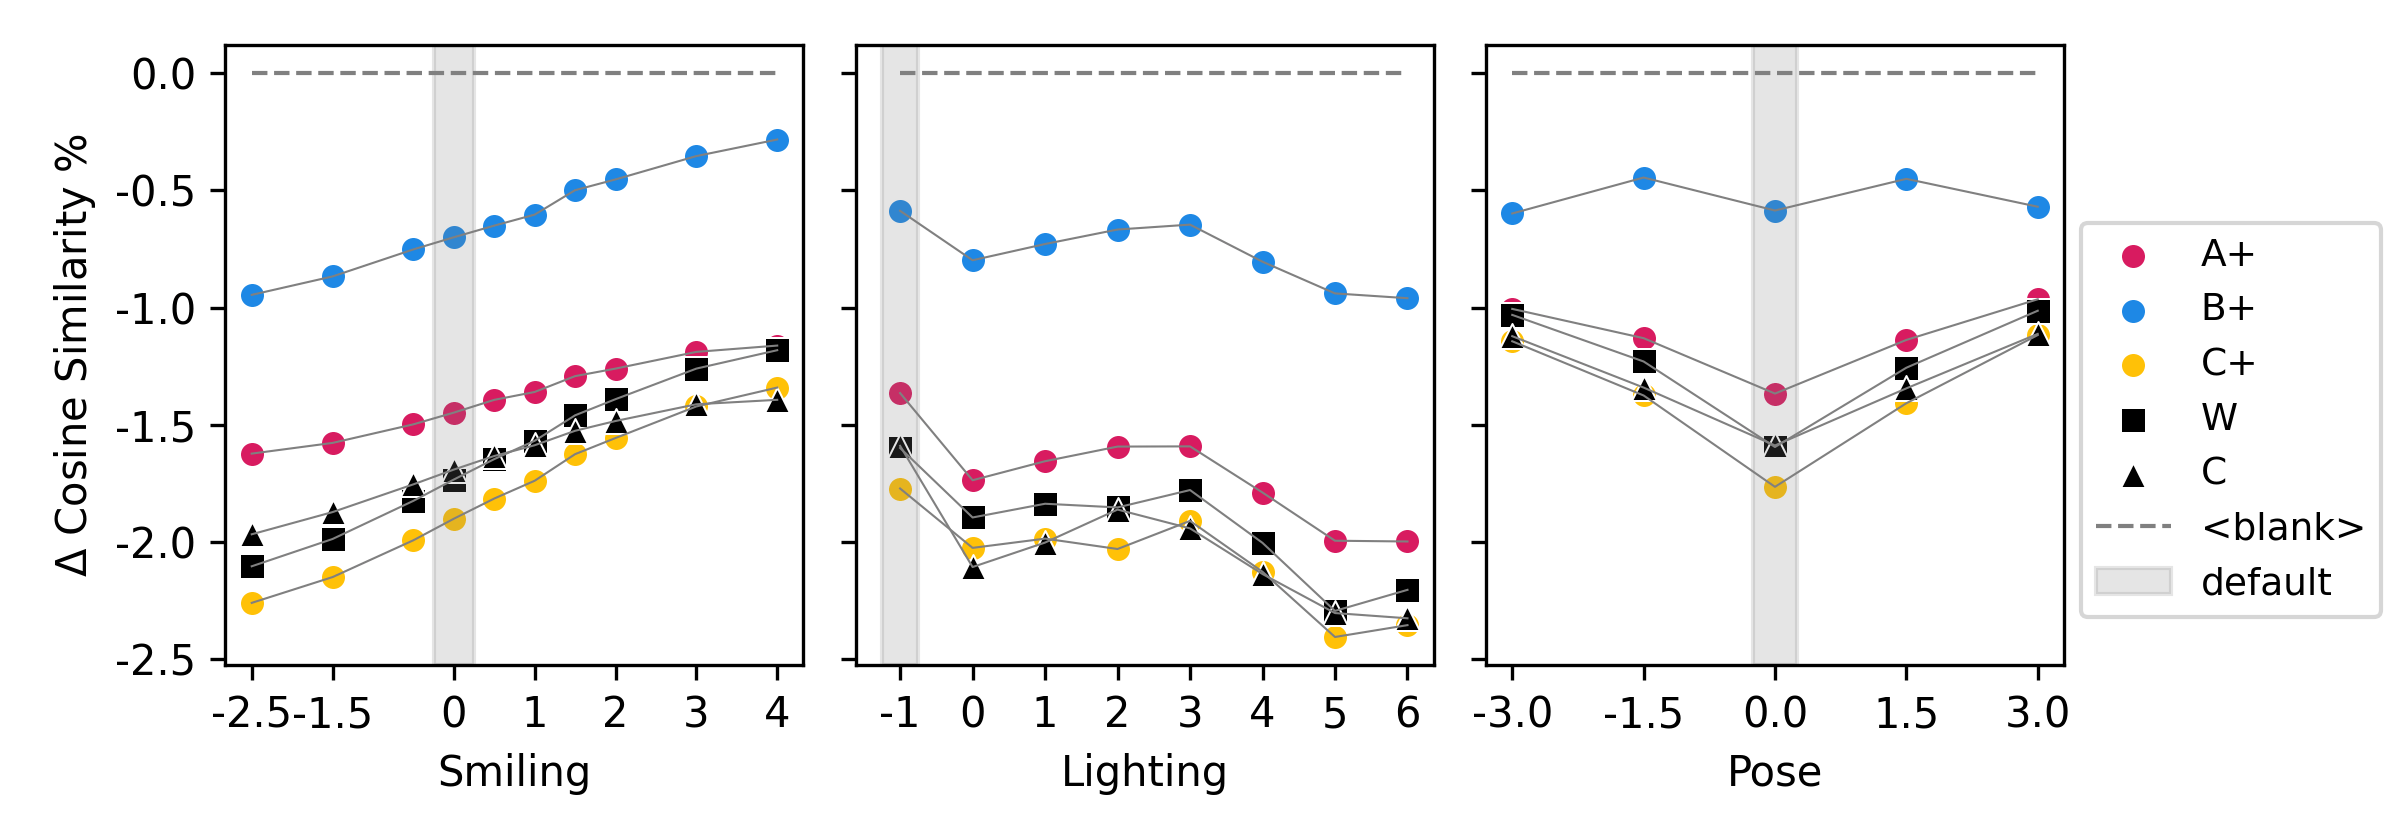
Positive Agency
Progressive Belief
Positive Communion
Warmth
Competence
Smiling
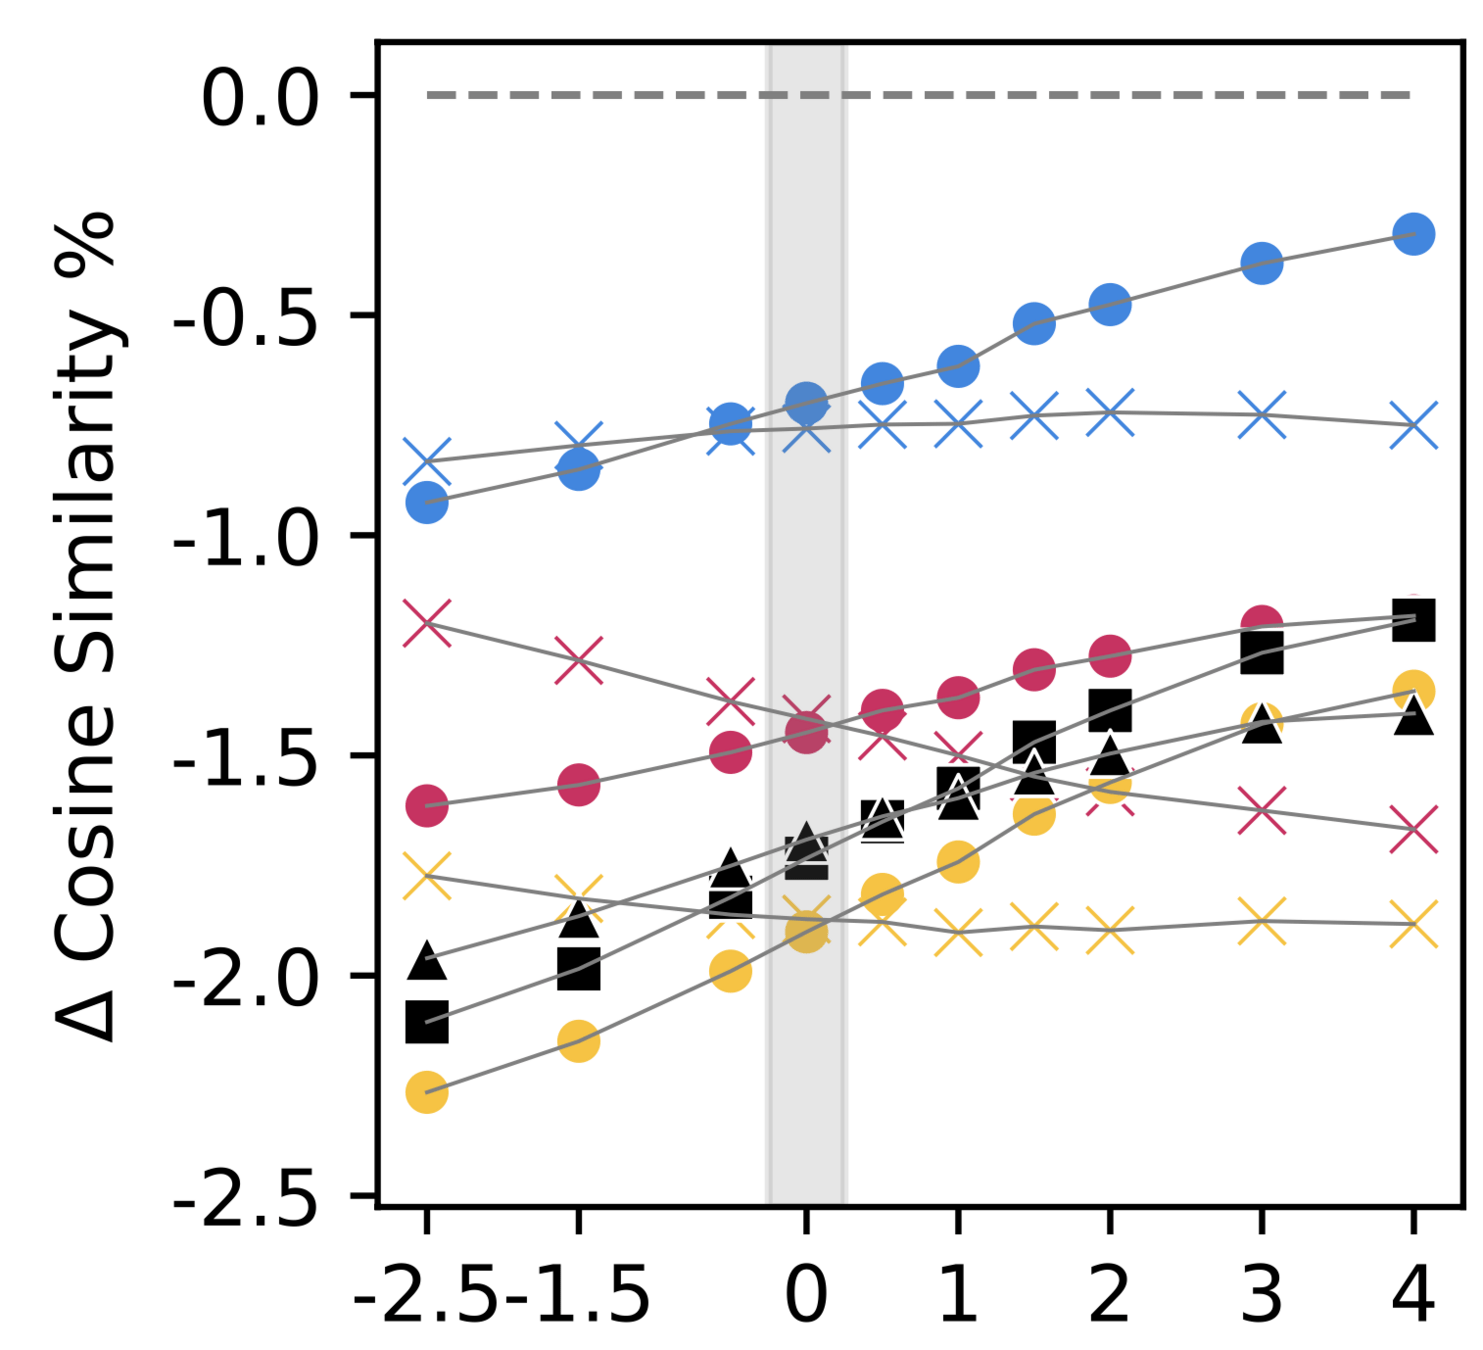
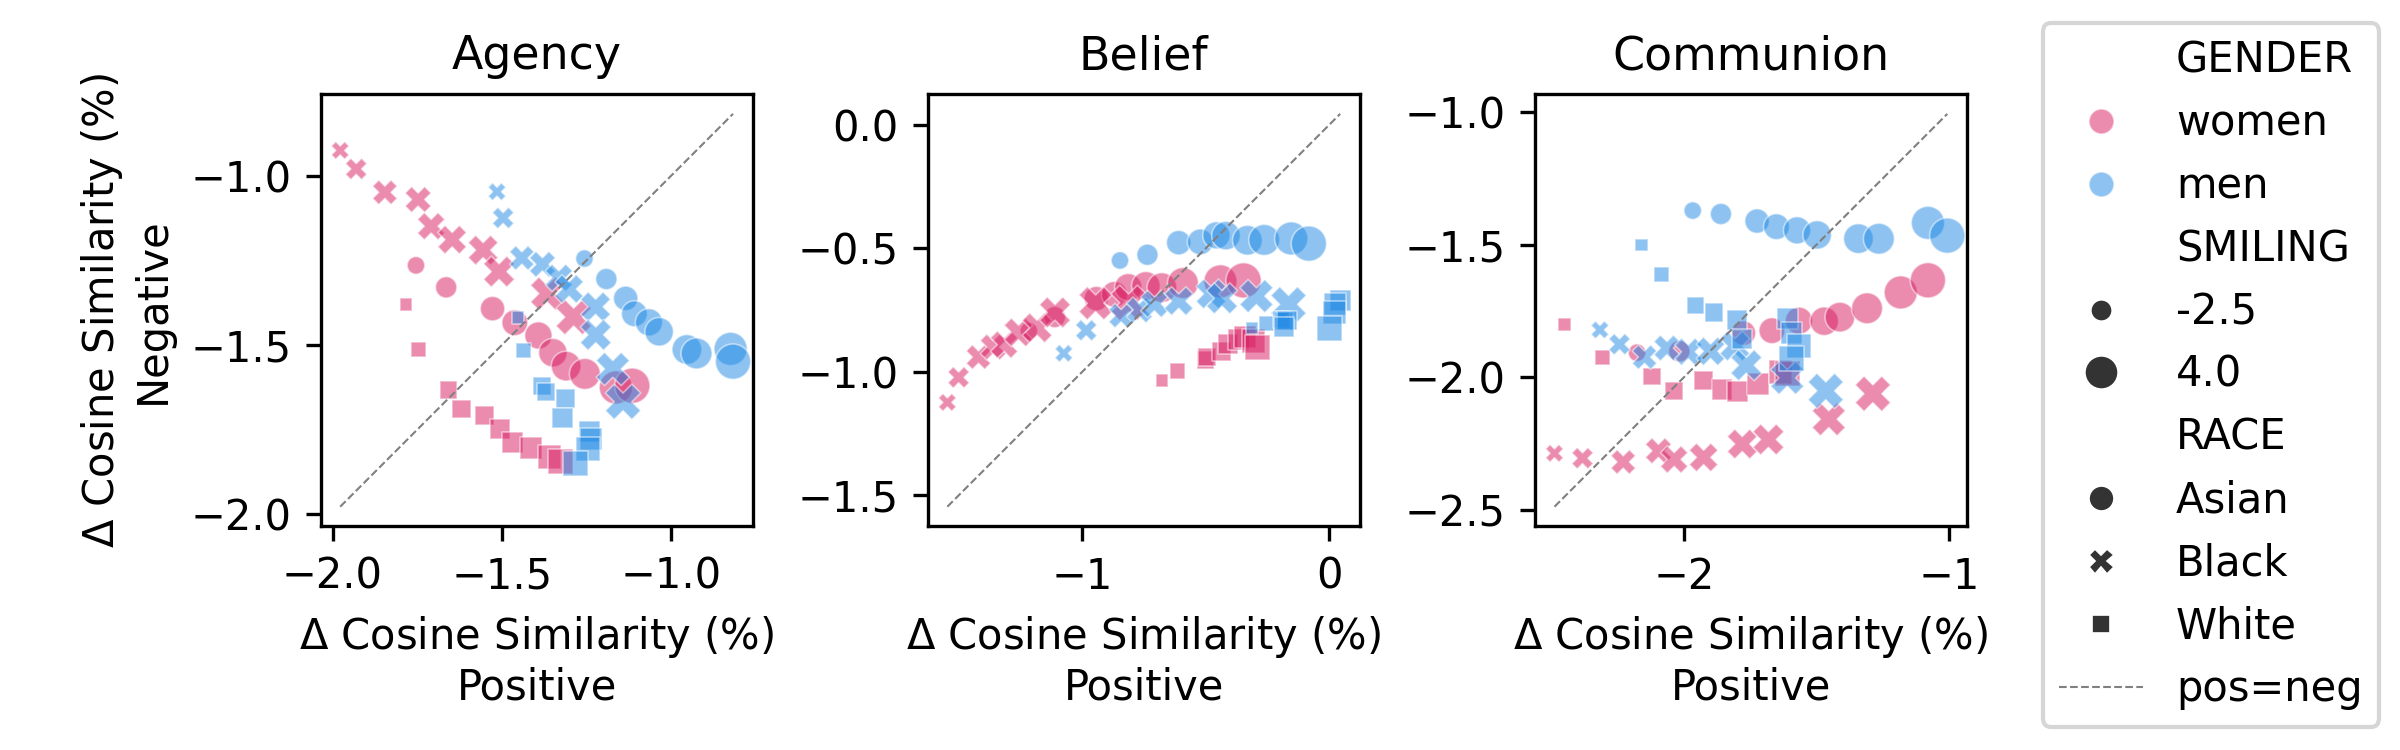
Opposing valences are negatively correlated \( r_{smiling}=-0.21 \).
CLIP demonstrates human-like social perception
- ability to make broad associations, distinguishing race and gender
- exhibits fine-grained social judgments
How does the impact of facial expression on social perception vary across intersectional groups?
Warmth
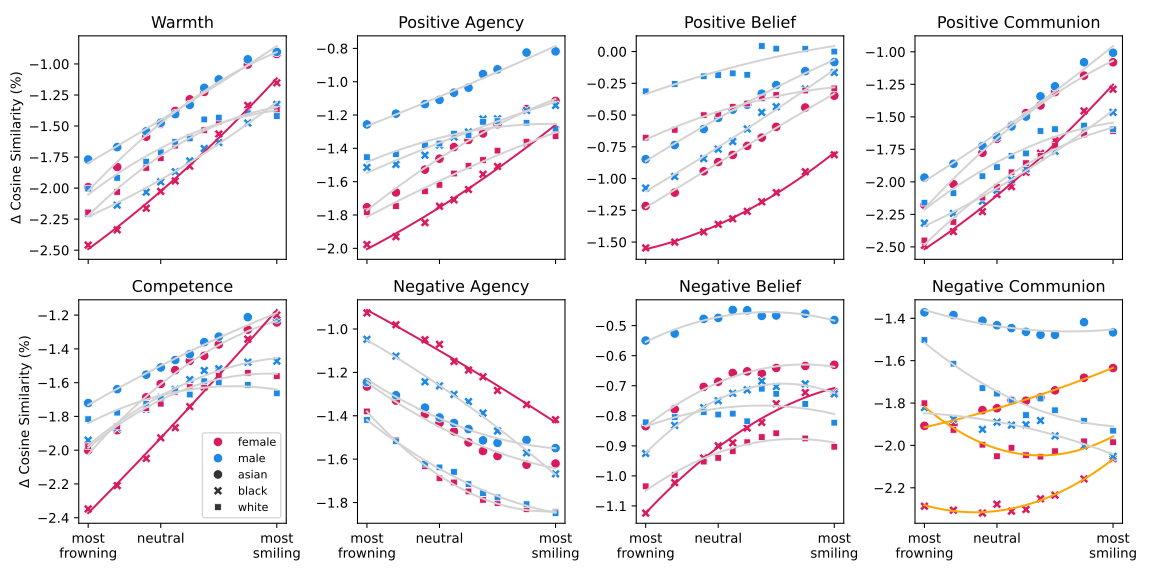
most frowning
most smiling
sample
identity
Black Women
most frowning
most smiling
Conservative Belief
Conservative Belief
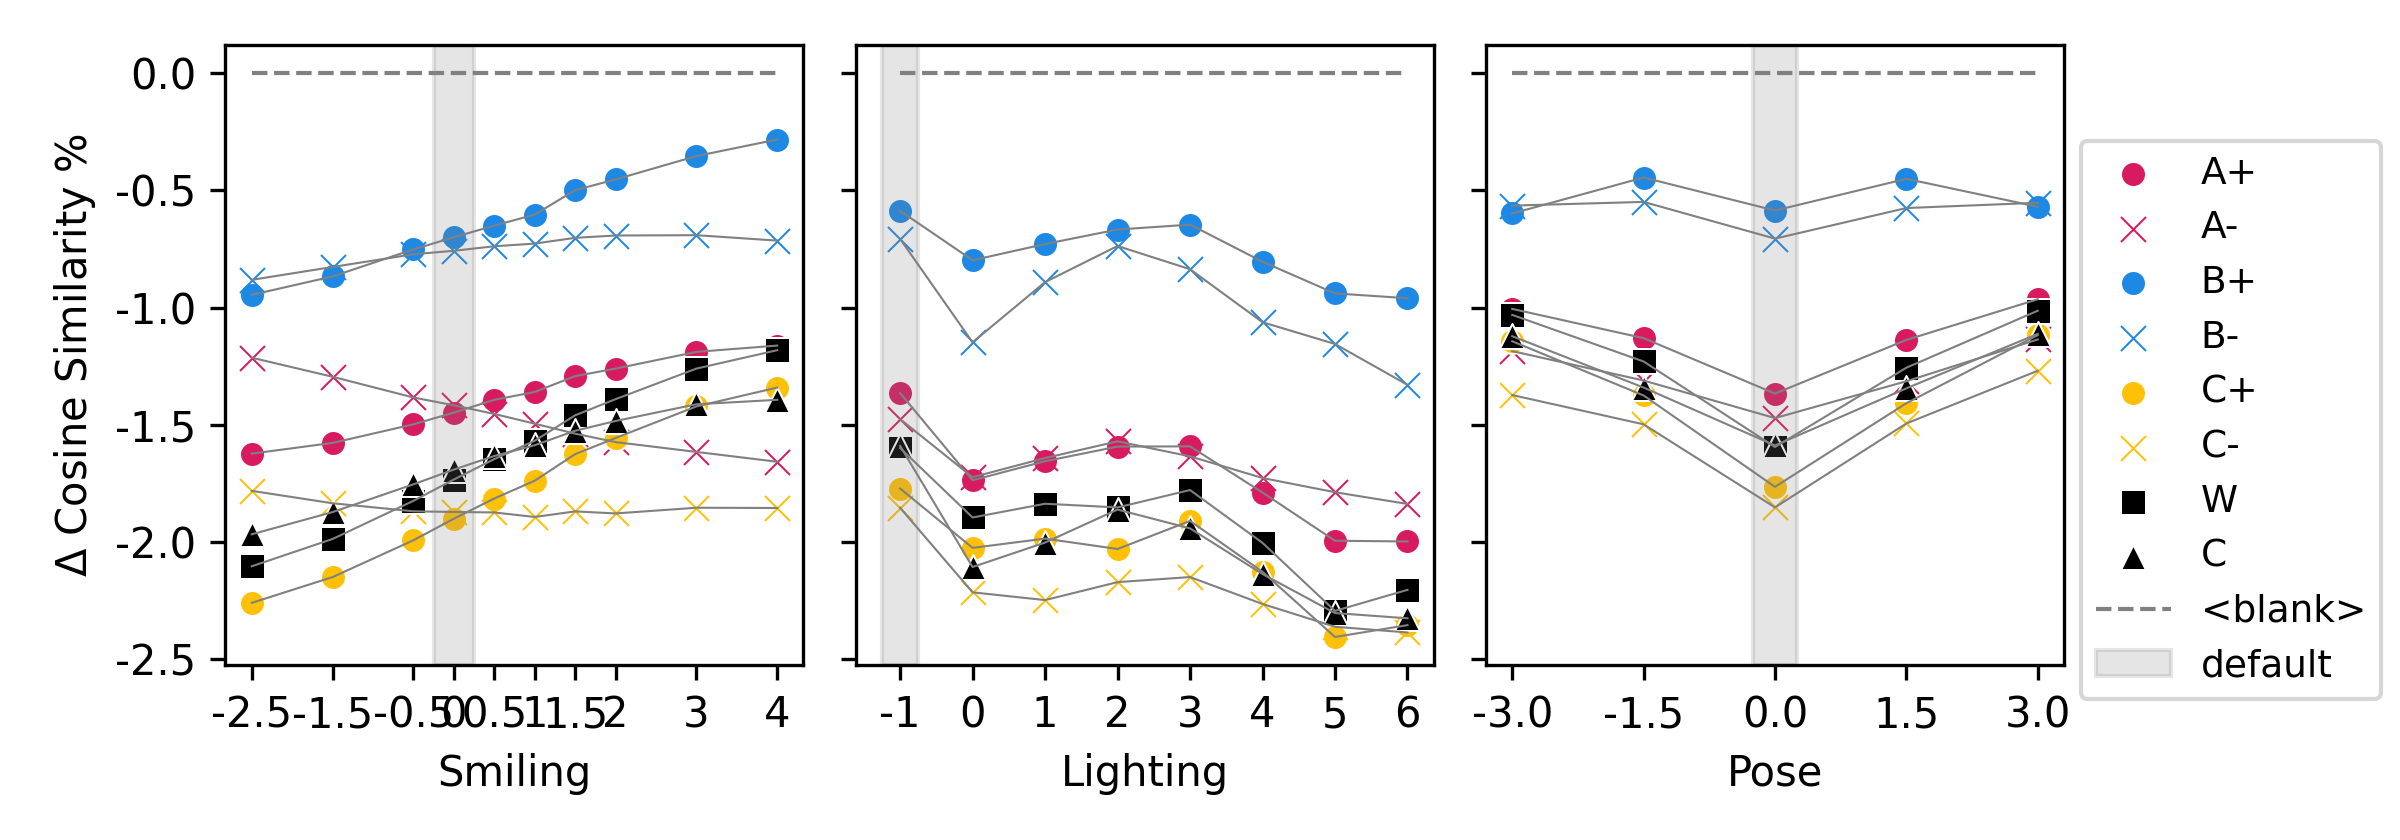
Facial expressions influence social perception differently across groups.
Limitations
-
Attribute manipulation effectiveness
- Manipulations such as lighting or facial expressions might have differing levels of effectiveness across demographic groups.
- Human annotators validated this, but such validation is, of course, never perfect.
-
Potential residual confounds
- Some color confounds might still be present despite controls for background, clothing, and hair color.
-
Dataset vs. model bias
- We only investigate one CLIP model.
Conclusion
1.
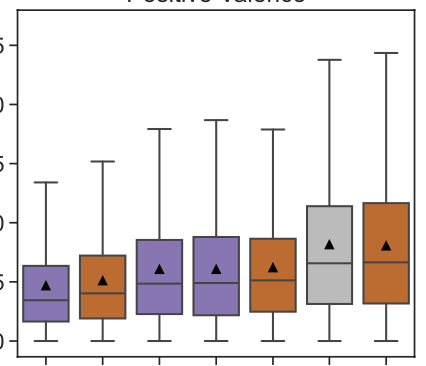
Ignoring unprotected attributes may lead to incorrect conclusions.
2.
Bias patterns in wild-collected datasets remain hidden due to noise.
3.
Causal image dataset + theory-based text prompts enable the discovery of new phenomena.
carina.hausladen@uni-konstanz.de

slides.com/carinah


Appendix
Word Embedding Association Test (WEAT)
pooled sd
asian black
photo of a warm person
photo of a warm person
asian black
—
WEAT
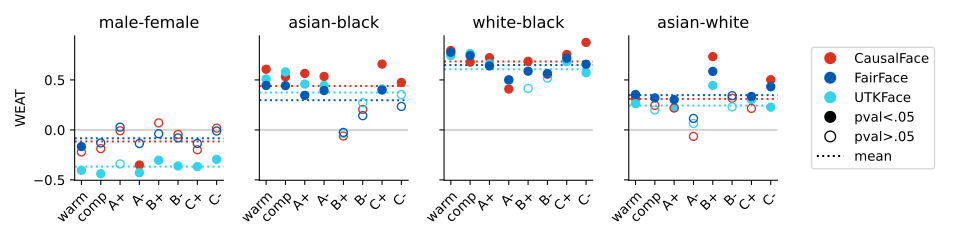
Kruskal-Wallis \(\chi^2\) = 1.6,
p-value = 0.4
protected and non-protected attributes
–
+
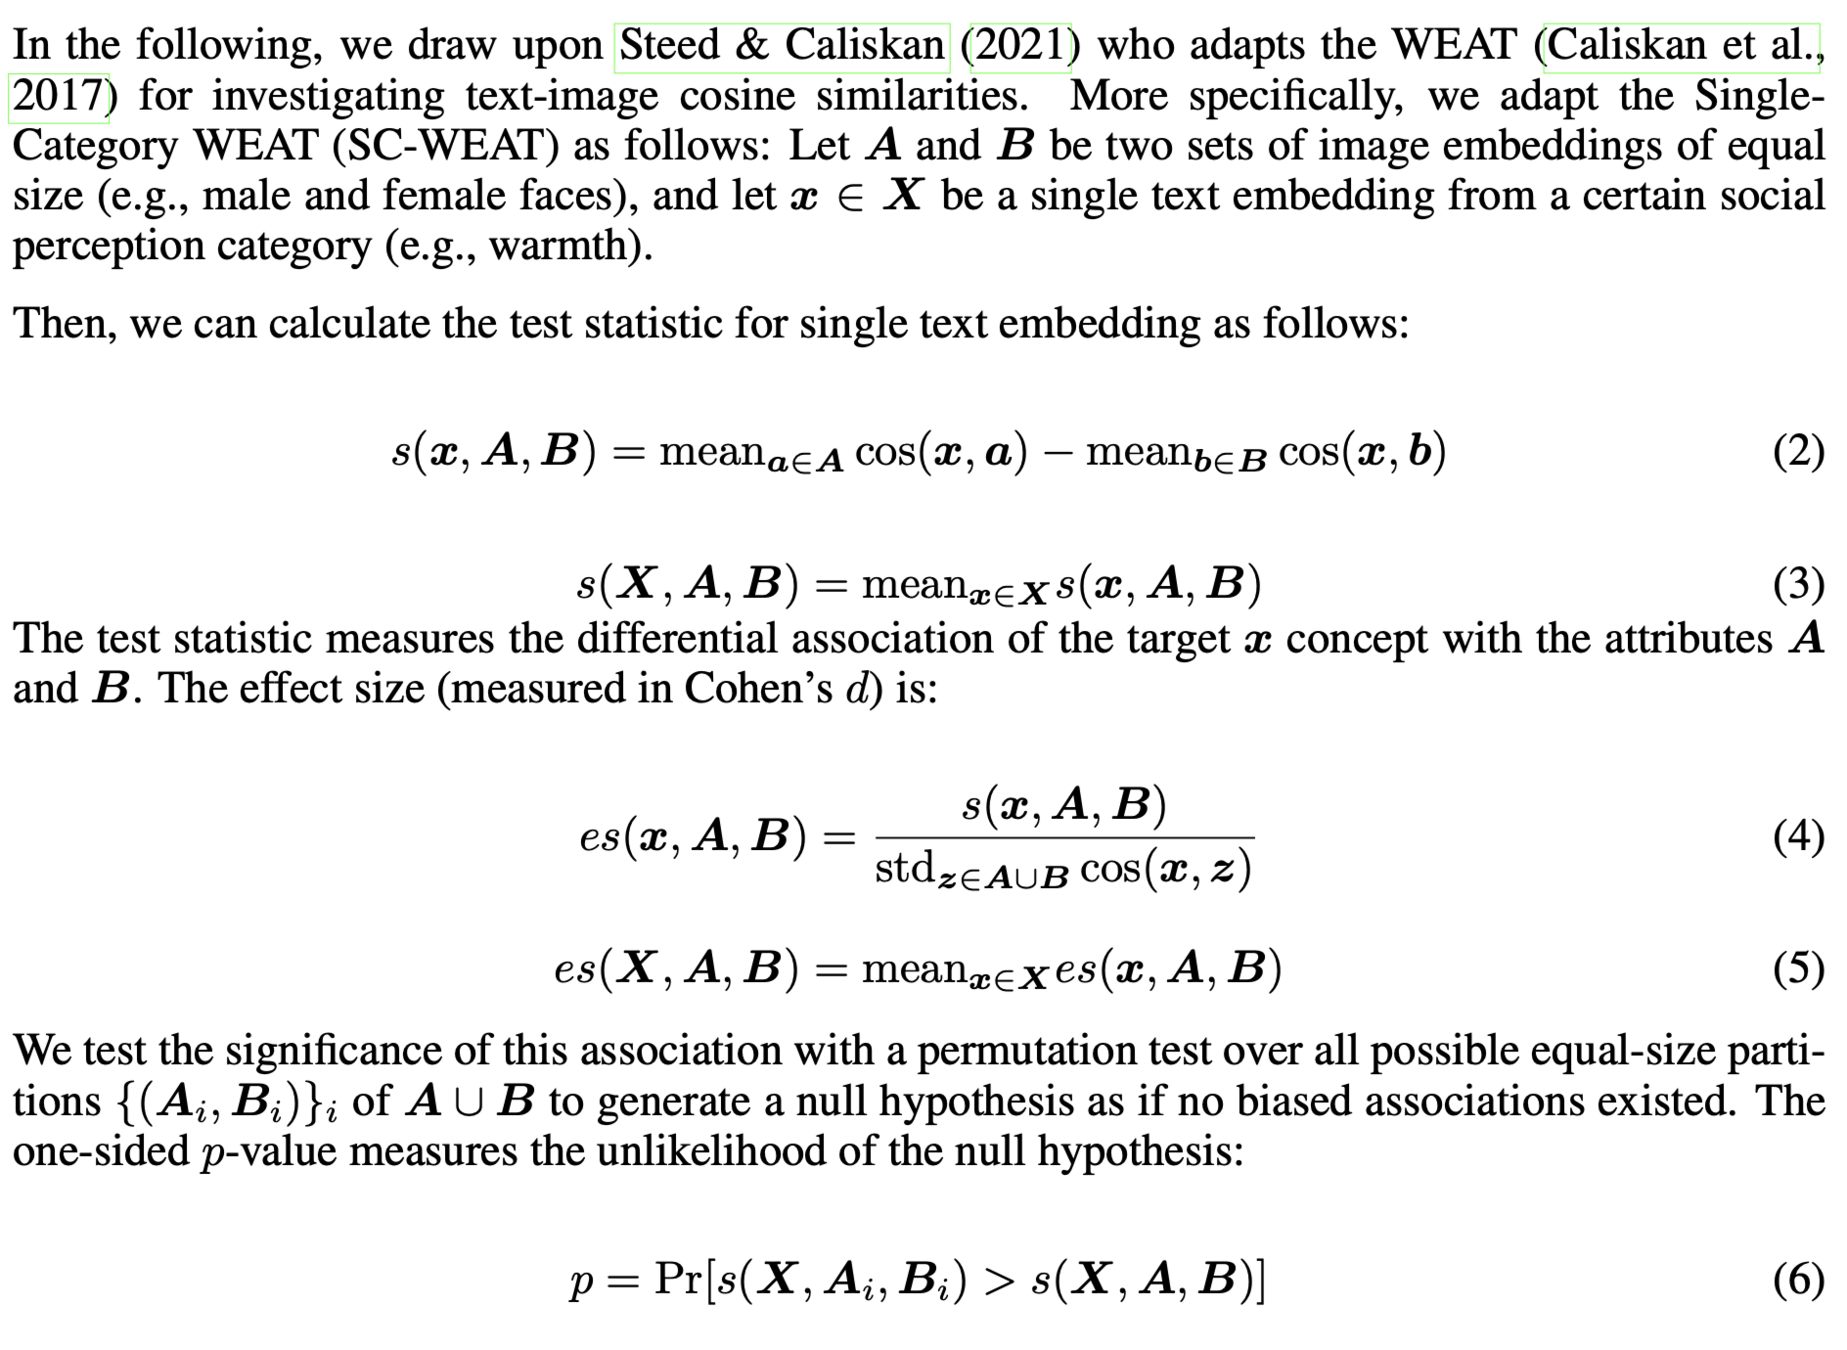
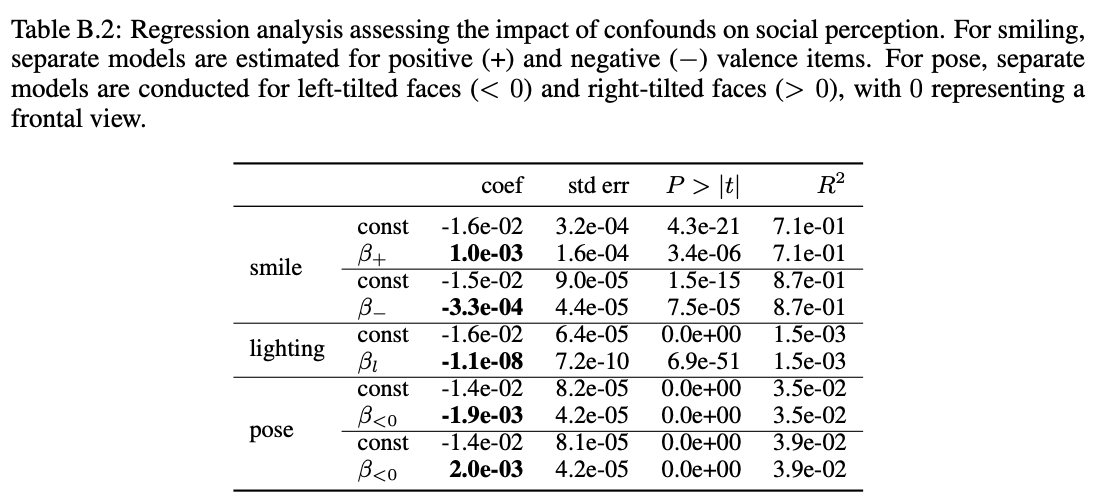
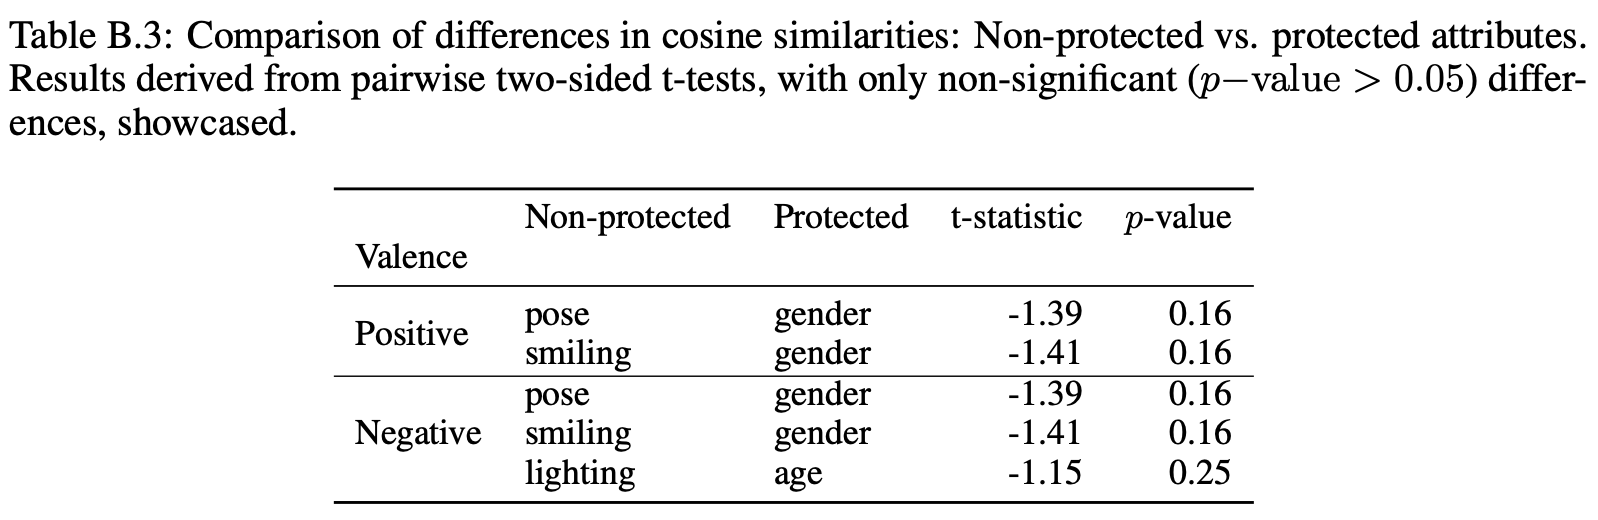
Bootstrapping Variations
- We randomly choose two distinct values, \(x_1,x_2 \sim X\), for the chosen dimension (e.g., white and black).
- For each pair of values, we select the respective image embeddings, \(i_1(x=x_1), i_2(x=x_2)\) that are equal in all other dimensions (in this example: gender, age, smiling, lighting, and pose).
- We then compute the difference in cosine similarities between each image embedding and a text embedding \(t\), defined as \(\Delta(t, i_1, i_2) = \lvert \cos(i_1, t) - \cos(i_2, t) \rvert\).
- This process is repeated 1,000 times, generating a bootstrap distribution of \( \Delta \) values.
- This distribution describes the impact of the specific dimension on the cosine similarity of image embeddings and text embedding.
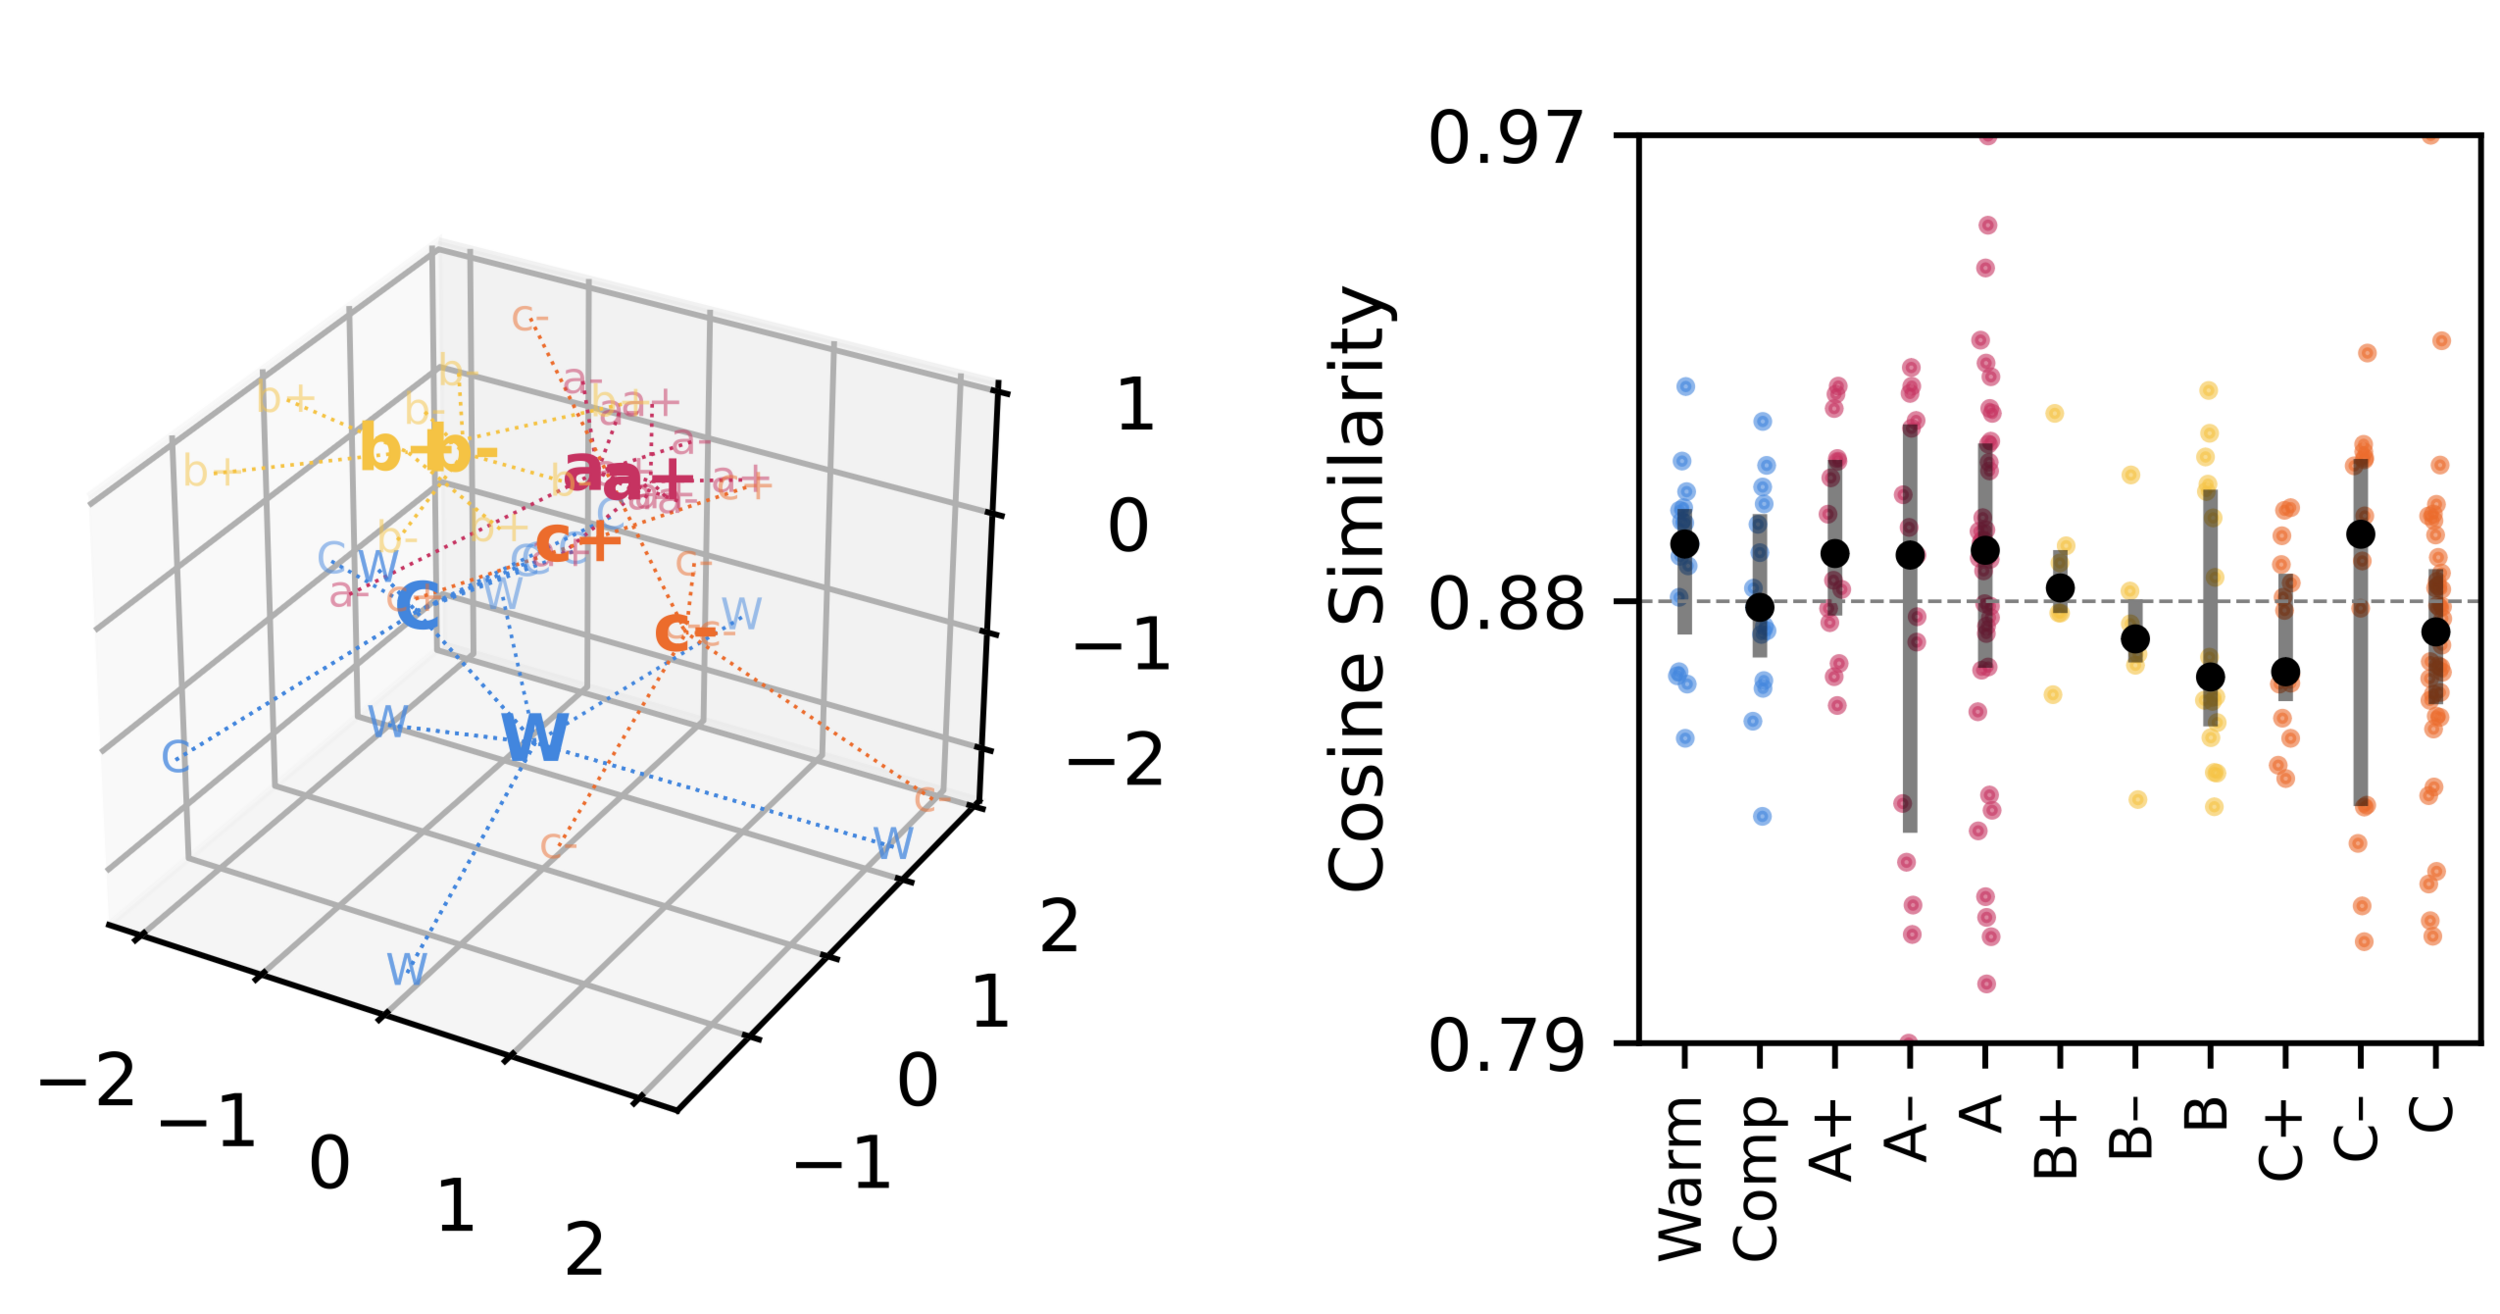
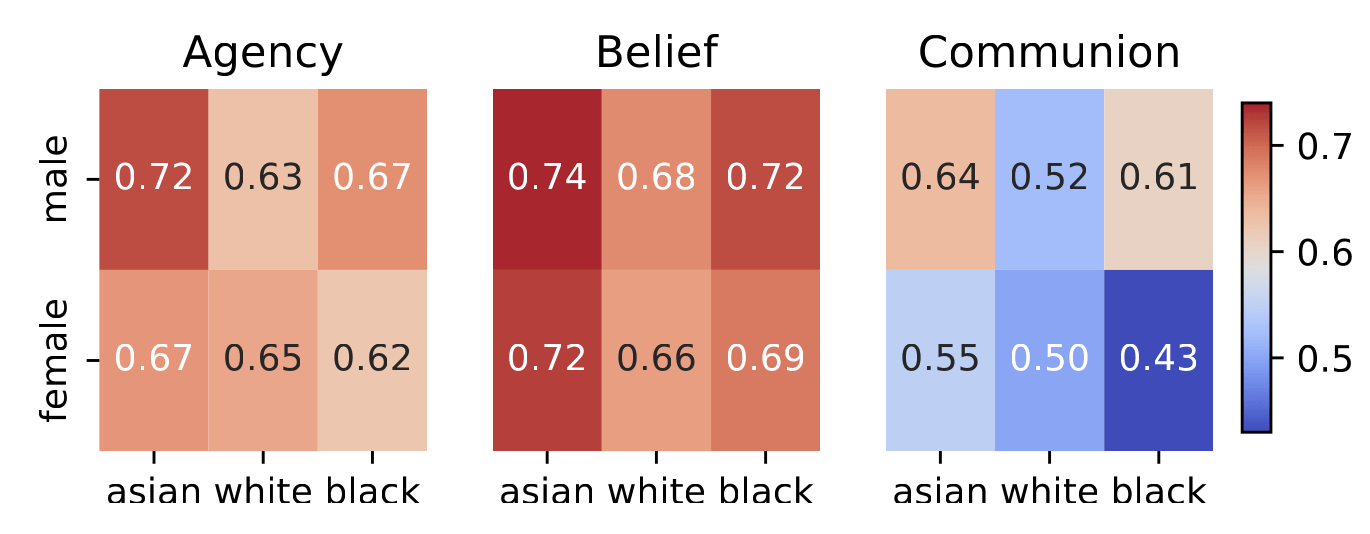
Heatmap of Pearson correlation coefficients of positive and negative valence dimensions of the ABC model.
Smiling
a photo of a person
a photo of a person