Auditing Frontend Performance
3/24/17
and fixing!


Charlie King
Ed Atrero
Thomas Duffy
Who are we?
Topics
-
Principles - Charlie
-
Image Sizes - Ed
-
Caching - Tommy
-
Memory Usage / Profiling - Charlie
-
HTTP2 - Charlie
Principles
Performance is a feature
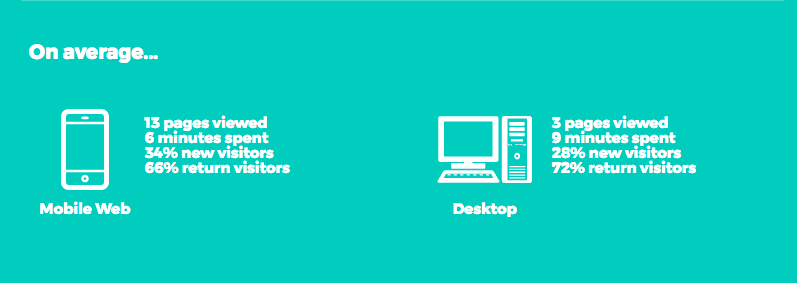
Mobile Web is our first impression (33% new visitors on mobile, 28% new visitors on desktop)
Settling for "good enough" isn't enough
Image Sizes
Reducing Payload
"Nearly half of web users expect a site to load in 2 seconds or less, and they tend to abandon a site that isn’t loaded within 3 seconds"
source: Akamai and Gomez.com

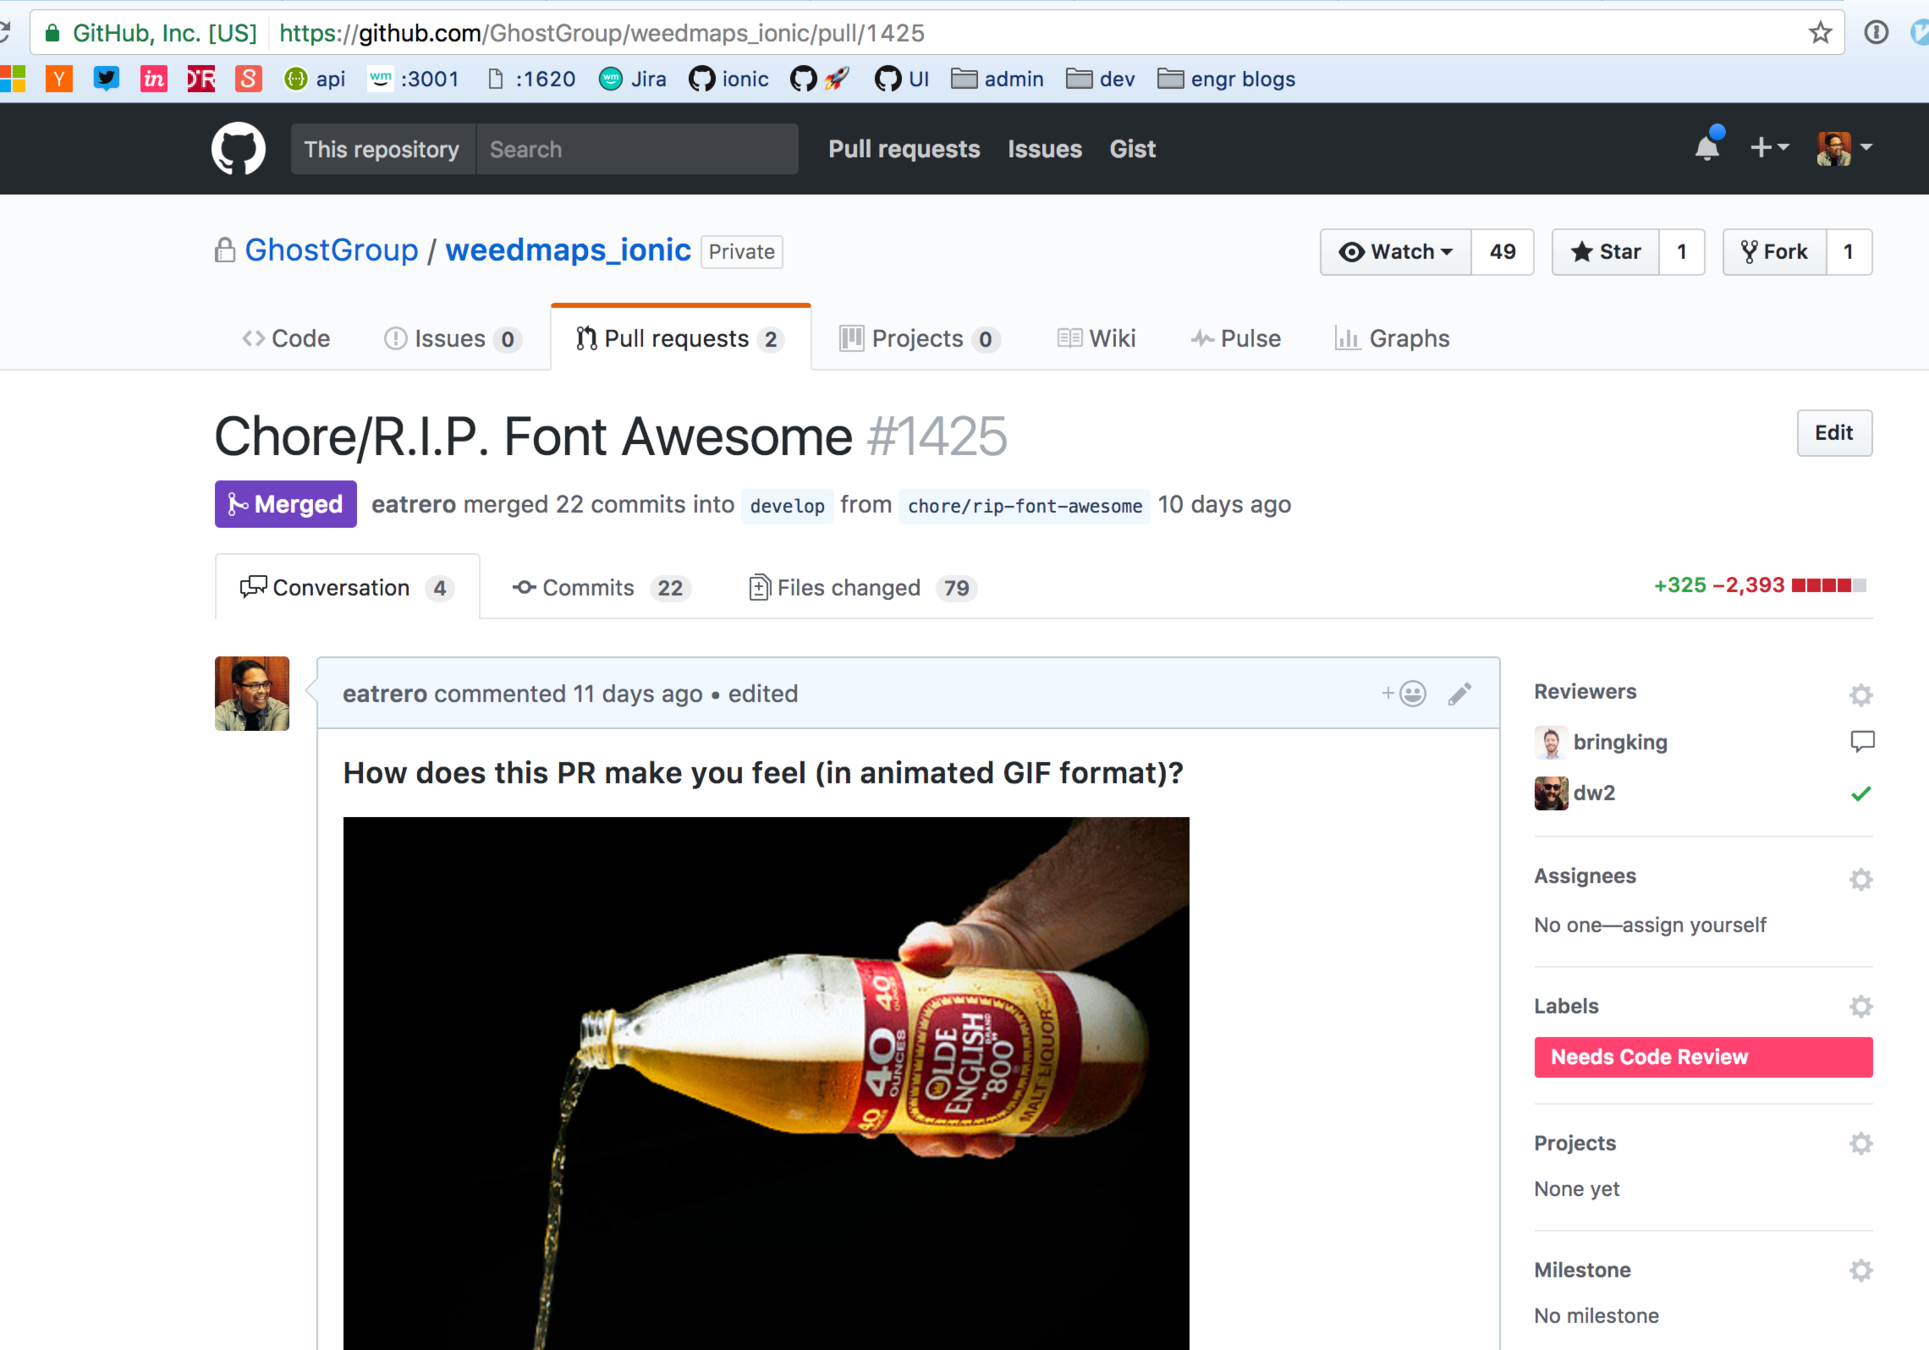
Only using 22 icons from FA
Saved 100kb

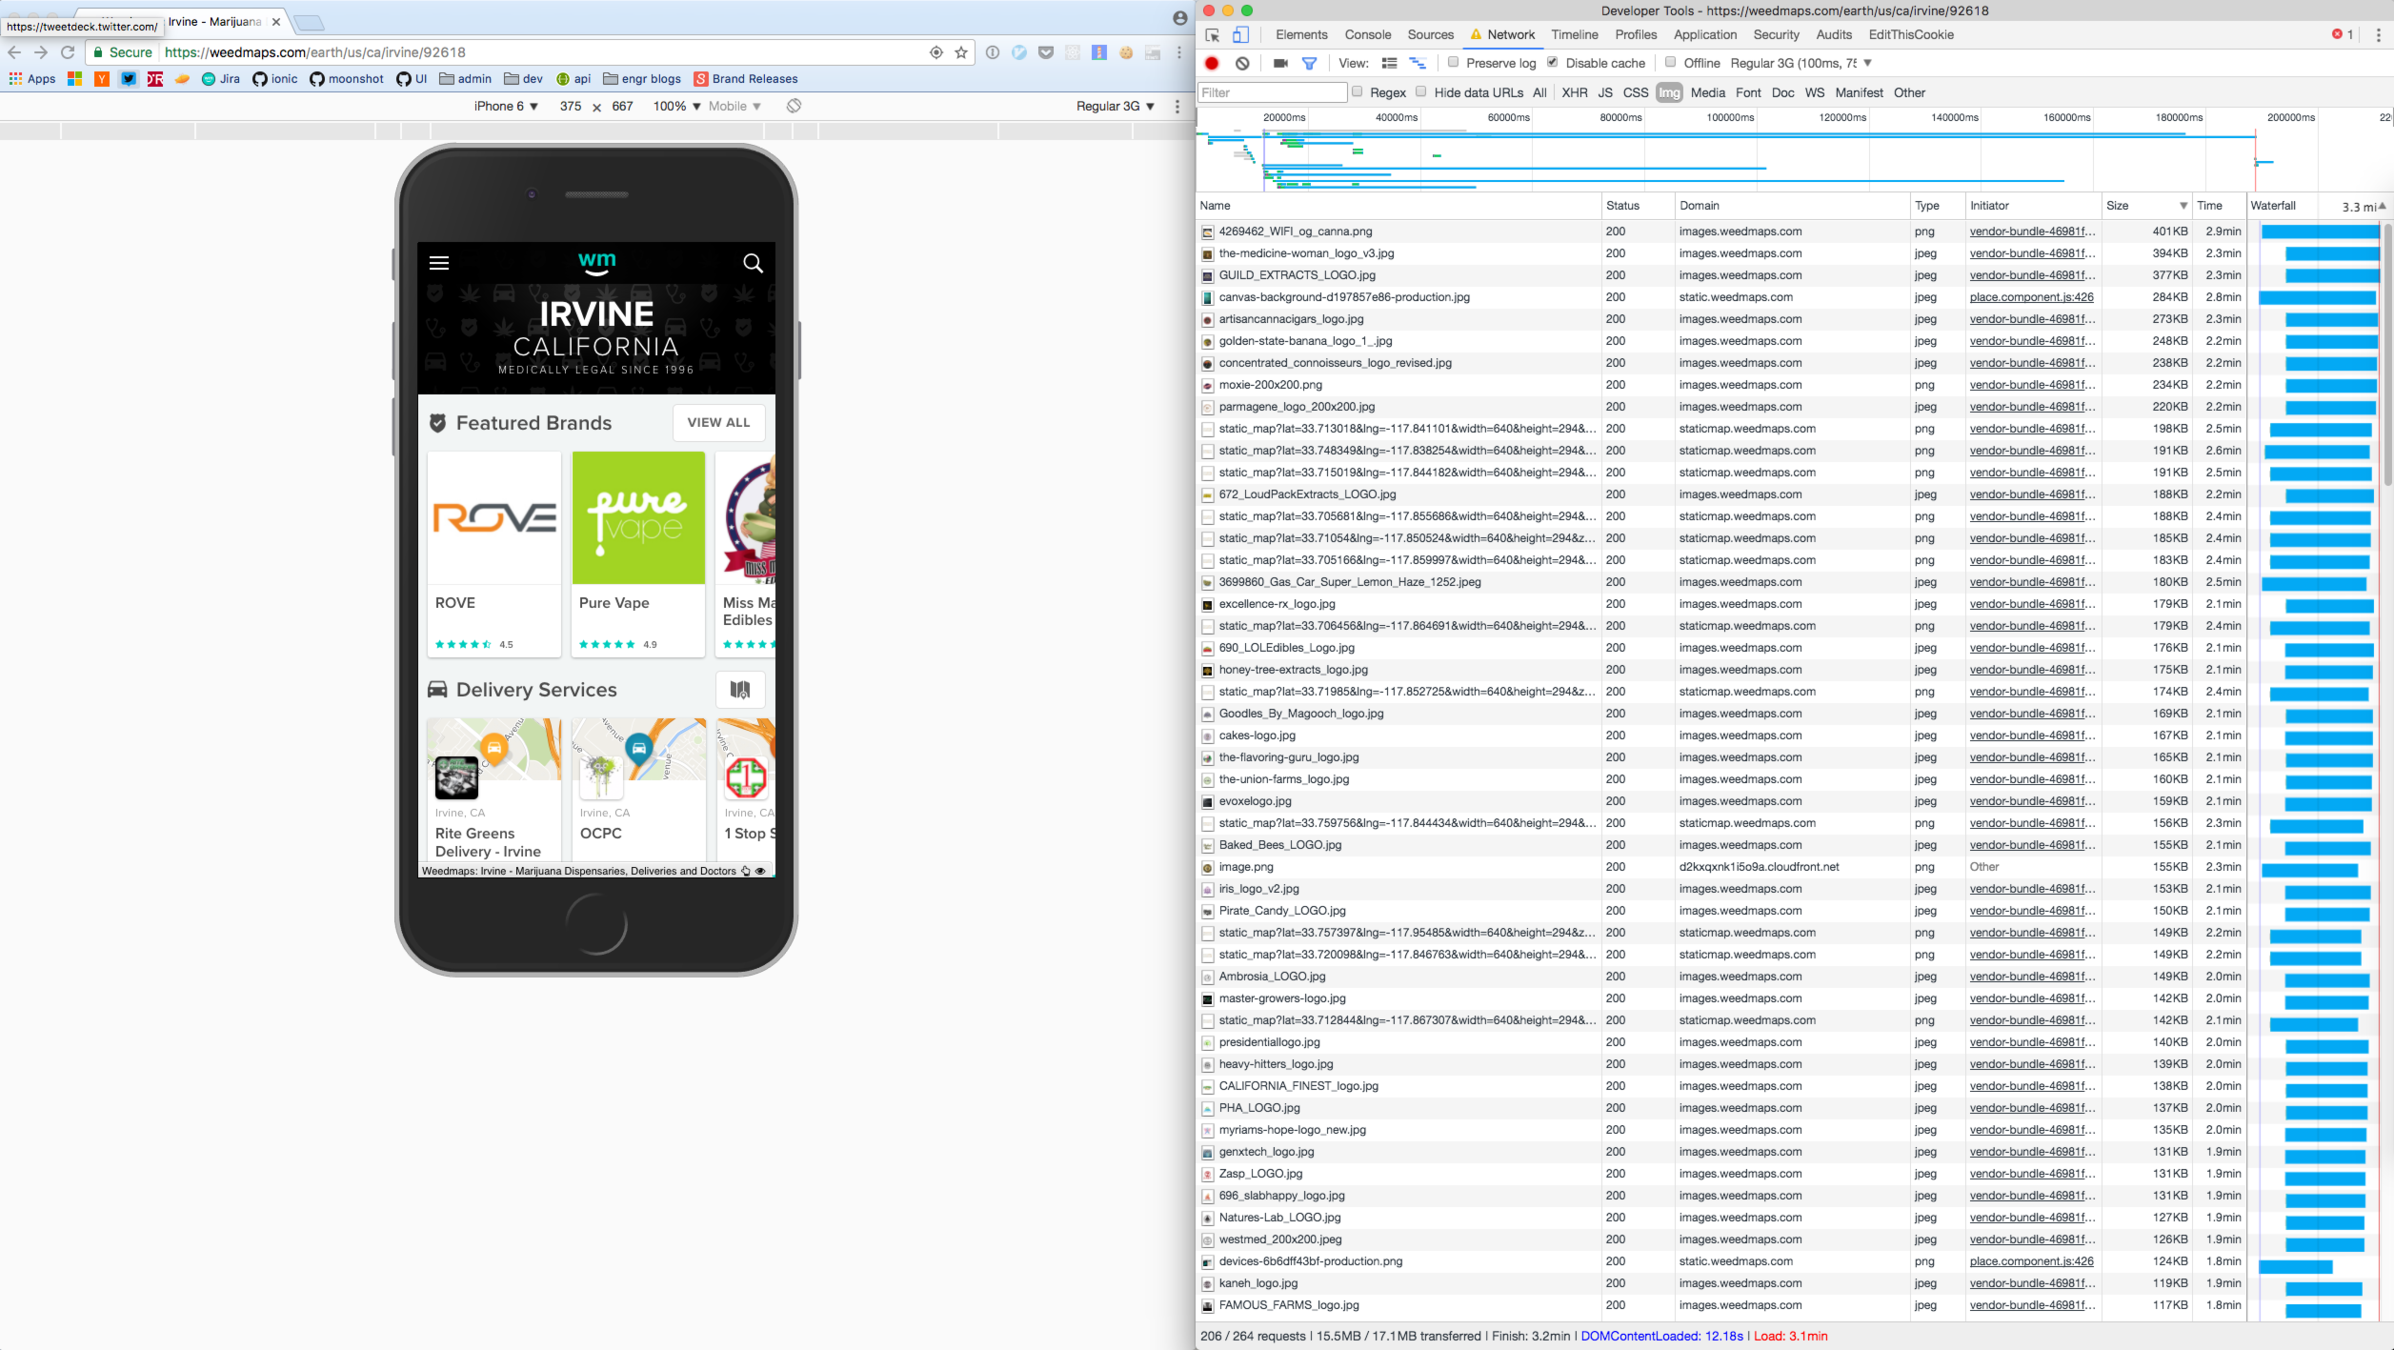
15.5MB of images
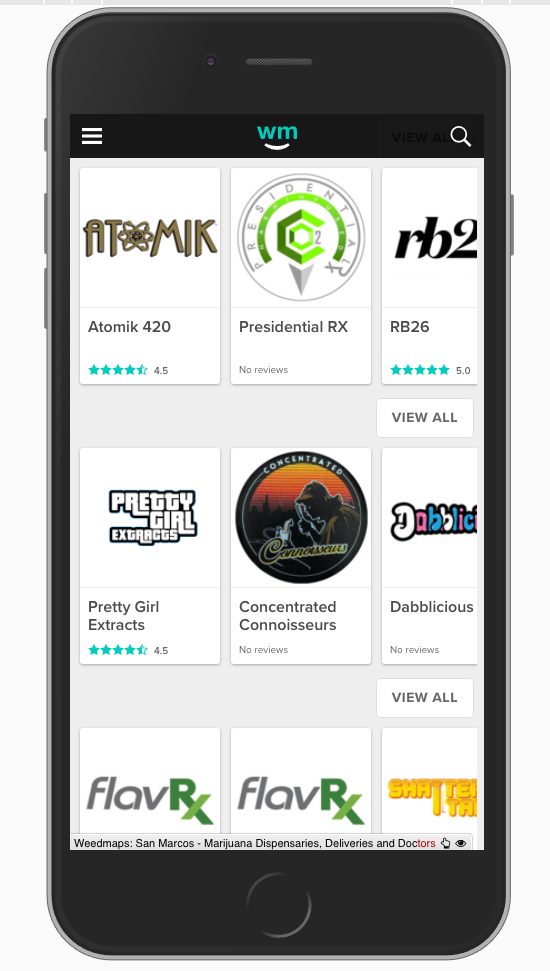
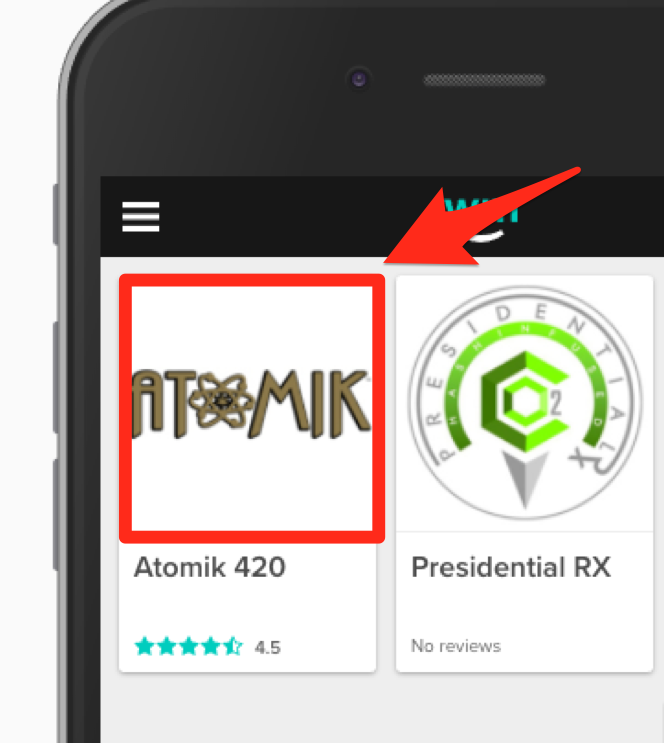
140 x 140px
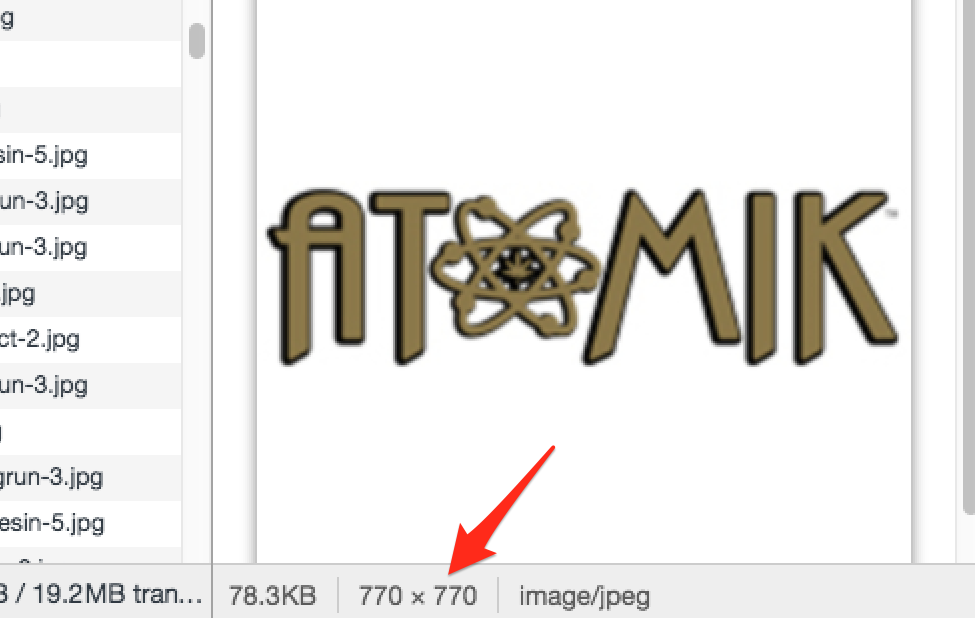
Use 250X250px logos
<wm-brand-card
  class="scroll-card brand-card home"
  ng-repeat="brand in ::category.brands"
  brand="brand"
  subtitle-name="Products"
  image="{{ brand.avatar_image.large_url }}"
  ng-click="category.clickCategoryCard($index, brand)">
</wm-brand-card>
<wm-brand-card
  class="scroll-card brand-card home"
  ng-repeat="brand in ::category.brands"
  brand="brand"
  subtitle-name="Products"
  image="{{ brand.avatar_image.small_url }}"
  ng-click="category.clickCategoryCard($index, brand)">
</wm-brand-card>
REMOVED FONT AWESOME
SAVED 100KB
USED PROPERLY SIZED BRAND IMAGES
SAVED 6.5MB

ME
Next Steps
- Add optimized sizes to image processing pipeline for brand and listing cards
save 70% by using 140x140 images
Caching
Caching
Caching
What does it mean and how can we benefit from it?

To store data locally in order to speed up subsequent retrievals.
Definition of Caching
http://www.pcmag.com/encyclopedia/term/39177/cache
Why is weedmaps.com a good candidate for caching?


A lot of initial network calls.

Deliveries
Brands
User Location
Dispensaries
Doctors
Ad server
Wayso
weedmaps tv
Currently
the user has to wait while we do our data calls and watch a loading animation.

The first time the user hits our site, we save their location and data calls on their device.
SOLUTION
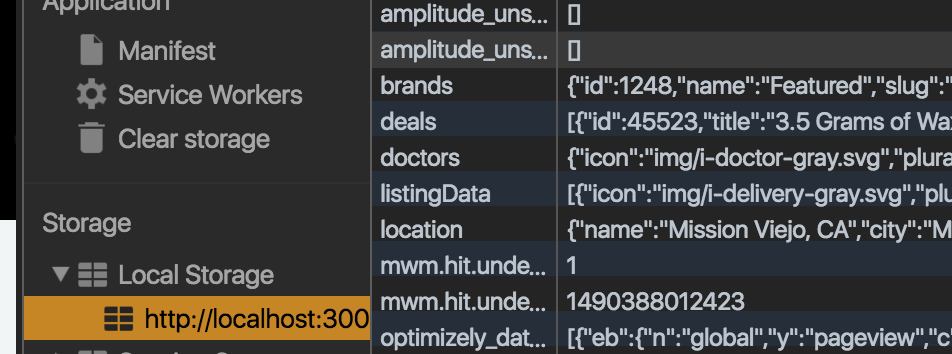
The next time the user visits the site, we immediately load the cached data and replace it after the network calls come back.
Return Visit


Local Storage
Updated data from servers
Cached data UX
Comparison
Cached

Not Cached
~7s before seeing cards
~1s before seeing cards
Memory Usage / Profiling
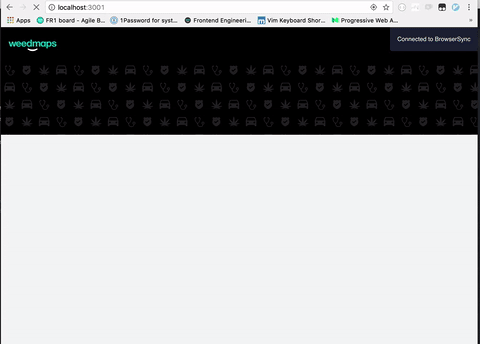
Symptom: The homepage feels slow on my mobile device
Process
Desktop seems okay.. Maybe we are using too much memory (which my phone has much less of) ?

Chrome -> Window -> Task Manager
~250MB Native Allocations (DOM Nodes)
~90MB JS Heap Allocations (our JS code)
~3,000 DOM Nodes
Diagnoses
We create too many DOM nodes. ~3,000 depending on the region
Creates high initial memory usage, then too much GC pressure
Possible Fixes
Reduce total card count per category (listings, brands) to 5

220MB Native Allocations (DOM Nodes)
68MB JS Heap
2,106 DOM Nodes
Symptom: The homepage takes a long time become interactive
Process
Try to figure out where time is being spent.

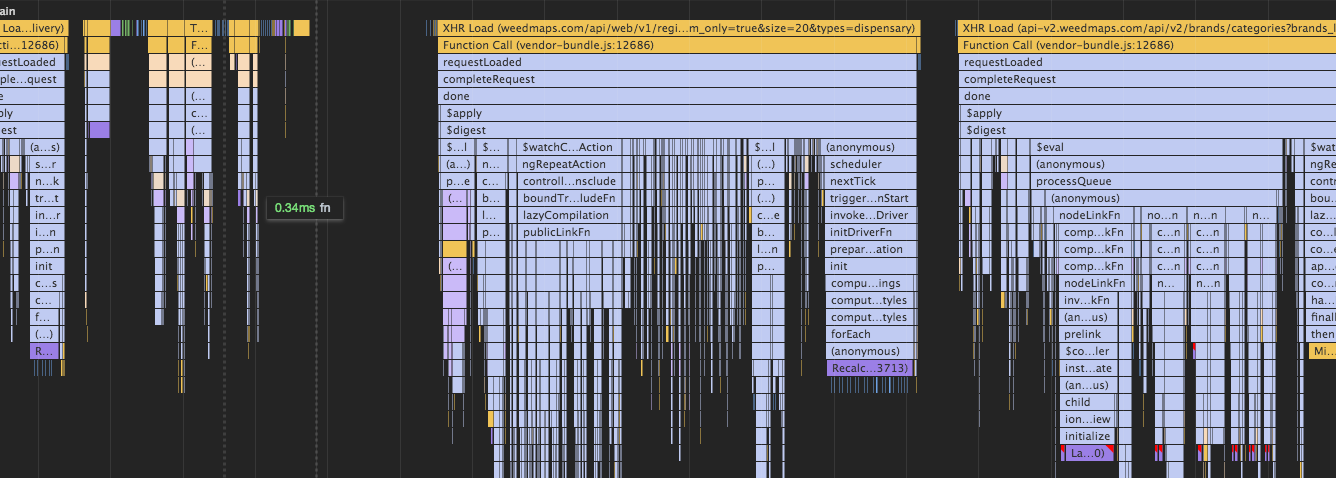
Flame graphs to the rescue!
Chrome -> DevTools -> Timeline -> Record
Diagnoses
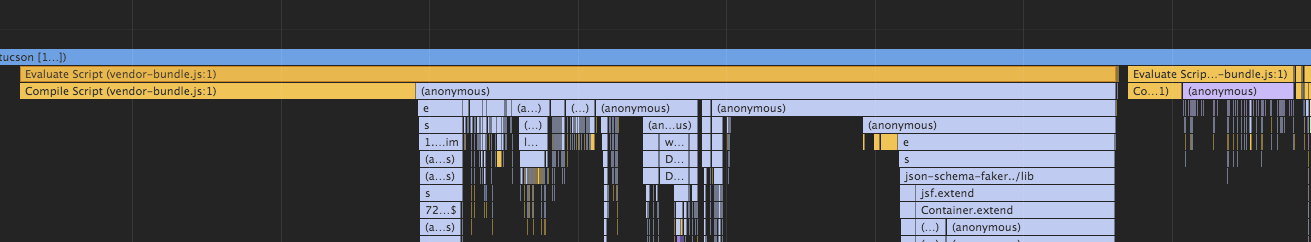
133ms Compile
369ms Eval
Our vendor bundle is very large, takes time to parse and compile
Diagnoses
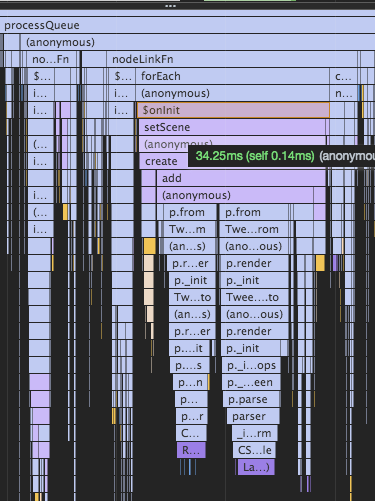
Homepage animation setup is one of our longest running user-land functions.
34ms on-cpu
Diagnoses
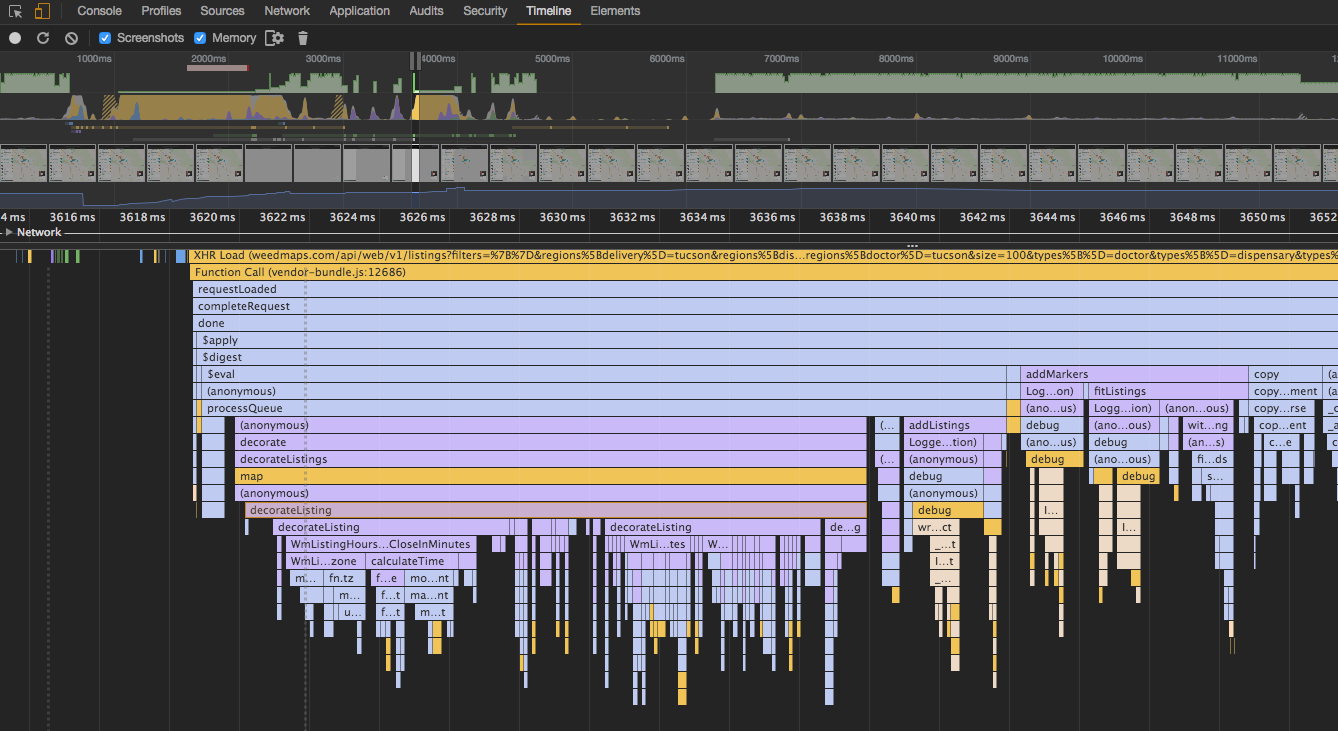
Map spends the most time decorating listings
~20-30ms on-cpu
Possible Fixes
Flame graphs are great for finding hot functions to optimize
✅ Remove JS based animation for homepage
🔲 Optimize decorateListings function
Reduce the size of the vendor bundle to decrease parse/compile times

Moonshot will cut this by ~50%
Symptom: The homepage UI is janky
Process
Are we causing re-layout and reflow on the page? Or how many times is the DOM being updated?
Chrome -> DevTools -> Timeline -> Record
Diagnoses
reflow
reflow
reflow
reflow
Too many re-layout operations
Possible Fixes
Timeline tool also shows re-layout operations
Batch all operations by loading in-memory and NOT attaching to Angular Scope until complete -> 1 layout operation
Load more data in a single request (within reason), e.g. top 5 listings for each type in a single call
Serve HTML!
Moonshot will serve HTML from NodeJS
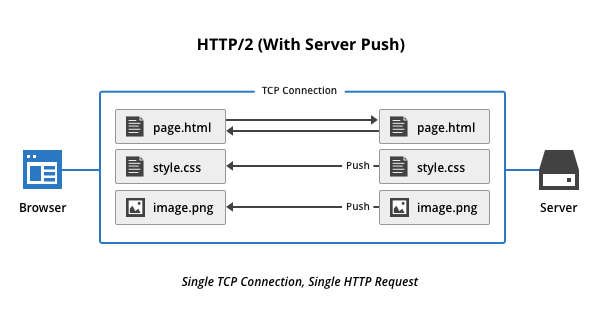
HTTP2
Multiplexing e.g. multiple requests to the same origin at the same time!
Front-end Benefits


Old and busted
New hotness
Core API / WmAPI - 🚫
Roll-out
MapBox Map Tiles - 🚫
Ionic static assets ✅
Core static assets ✅
Image server ✅
Static map tile server (going away) ✅
Avatar CF/S3 assets ✅
Future Optimizations
Server Push
Possible with updates to Cloudfront and/or Moonshot