機器學習的可解釋性
ML Explainability

模型分析
Model Insightes
分析面相
- 模型認為哪些特徵比較重要
- 單一預測裡,特徵如何影響預測結果
- 全部預測裡,特徵如何影響預測結果
分析可以拿來...
- 調試
- 特徵工程
- 調整未來的數據收集
- 為人類決策提供訊息
- 建立信任
調試
在這個世界上有很多數據都是不可靠、有誤差的,因此了解模型預測的依據並與我們對現實的理解來比較有助於改善這個情形
特徵工程
Feature Engineering
透過重複轉換原始數據或是之前提取出來的特徵來增加特徵數量以增加模型準確度
特徵工程的用處
在只有少量參數的時候可以靠自己的理解去完成,但當有大量的參數時就需要使用特徵工程
調整數據蒐集方向
透過分析模型來了解之後要蒐集哪些數據,以及了解現在蒐集的數據有沒有用
調整數據蒐集方向
或許你現在只能透過在網路上下載來獲得數據,但是未來到大公司或是研究機構開始有能力蒐集數據時,就需要提前了解有沒有必要蒐集某些數據,因為通常自己蒐集數據很貴or很麻煩
提供人類決策方向
有很多重大決定是需要人類來判斷的,對於這些情況提供分析會比提供預測結果來的好
(ex.公司未來方向、颱風停班停課)
建立信任
單純給出預測很難說服別人,但是有分析的預測往往能夠獲取信任
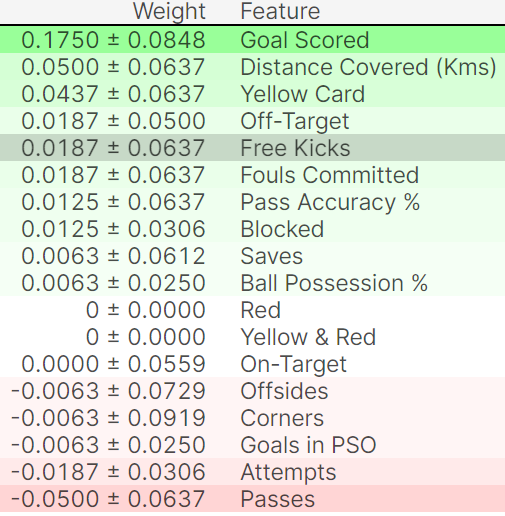
排序重要性
Permutation Importance
特性
- 快速
- 廣泛使用
- 易於理解
運作方式
把某一個參數隨機打亂,以此了解這個參數的重要性
Code
import eli5
from eli5.sklearn import PermutationImportance

perm = PermutationImportance(my_model, random_state=1).fit(val_X, val_y)
eli5.explain_weights(perm, feature_names = val_X.columns.tolist())
fifa 2018 MVP預測
部分相依圖
Partial Dependence Plots
原理
排序重要性顯示了哪個參數影響預測最多,而部分相依圖顯示參數影響預測的方式
應用
- 控制其他房屋的特徵,經度和緯度對房價有什麼影響
- 預測健康差異是由於飲食差異嗎
運作方式
透過改變其中一個參數(X軸)來預測答案(Y軸),來繪出關係圖
Code
import numpy as np
import pandas as pd
from sklearn.model_selection import train_test_split
from sklearn.ensemble import RandomForestClassifier
from sklearn.tree import DecisionTreeClassifier

data = pd.read_csv('../input/fifa-2018-match-statistics/FIFA 2018 Statistics.csv')
y = (data['Man of the Match'] == "Yes")  # Convert from string "Yes"/"No" to binary
feature_names = [i for i in data.columns if data[i].dtype in [np.int64]]
X = data[feature_names]
train_X, val_X, train_y, val_y = train_test_split(X, y, random_state=1)
tree_model = DecisionTreeClassifier(random_state=0, max_depth=5, min_samples_split=5).fit(train_X, train_y)
顯示決策樹
from sklearn import tree
import graphviz

tree_graph = tree.export_graphviz(tree_model, out_file=None, feature_names=feature_names)
graphviz.Source(tree_graph)
部分相依圖
from matplotlib import pyplot as plt
from pdpbox import pdp, get_dataset, info_plots

# Create the data that we will plot
pdp_goals = pdp.pdp_isolate(model=tree_model, dataset=val_X, model_features=feature_names, feature='Goal Scored')

# plot it
pdp.pdp_plot(pdp_goals, 'Goal Scored')
plt.show()
2D部分相依圖
features_to_plot = ['Goal Scored', 'Distance Covered (Kms)']
inter1  =  pdp.pdp_interact(model=tree_model, dataset=val_X, model_features=feature_names, features=features_to_plot)

pdp.pdp_interact_plot(pdp_interact_out=inter1, feature_names=features_to_plot, plot_type='contour')
plt.show()
SHAP Values
SHapley Additive exPlanations
應用
了解模型對單一預測的原因
應用範例
- 一個模型說銀行不應該借錢給某人,並且法律要求銀行解釋每筆貸款拒絕的依據
- 醫療保健提供者想要確定哪些因素導致每位患者患某種疾病的風險,以便他們可以通過有針對性的健康干預措施直接解決這些風險因素
運作方式
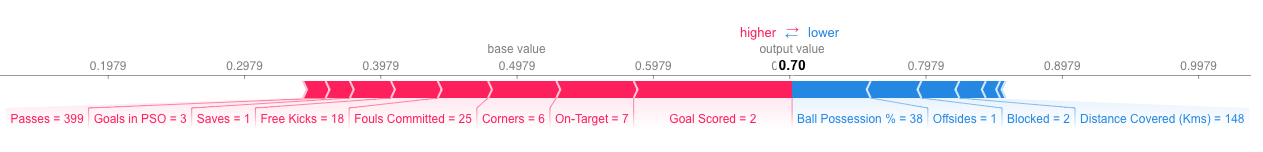
每個參數的事實對預測造成多少影響
code
import numpy as np
import pandas as pd
from sklearn.model_selection import train_test_split
from sklearn.ensemble import RandomForestClassifier

data = pd.read_csv('../input/fifa-2018-match-statistics/FIFA 2018 Statistics.csv')
y = (data['Man of the Match'] == "Yes")  # Convert from string "Yes"/"No" to binary
feature_names = [i for i in data.columns if data[i].dtype in [np.int64, np.int64]]
X = data[feature_names]
train_X, val_X, train_y, val_y = train_test_split(X, y, random_state=1)
my_model = RandomForestClassifier(random_state=0).fit(train_X, train_y)
code
row_to_show = 5
data_for_prediction = val_X.iloc[row_to_show]  # use 1 row of data here. Could use multiple rows if desired
data_for_prediction_array = data_for_prediction.values.reshape(1, -1)

import shap

explainer = shap.TreeExplainer(my_model)

shap_values = explainer.shap_values(data_for_prediction)

shap.initjs()
shap.force_plot(explainer.expected_value[1], shap_values[1], data_for_prediction)