
Grab the slides: slides.com/cheukting_ho/legend-data-viz3
Every Monday 5pm UK time

by Cheuk Ting Ho


pandas.DataFrame.plot
kind of plots it can produce:
-
‘line’ : line plot (default)
-
‘bar’ : vertical bar plot
-
‘barh’ : horizontal bar plot
-
‘hist’ : histogram
-
‘box’ : boxplot
-
‘kde’ : Kernel Density Estimation plot
-
‘density’ : same as ‘kde’
-
‘area’ : area plot
-
‘pie’ : pie plot
-
‘scatter’ : scatter plot
-
‘hexbin’ : hexbin plot.
Default is using matplotlib to produce plots.
pandas.DataFrame.plot
Other available plotting backends are:
- hvplot >= 0.5.1
- holoviews
- pandas_bokeh
- plotly >= 4.8
Let's see it in action
Seaborn
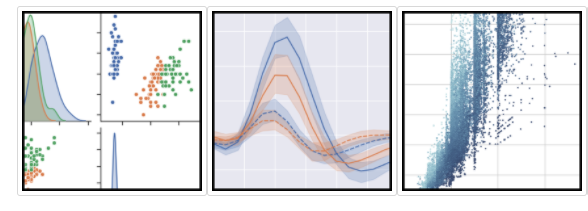
Seaborn is a library for making statistical graphics in Python. It is built on top of matplotlib and closely integrated with pandas data structures.
Seaborn
Here is some of the functionality that seaborn offers:
-
Examining relationships between multiple variables
-
Using categorical variables to show observations or aggregate statistics
-
Visualizing univariate or bivariate distributions and for comparing them between subsets of data
-
Automatic linear regression models for different kinds dependent variables
-
Structuring multi-plot grids
-
Styling with several built-in themes
-
Tools for choosing color palettes
Let's see it in action
Next week:
More Visulizations
Every Monday 5pm UK time