Observability Toolchain

First, let's talk about... Monitoring
-
Each system component expose information
- Network
- Host, database, web/application server
- Application
- Focused on failure or symptoms
-
No coordinated strategy
- Correlation is difficult
-
Common features
- Centralized store
- Dashboards
- Alerting
And then this happened





Managing Complexity
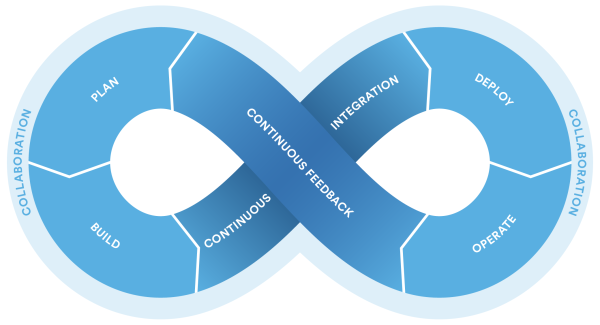
- Environments are complex
- Distributed + cloud based
- CI/CD
- Containerized workloads
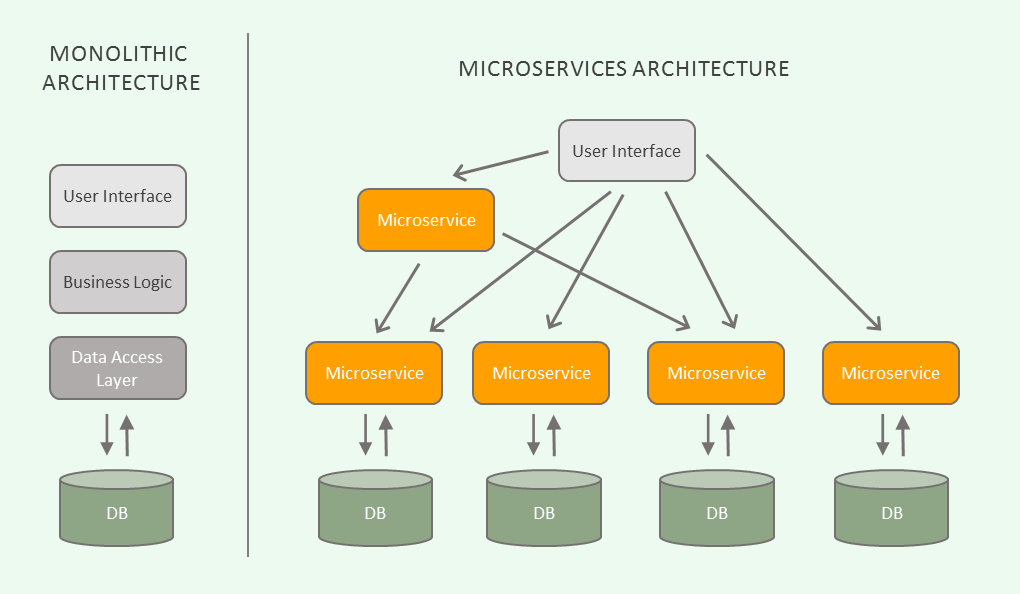
- Microservices architecture
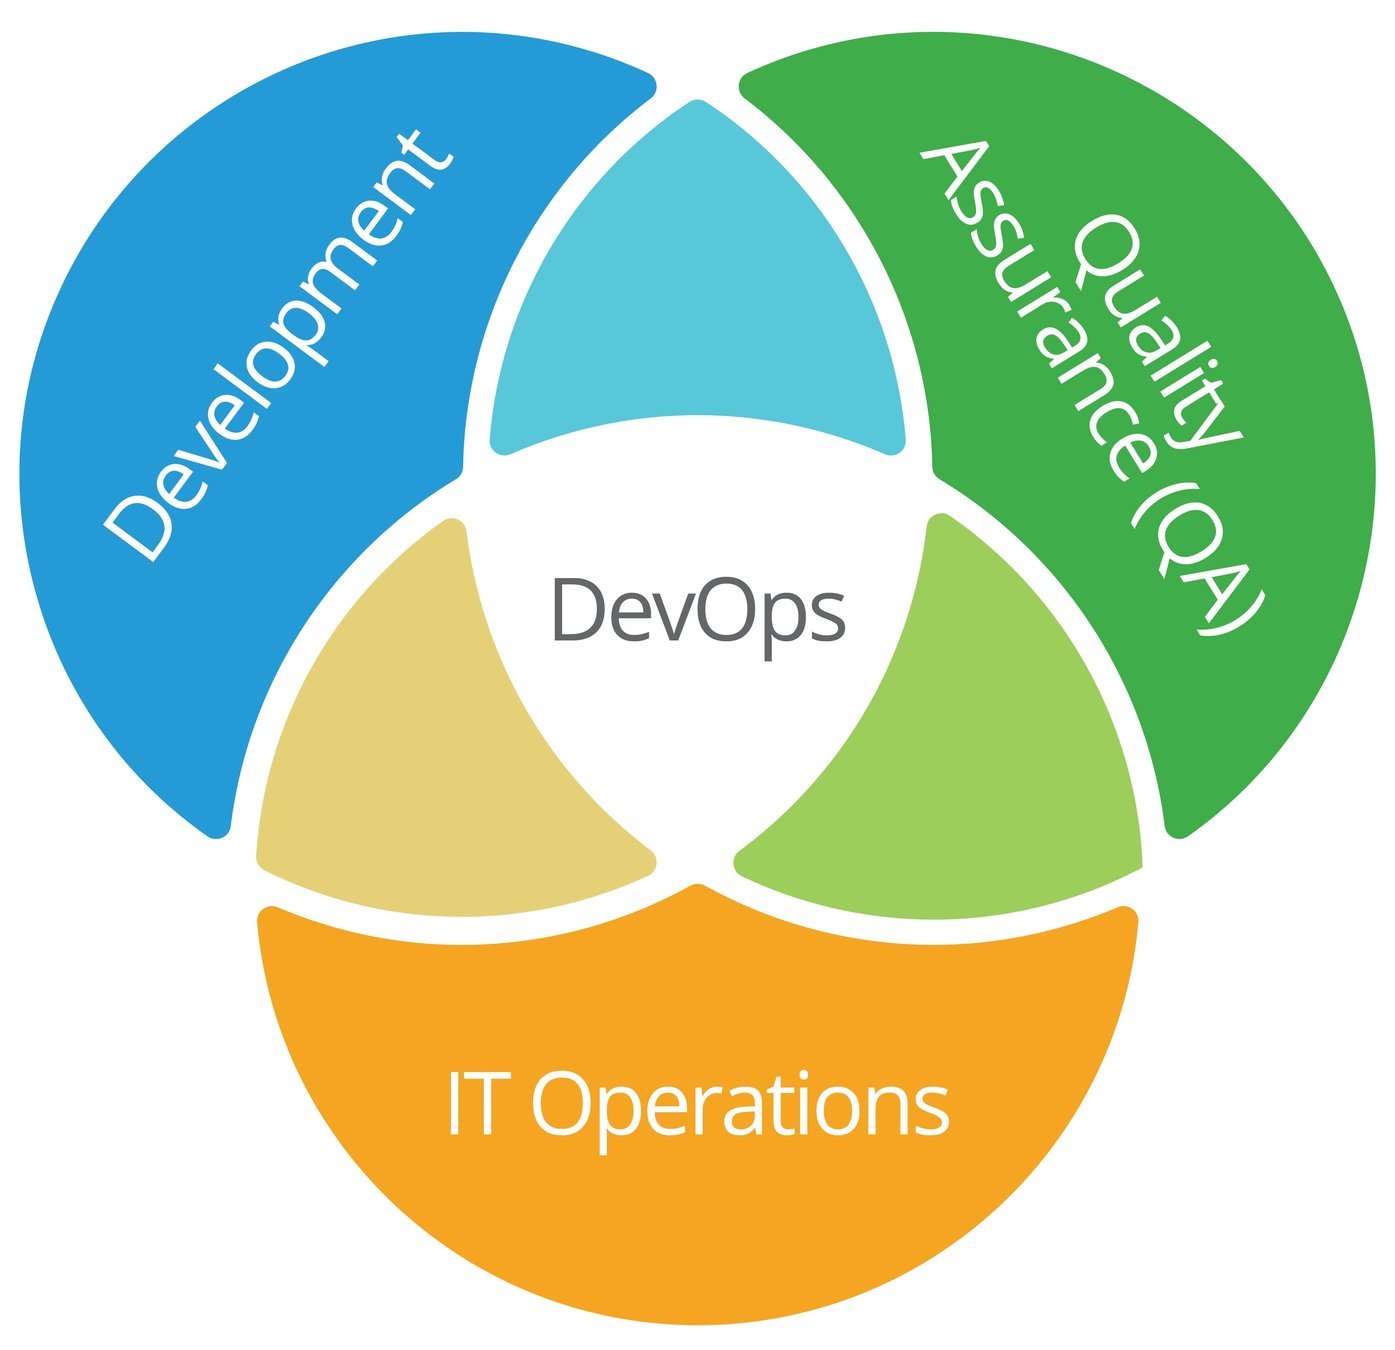
- Automation is at the center of DevOps
- Actual vs. desired state
- Controllability
- State deterministic from inputs
- Observability
- State can be determined from outputs
- Controllability
Netflix's Deathstar
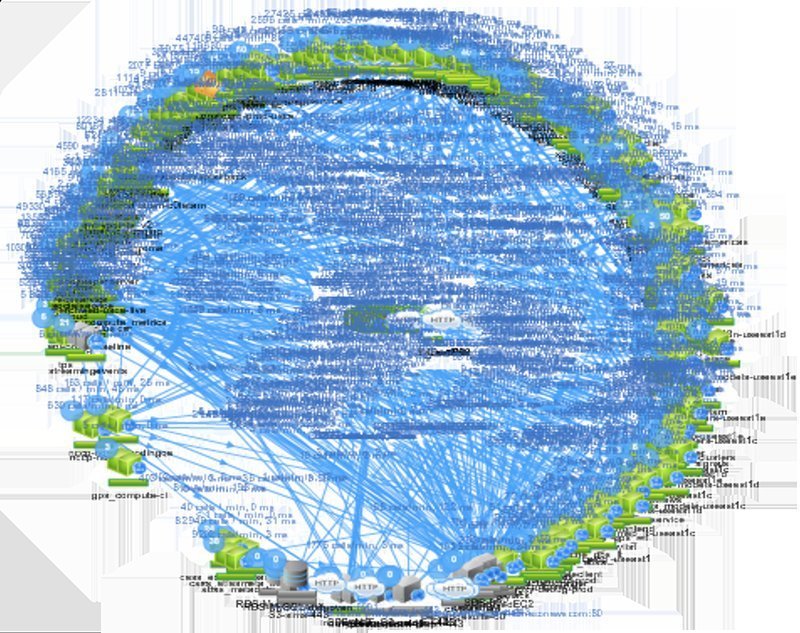
So...
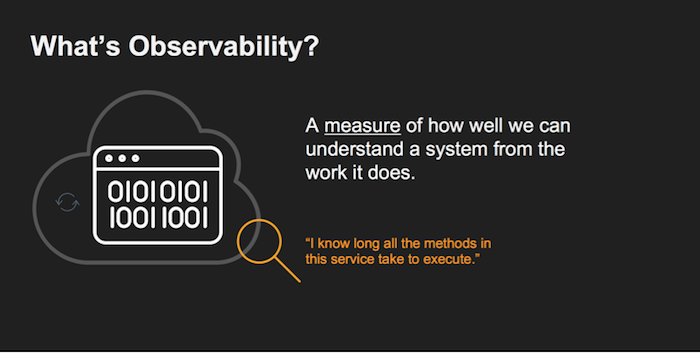
Observability: the new Monitoring?
- Observability is a property of a system
- A superset of monitoring
- Understand the state of the system at any time
- Detect, comprehend and react to issues
- Predict issues
- Enable forensics analysis
- Support business decisions
- Validate hypotheses
- Measure value delivery
- Make changes with confidence
And...
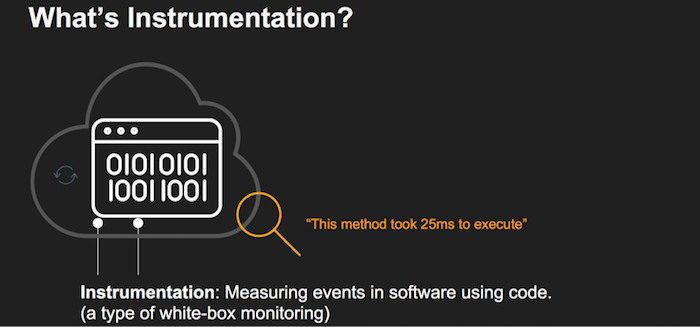
The 3 Pillars of Observability
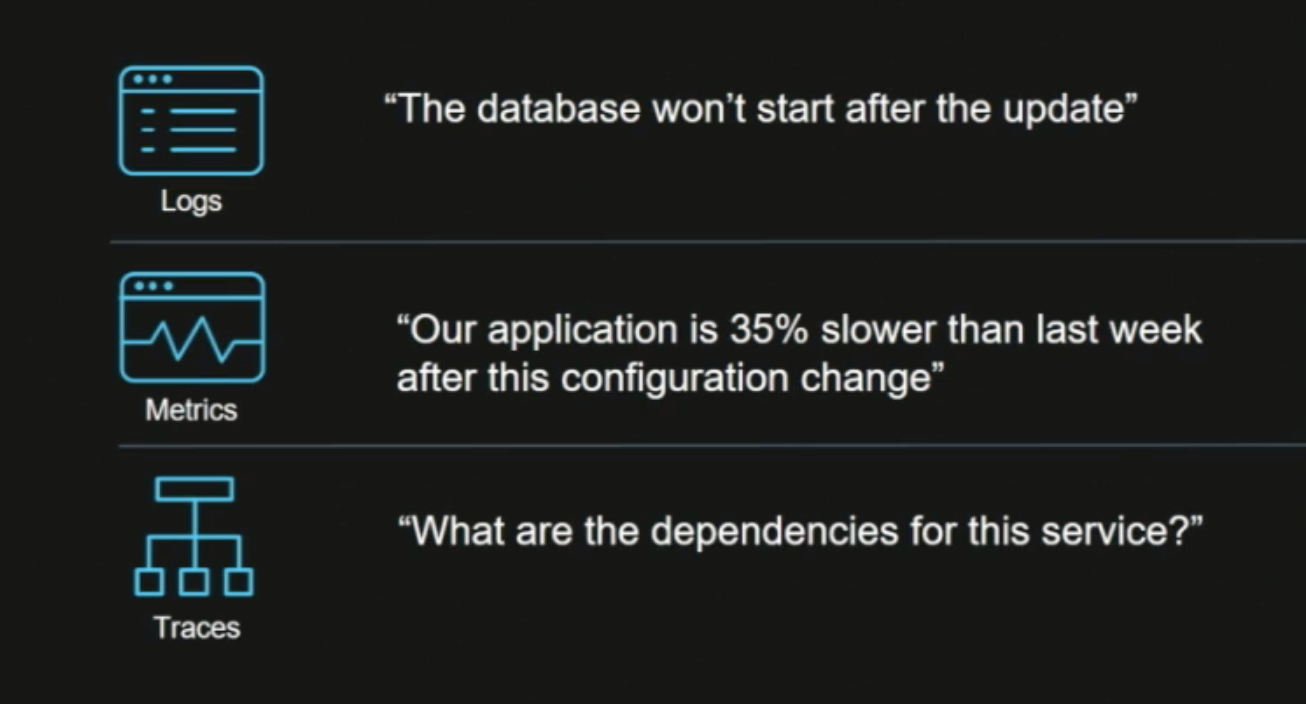
Logs
Logs

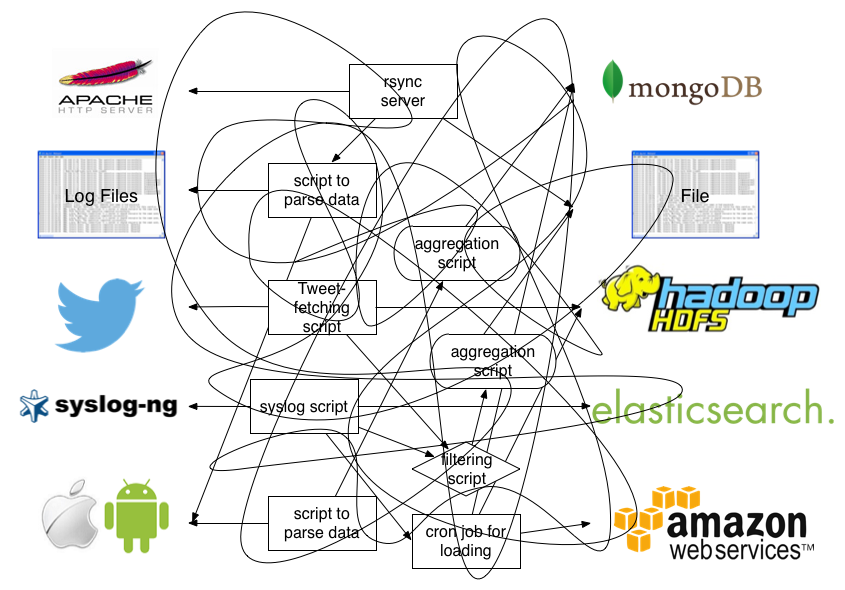
Evolution of log analytics

Challenges of logging
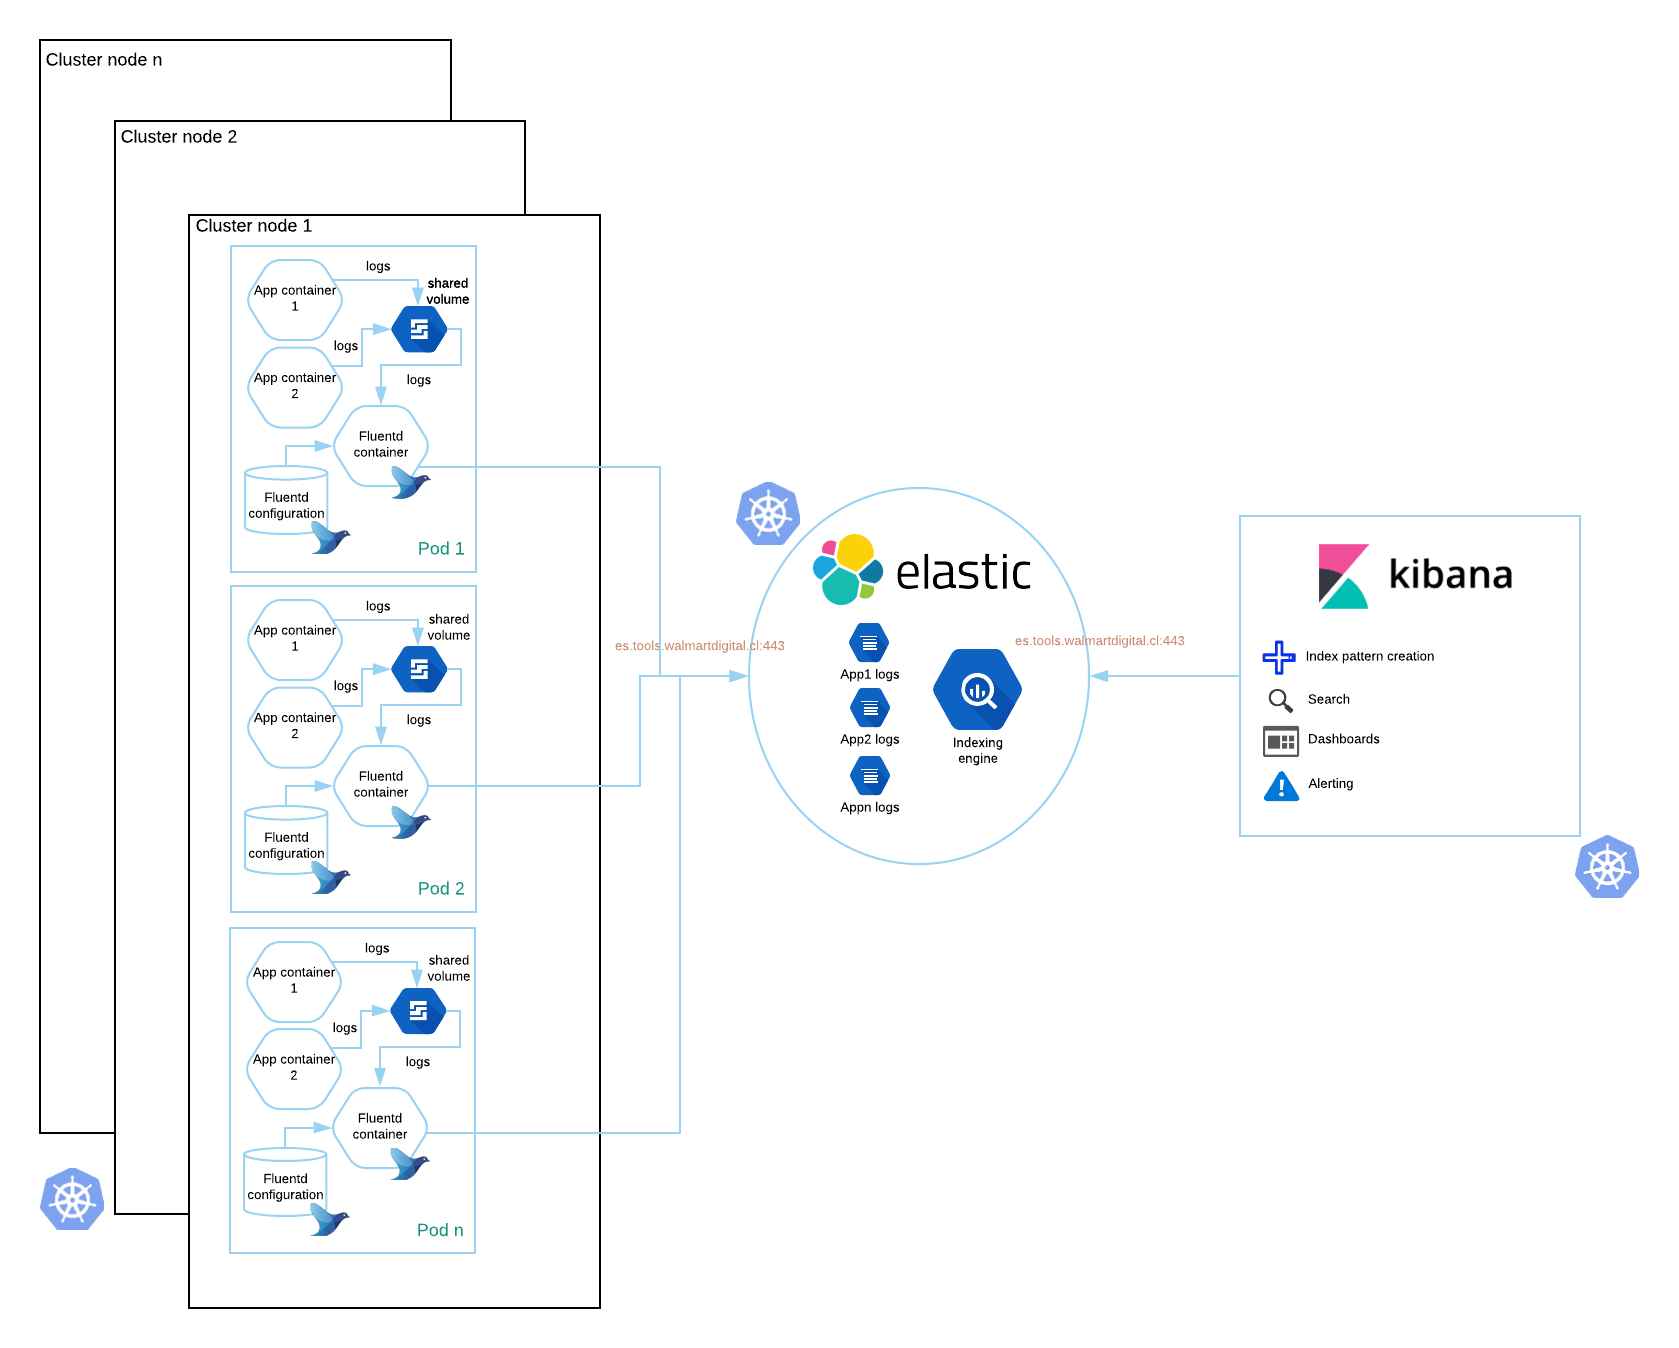
- Cloud-native data collector for a unified logging layer
- A single interface for multiple
- Data sources
- Destinations
- Horizontally-scalable and provides reliable data transfers
- Small memory footprint
- A single interface for multiple
- Plugin architecture for input, parsing, filtering, formatting and outputting logs
Elasticsearch
-
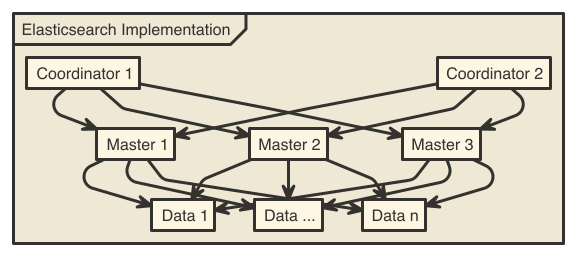
Distributed and highly-available RESTful search engine
- Full-text search
- Each index is sharded to paralellize operations
- Shard replicas for HA
-
JSON-document oriented
- No need for upfront schema definition
- (Near) real-time search

Inverted index

ES cluster design
-
Analytics and visualization for Elasticsearch
- Search, view, and interact data stored in indices
- Filter events based on tags such as environments, application names, K8s namespaces, etc...
- Advanced time-series data analysis
- Create custom dashboards including histograms, line graphs, pie charts and sunbursts

Examples
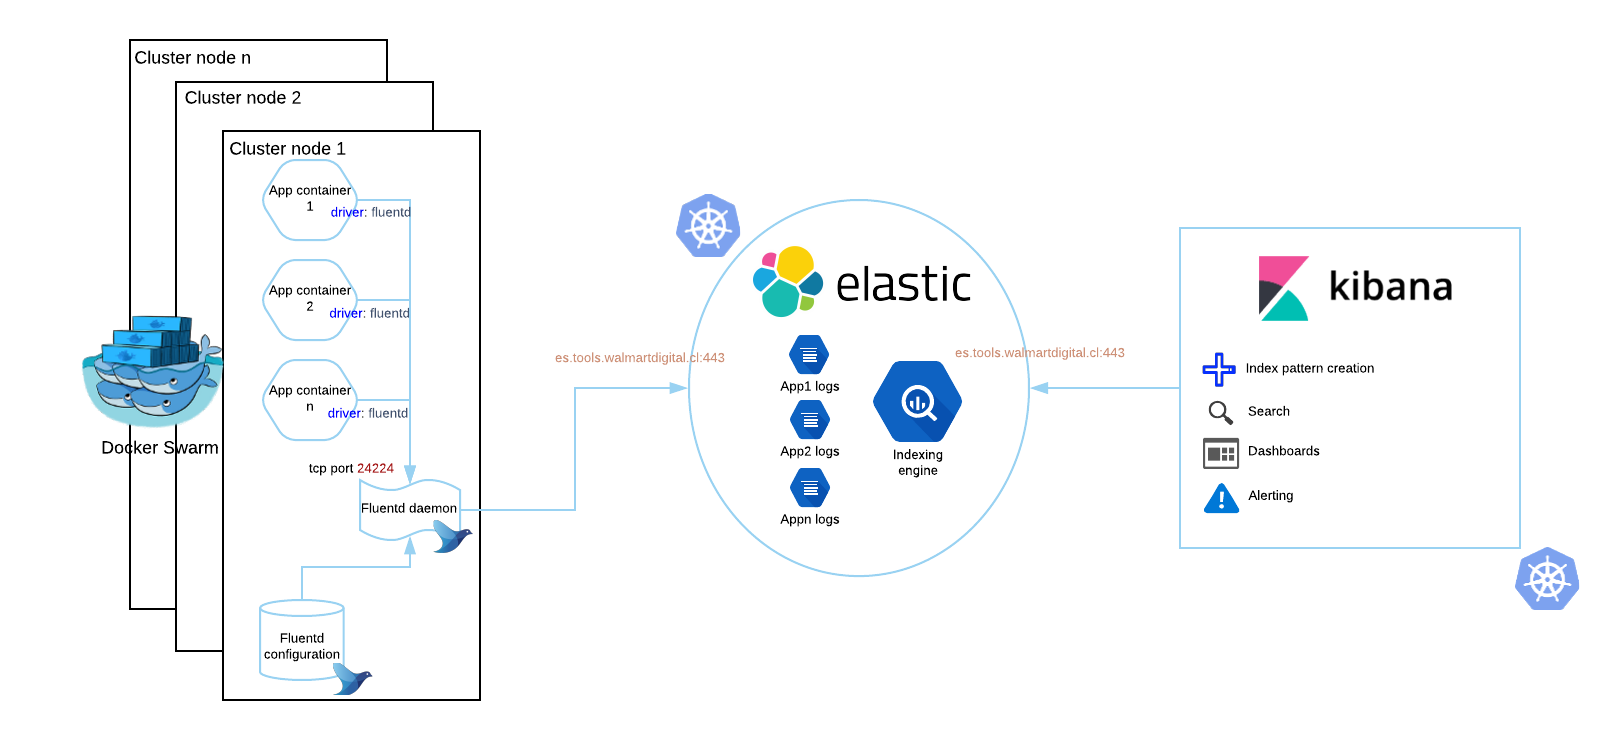
- Docker Swarm
- K8s
- https://bitbucket.org/walmartdigital/backend-k8s/src/c8e4c3e141fa42d6eb203266eaff645b96d35b9b/deployments/production/eastus2/grocery/production/oms/broker/deployment.yaml
- https://bitbucket.org/walmartdigital/backend-k8s/src/master/deployments/production/eastus2/grocery/production/shared/configmap.yaml
Metrics
Metrics

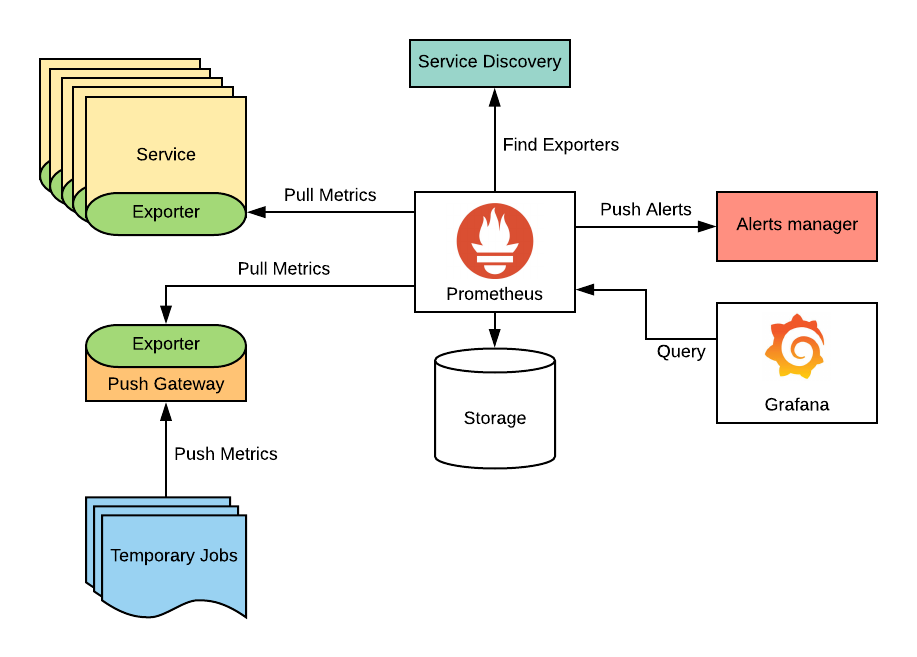
Prometheus
- Monitoring system and time series database
- Time series collection happens via a pull model over HTTP
- Trigger alerts when a rule expression is evaluated from given time interval
- Multiple modes of graphing and dashboarding supported
- Flexible query language to leverage multiple dimensions
- Targets are discovered via service discovery or static configuration (like consul)

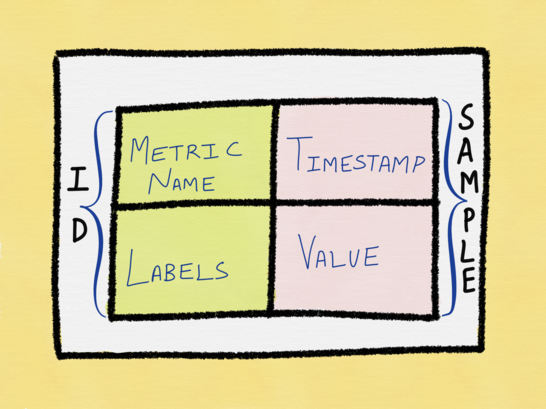
Anatomy of a Prometheus Metric
Grafana
- Feature-rich metrics dashboard and graph editor for multiple datasources like Elasticsearch, OpenTSDB, Prometheus and InfluxDB
- Allows to query, visualize, alert and understand metrics no matter where they are stored
- Templating queries for generic dashboards
- Different ways to visualize metrics and logs
- Alias patterns for short readable series names

Examples
- Production Prometheus instance:
- Business-model metrics
- System-level metrics
- APM for micro-services-based applications
- Real-time alerting and notifications
- Integrations with web hook, slack, email
- 1 second metric granularity
- Monitoring multiple client technologies based on Sensors
- Full-stack distributed tracing
- Traces every single request
- Auto-discovery, data collection, and dynamic graph features

Examples
- Production Instana instance:
- Grafana panel from Instana metrics
Tracing
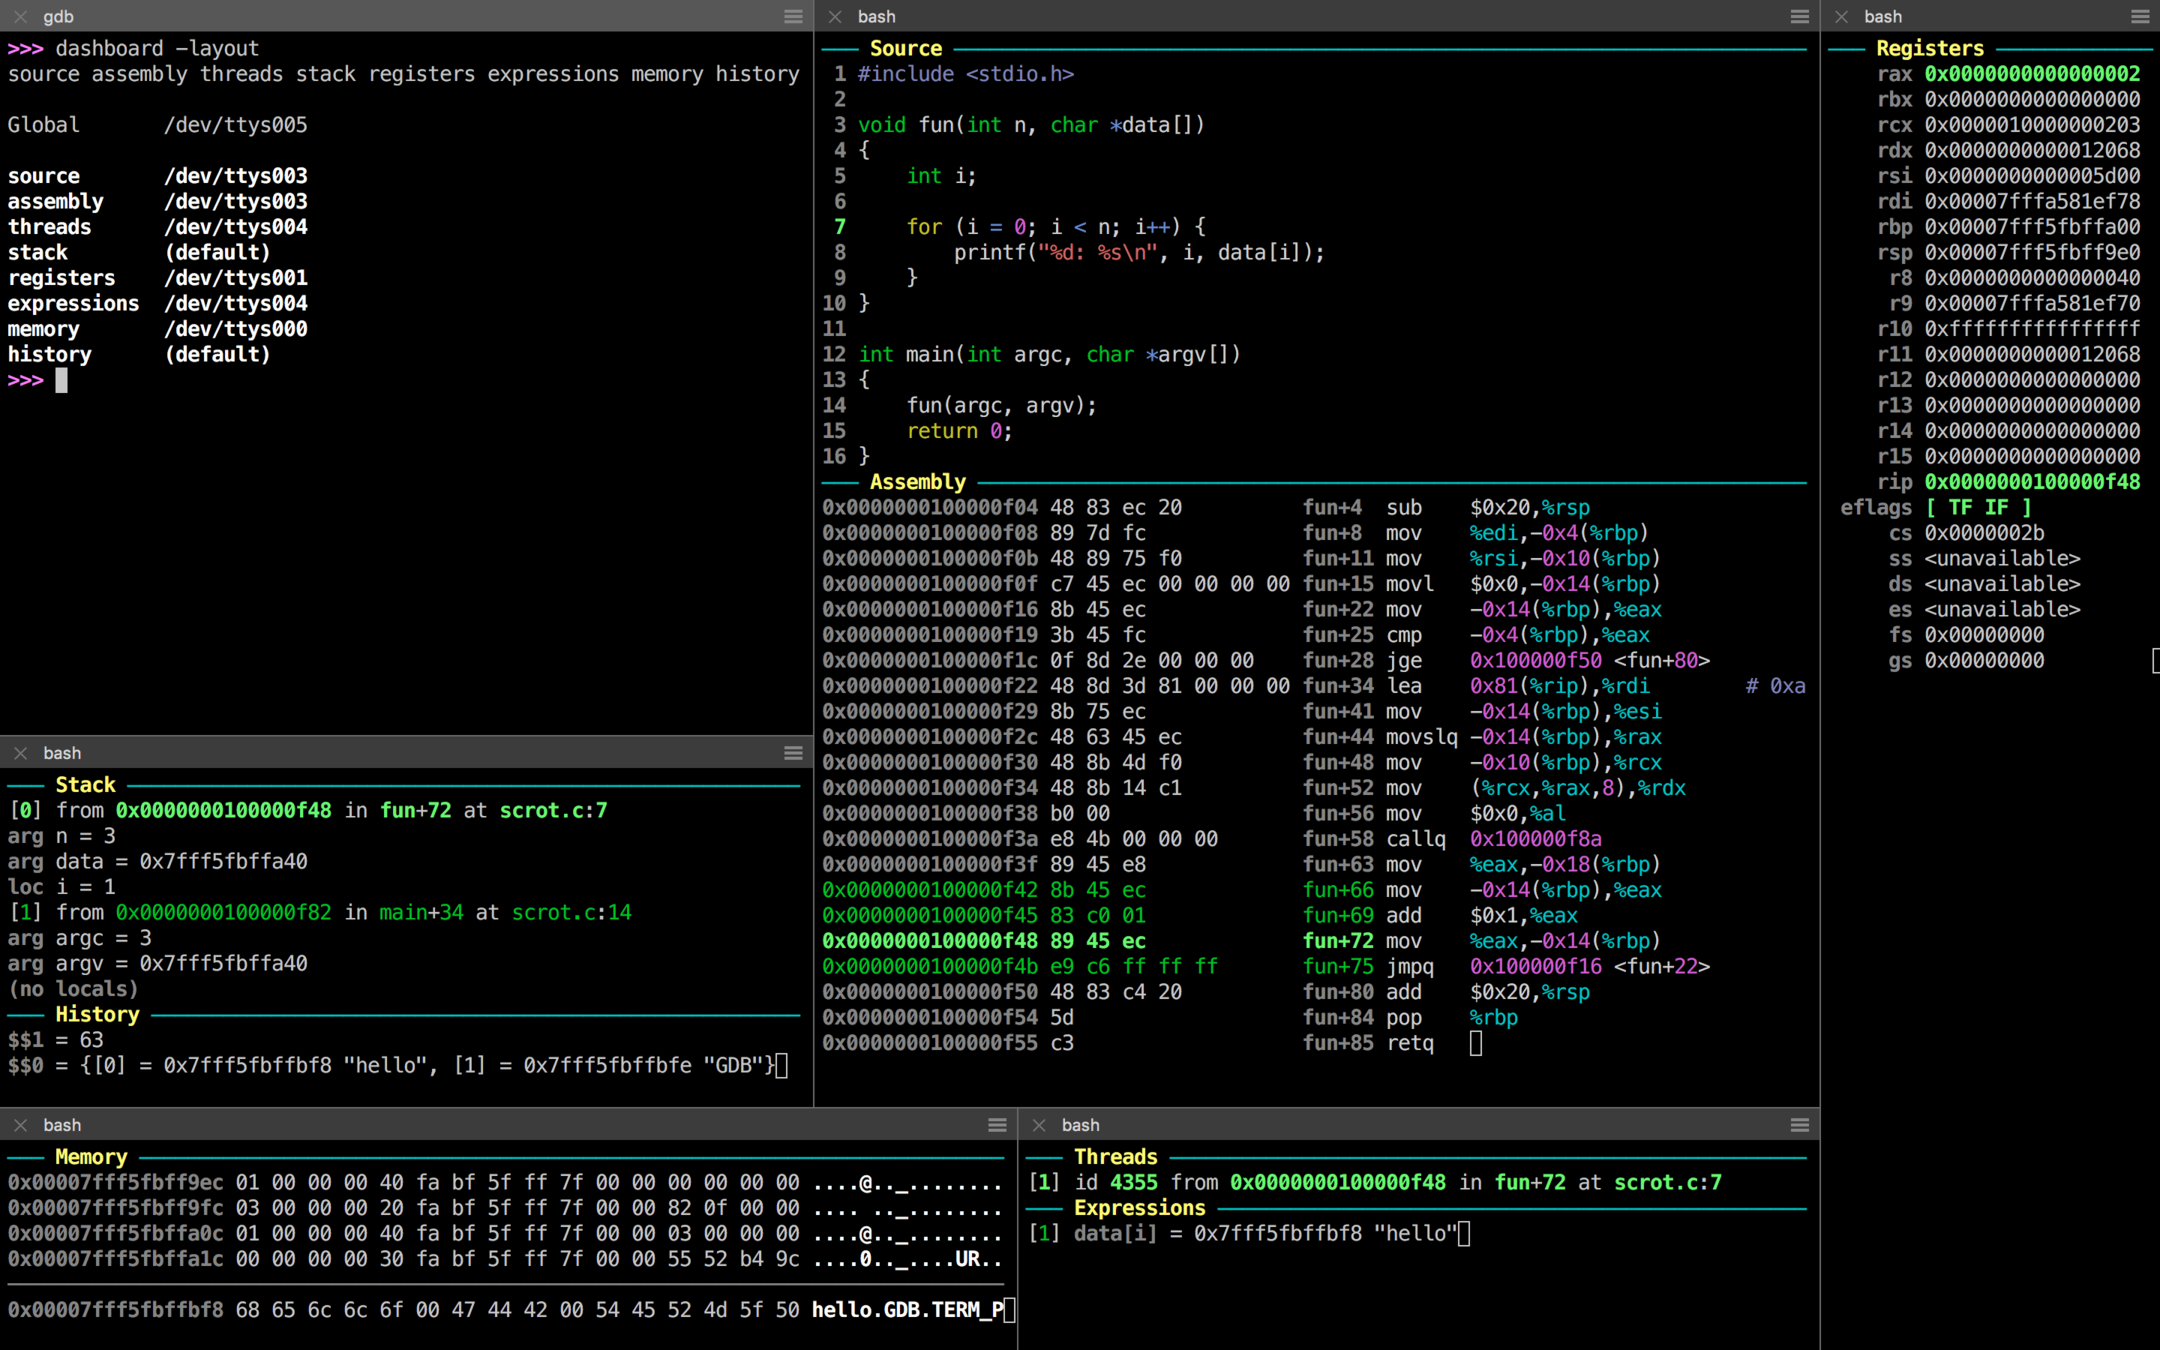
Oldschool Debugging
Tracing

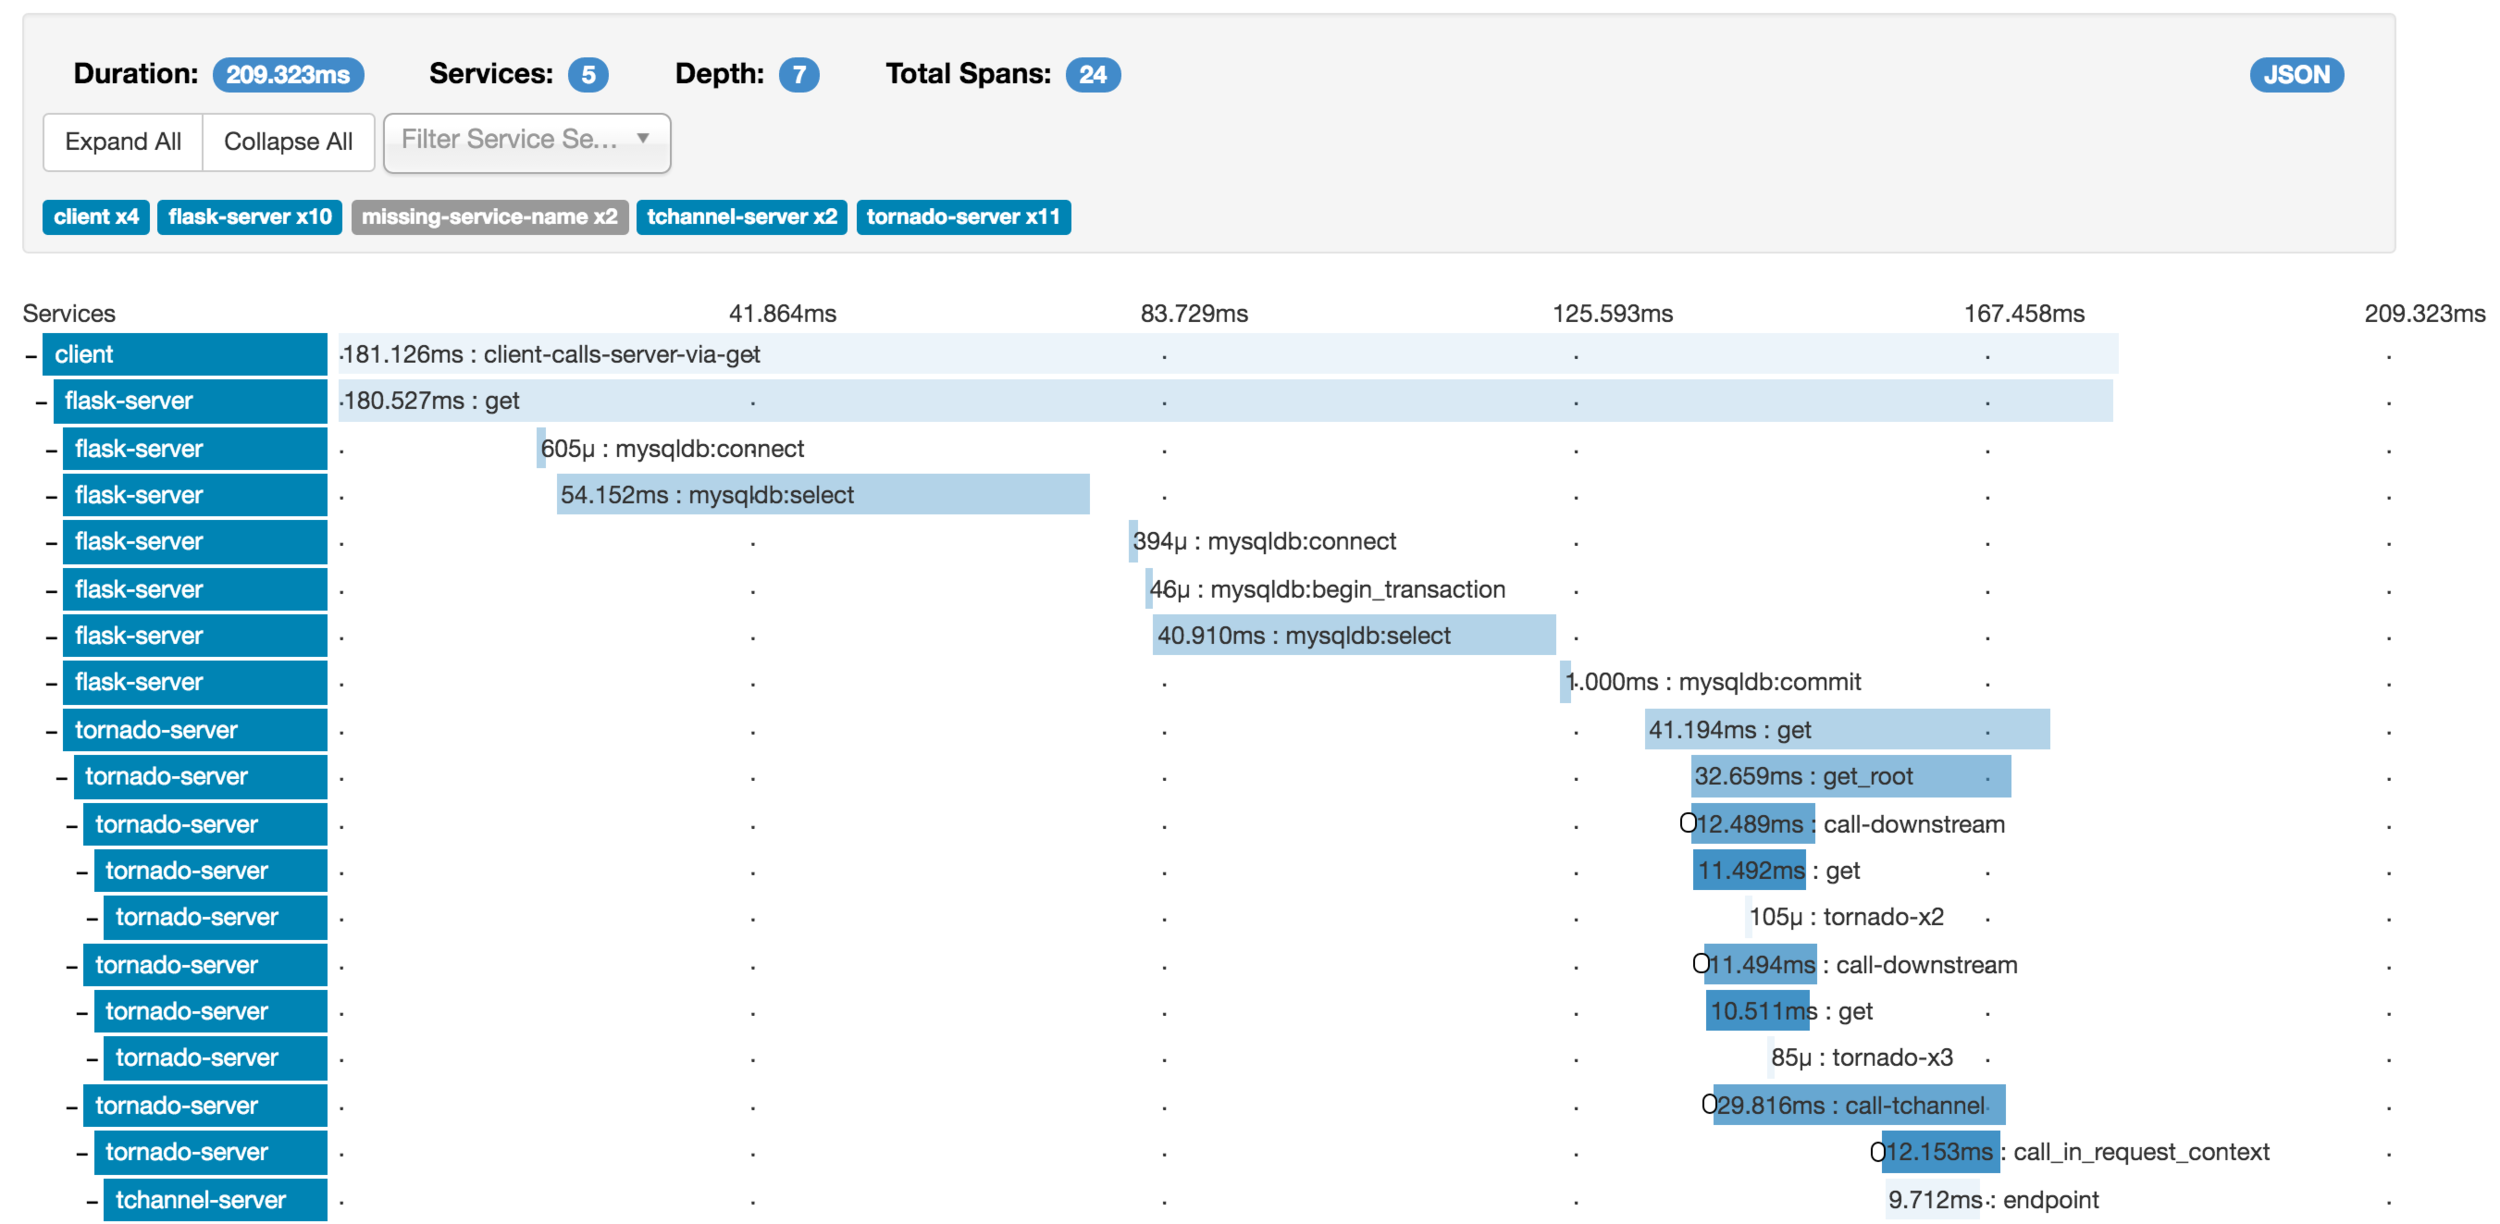
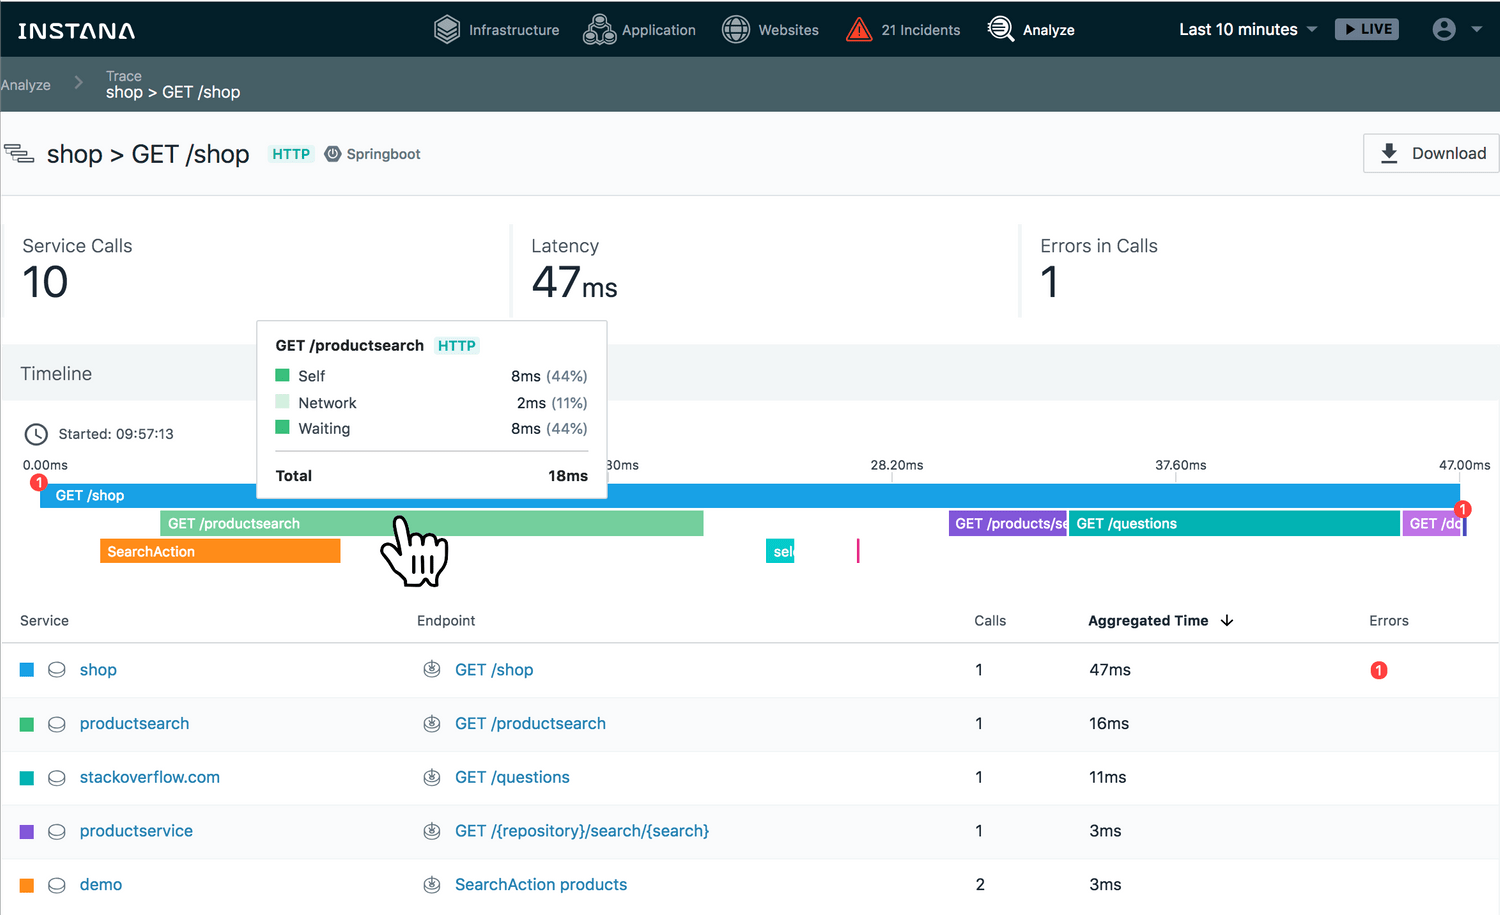
What's distributed tracing?

Examples
- Including the Instana sensor in NodeJS code
- Production Instana instance:
Grafana
- Visualize metrics from tracing tools such as:

Alerting
AlertManager
- What is an alert?
- Prometheus server sends alerts to an Alertmanager
- Alertmanager manages the alerts it receives
- Aggregate
- Group
- Inhibit
- Silence
- Route and send out notifications
Example
- Slack receiver configuration:
- Consul backups job alerting rule:
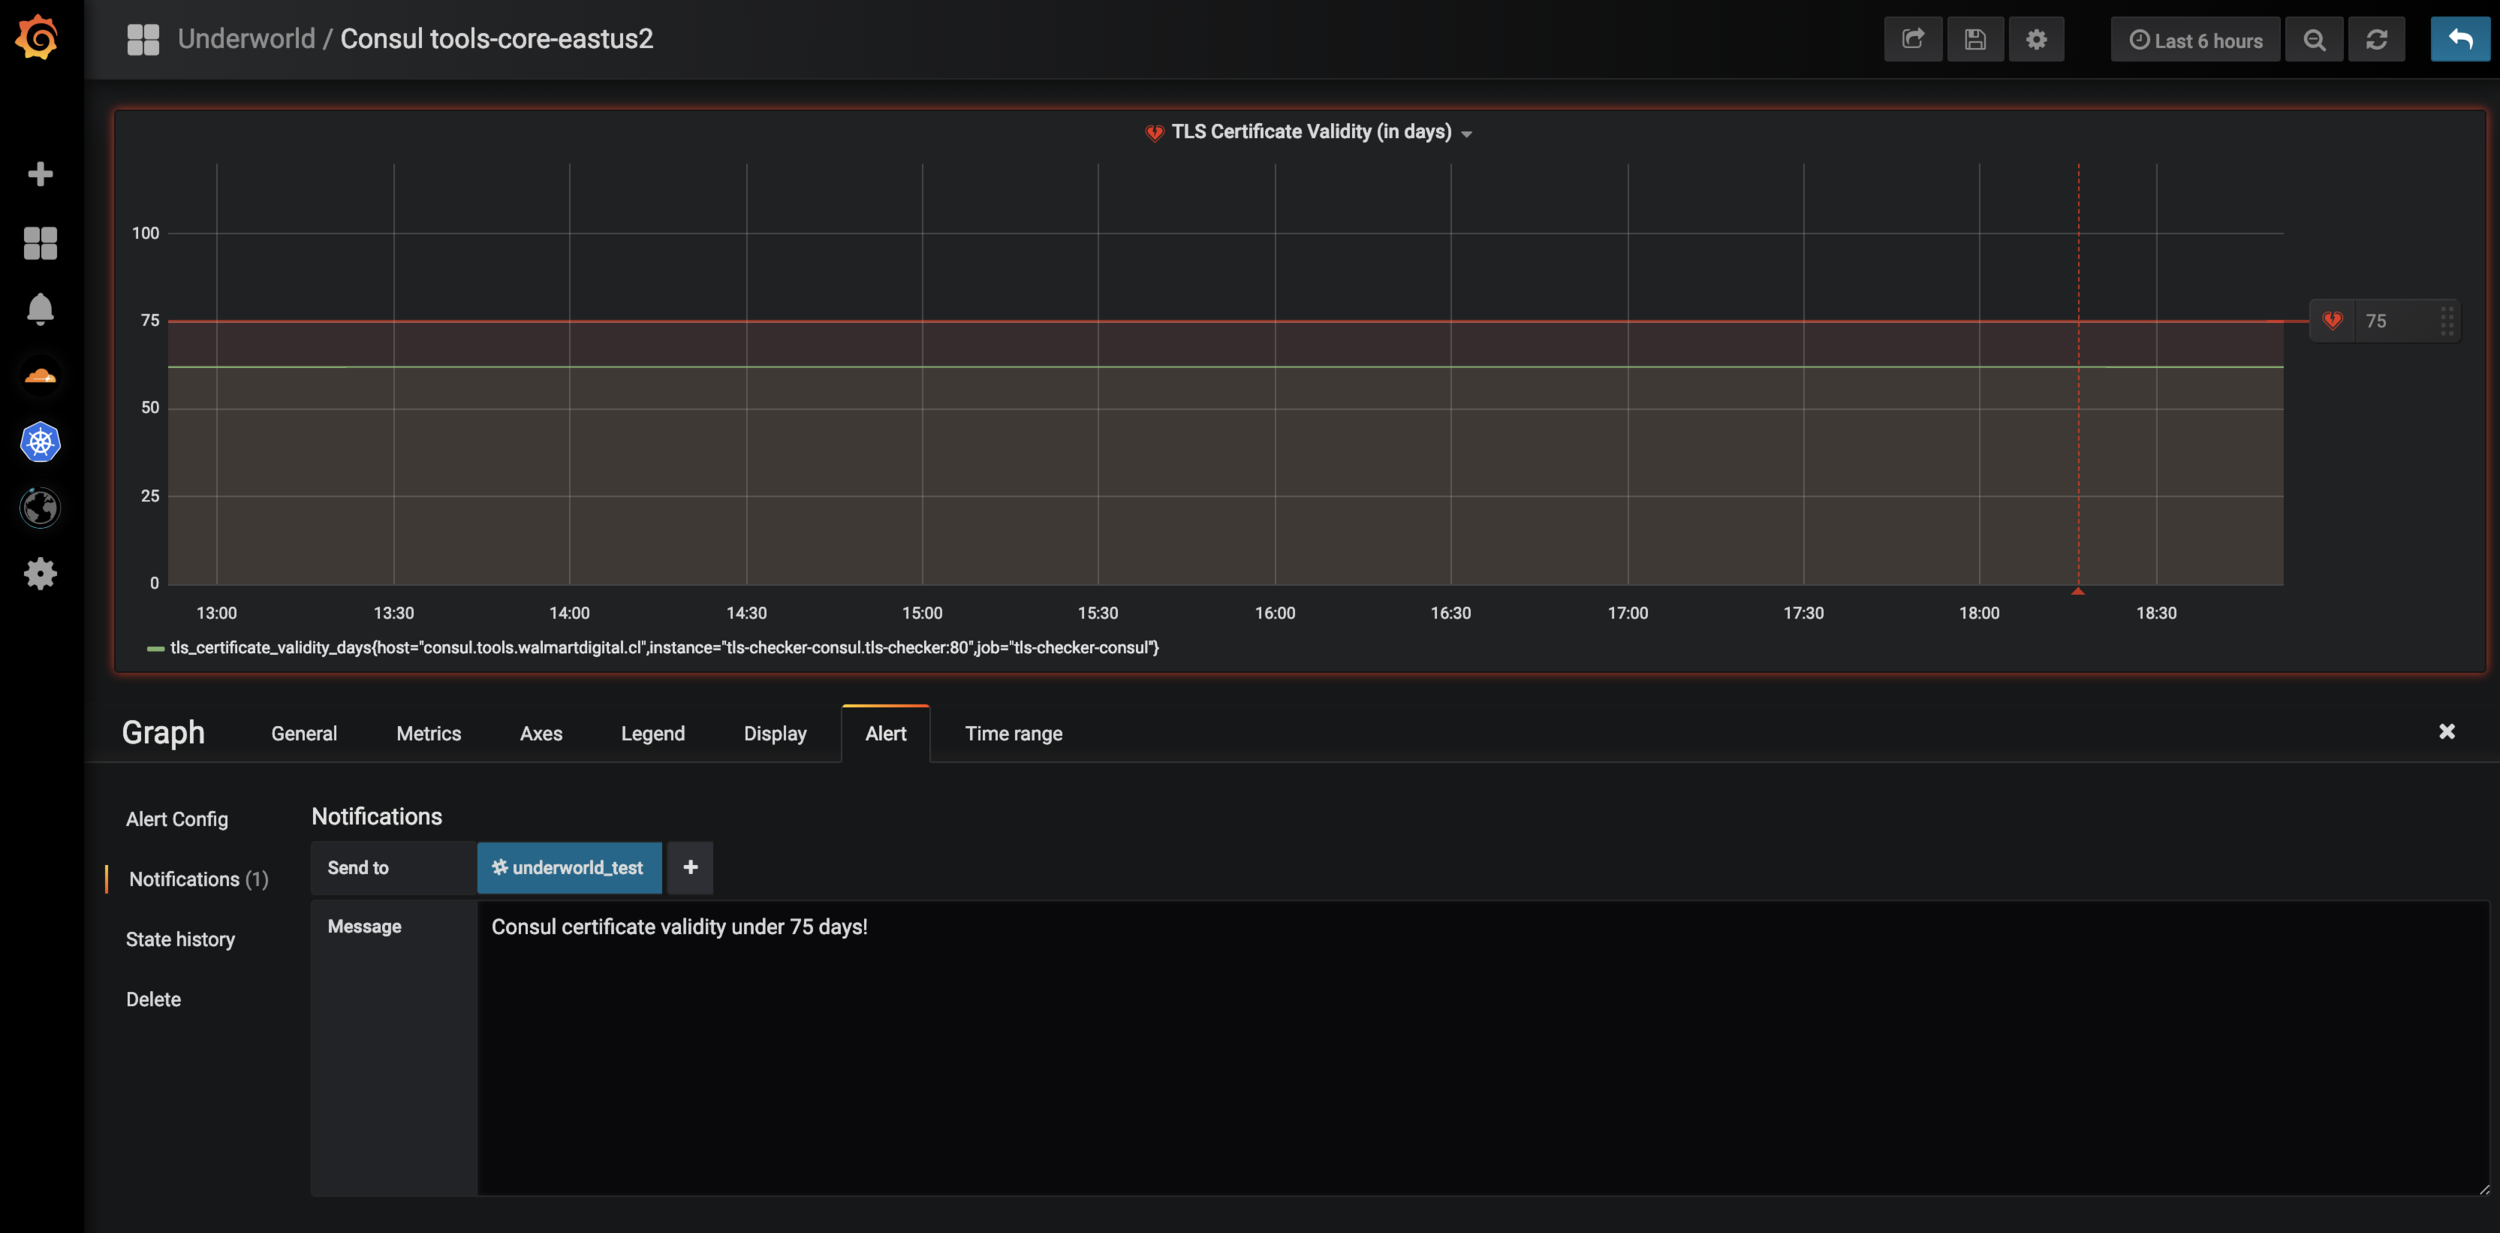
Grafana Alerts
ElastAlert
- Open source project from Yelp
- Alerting based on logs or other information managed in Elasticsearch
- Define alerting conditions based on a DSL query
- Define notification channel
- Slack
- JIRA
- HipChat
- ...
Instana Alerts
- Integrates with Instana concepts of
- Issues
- Incidents
- Changes
- Uses Lucene query syntax to filter assets
-
Integrations represent notification channels
- Slack
- Splunk
- Office365
- ...
Questions
Feedback
https://bit.ly/2J9G8ui

Thank you!
