math3d.org
Create, save, and share 3d math visualizations in your web browser
Presentation: https://goo.gl/dsX62X
Chris Chudzicki
April 29, 2017

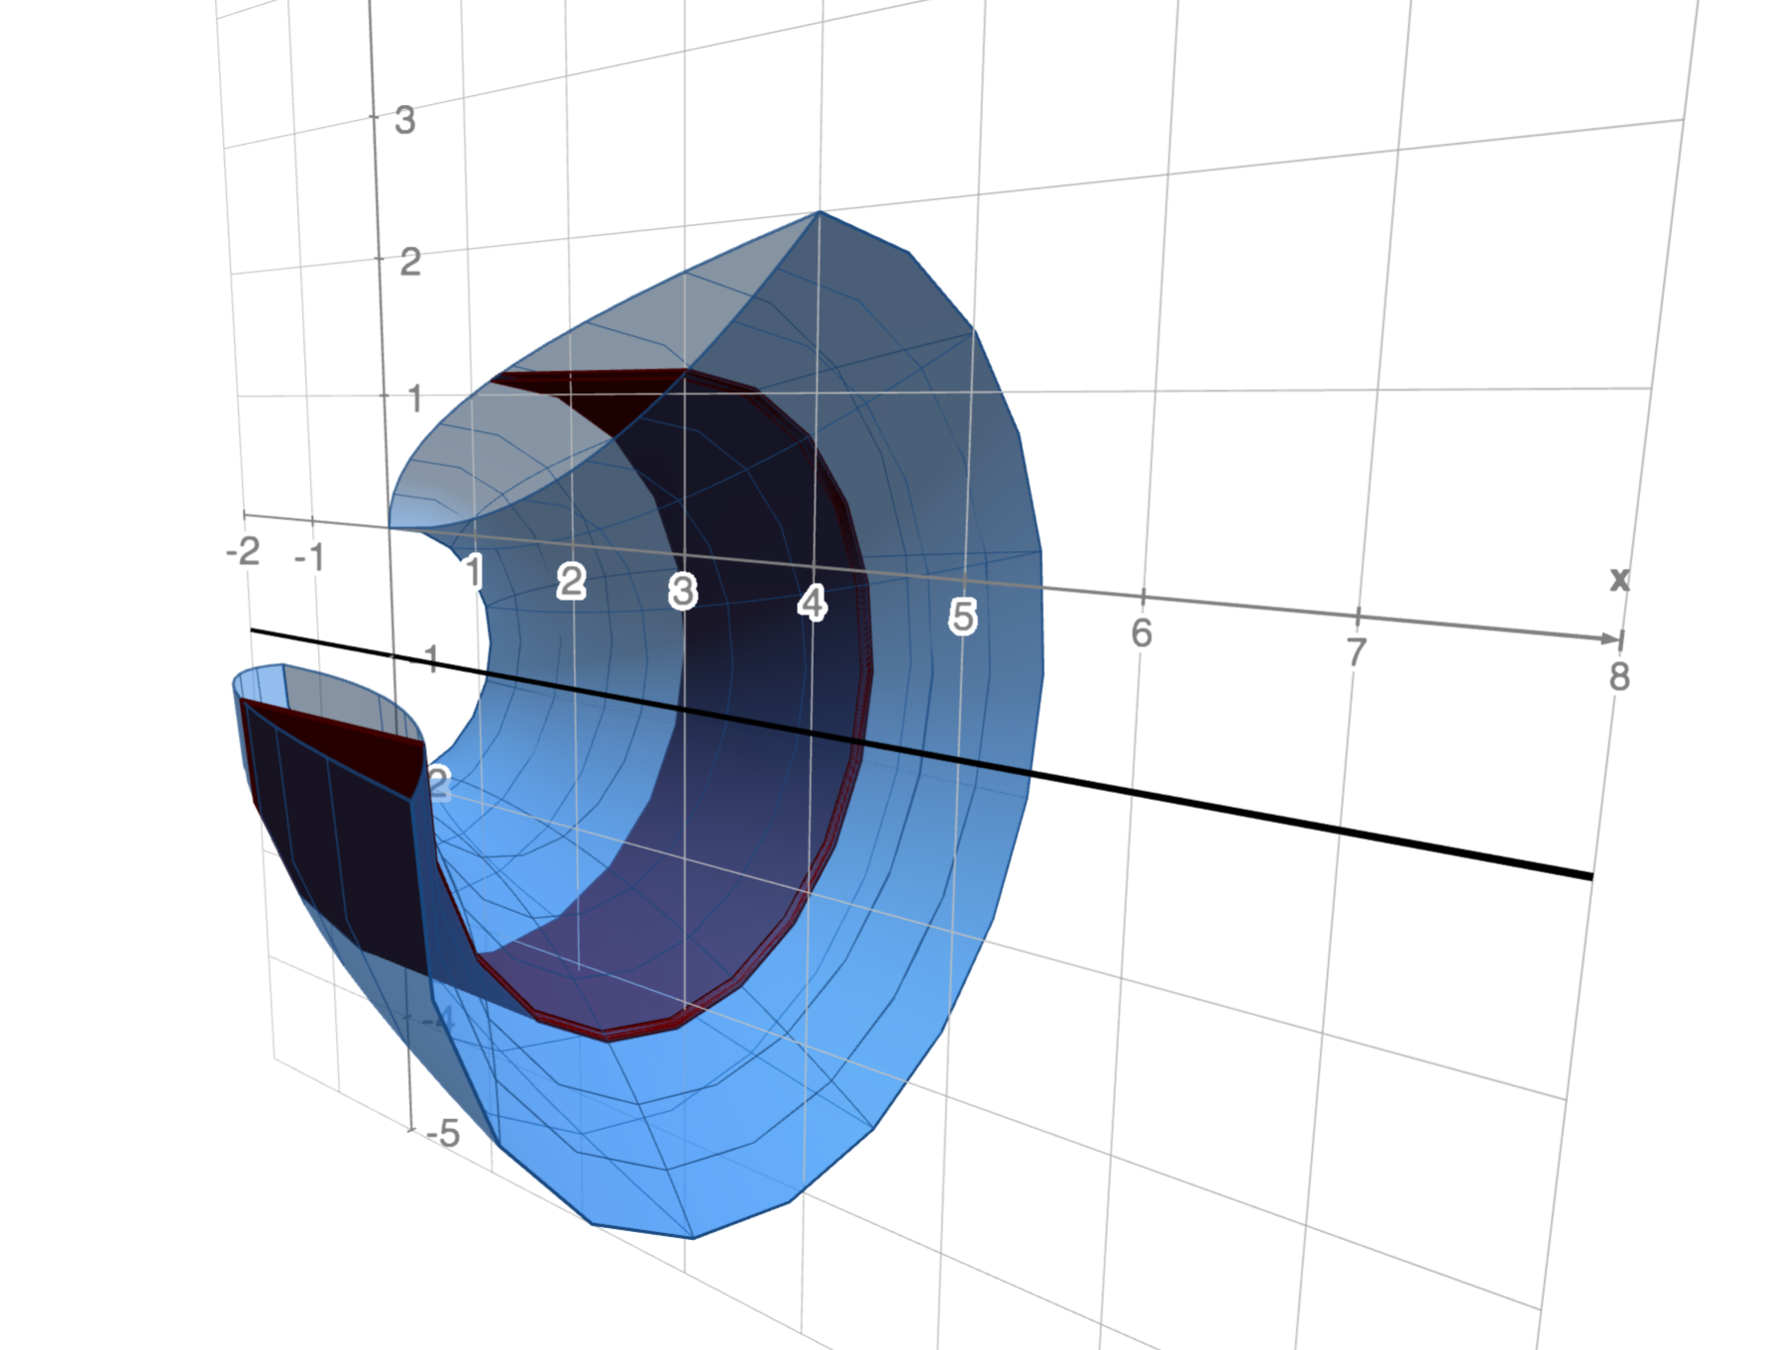
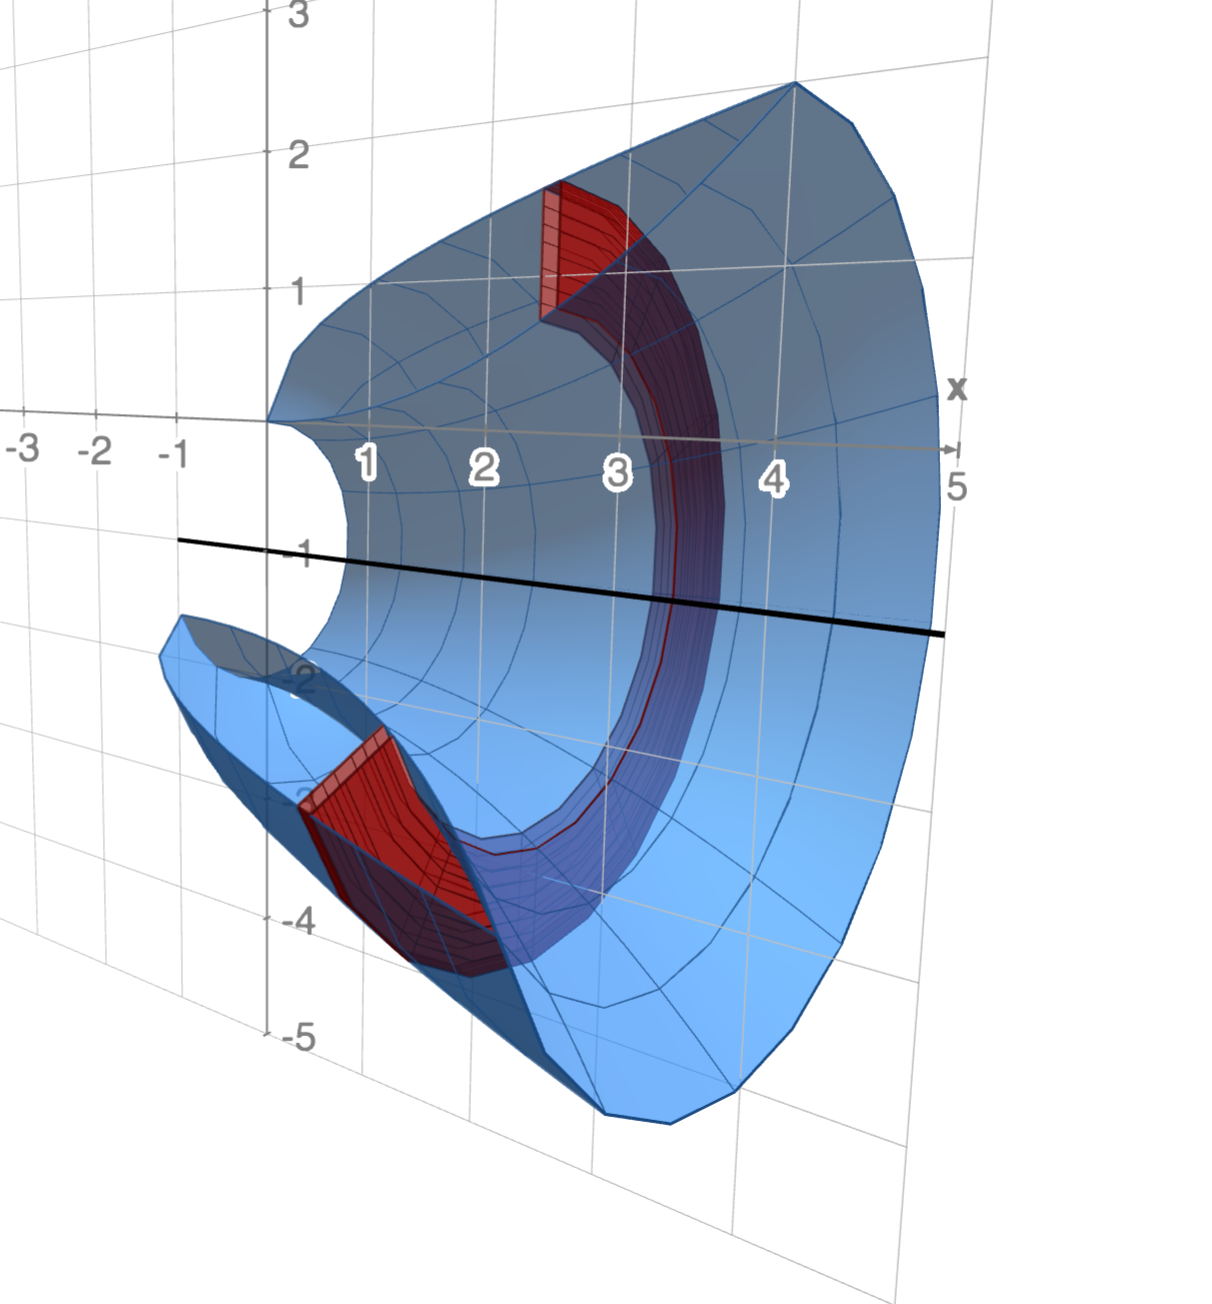
Visualization is Important
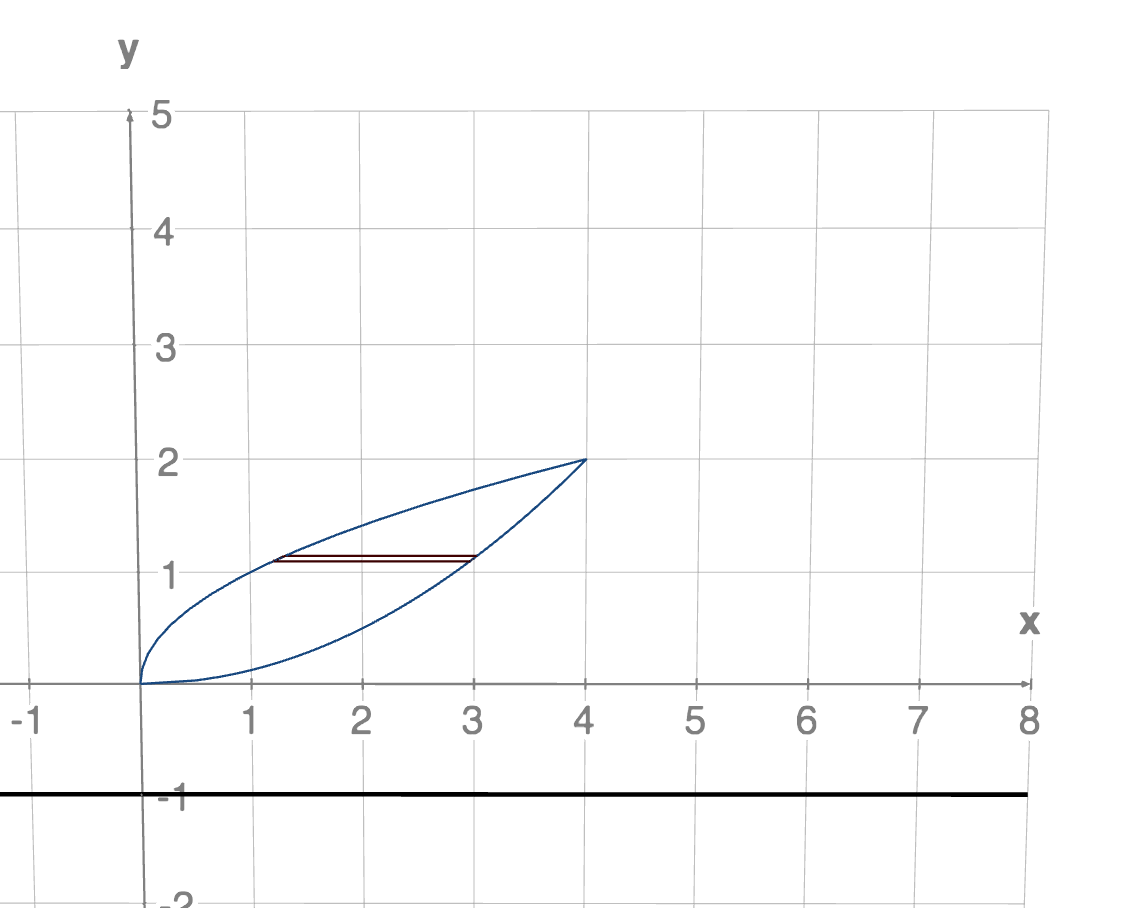
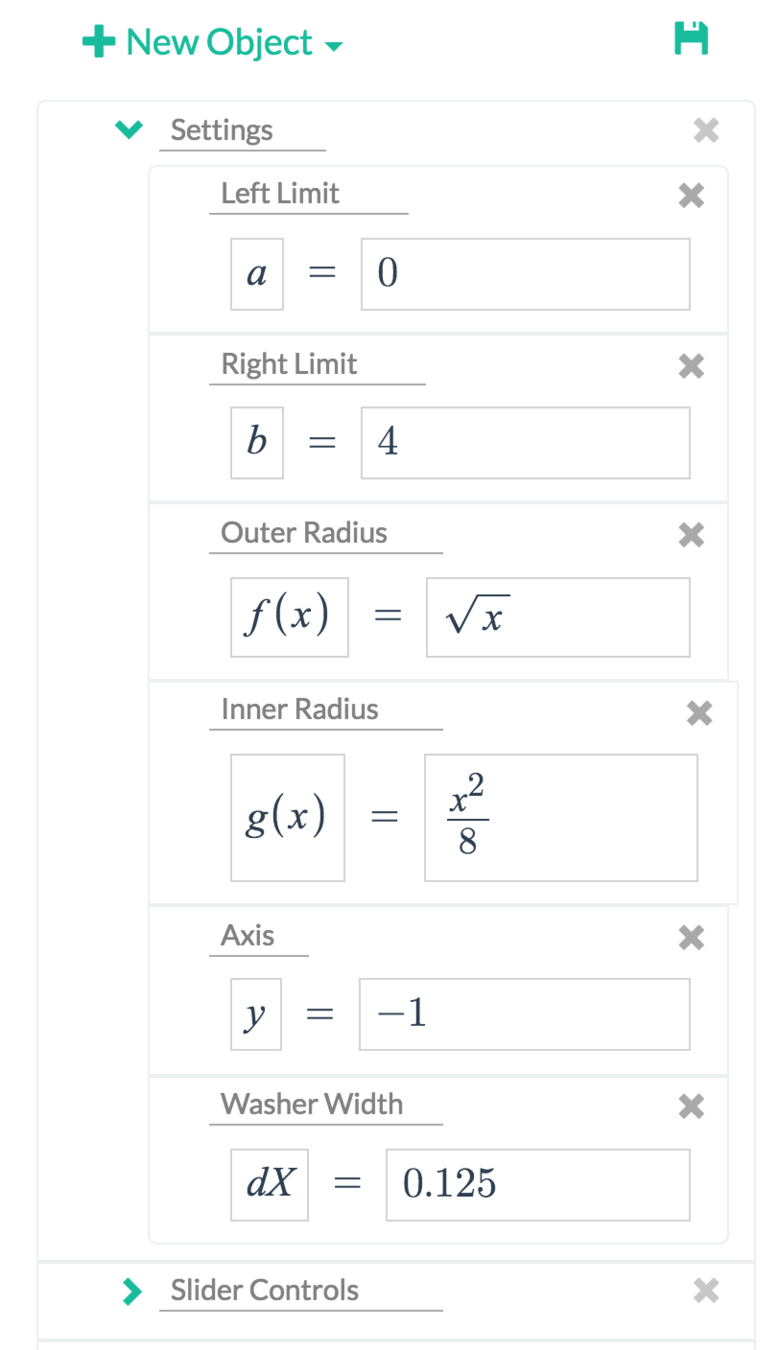
Find volume of region shown when rotated around line
\(y=-1\)
A 3d math webapp ... Why?
Desmos is great for 2D visualization!
-
intuitive & flexible
points, curves, inequalities, animations - easy to share
- ⇒ Good for homework & class explorations; creative projects
Previous 3D visualization tools:
- Offline: learning curve; expensive; harder to share
some free (e.g., Sage) but harder to learn - Online: limited in scope
untrue
Inspiration
math3d.org inspired by Steven Wittens' Mathbox\({}^2\)
(an open-source javascript library for animating 3d math)
Self: awestruck
at beautiful 3d math running natively in my web browser
I need to share this with my students
math3d live demo
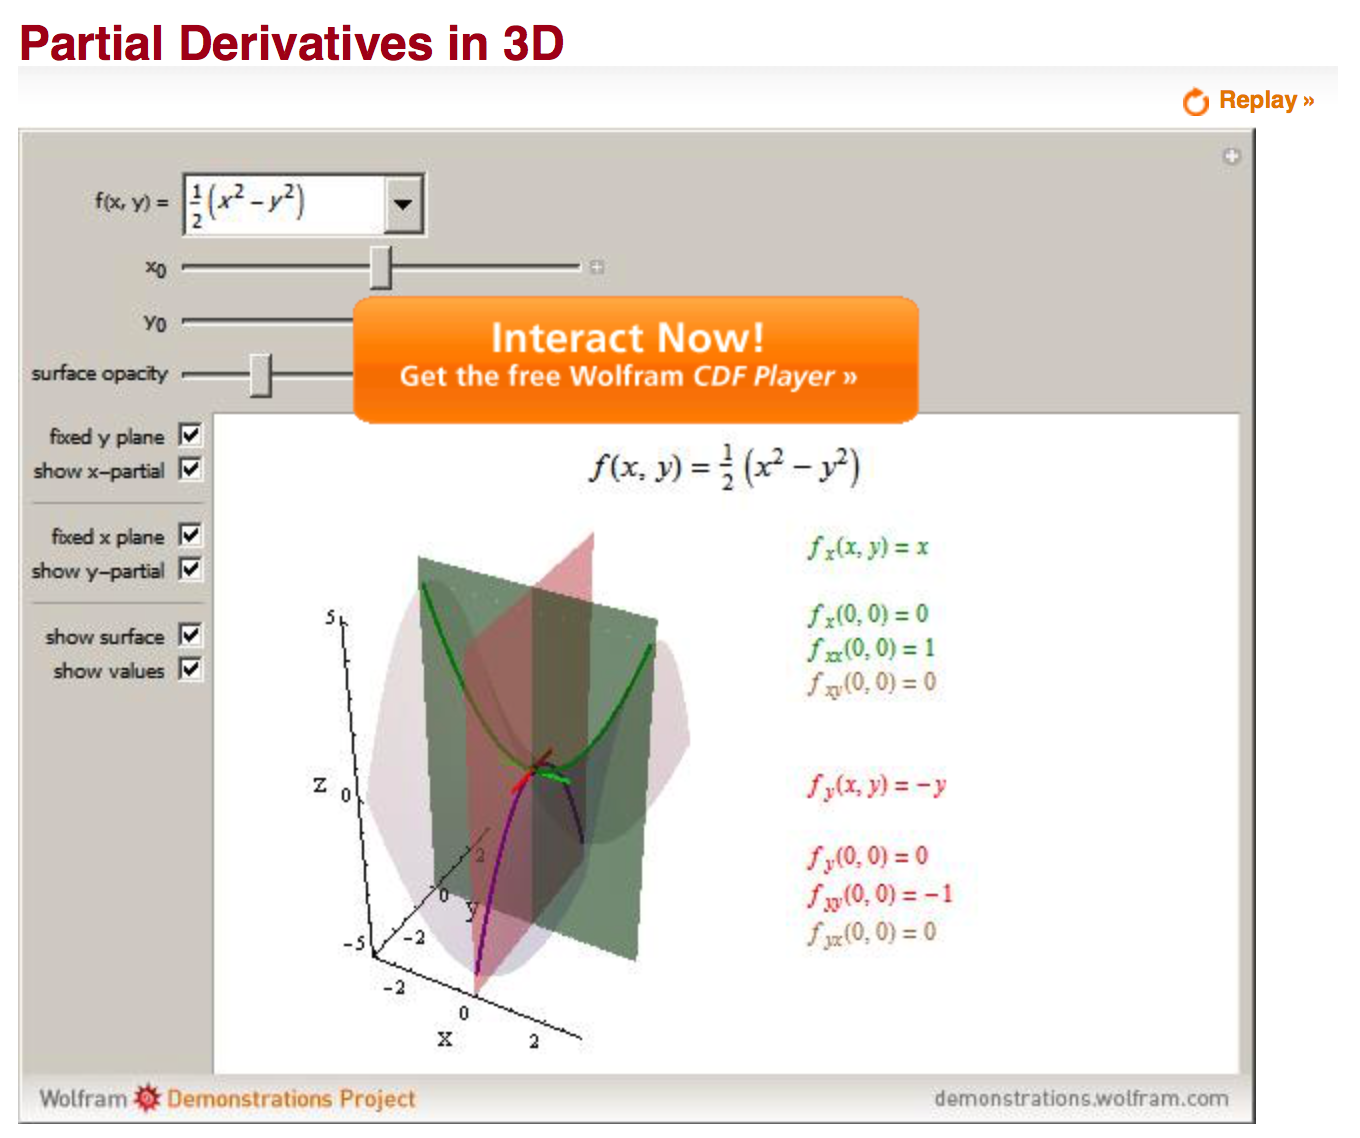
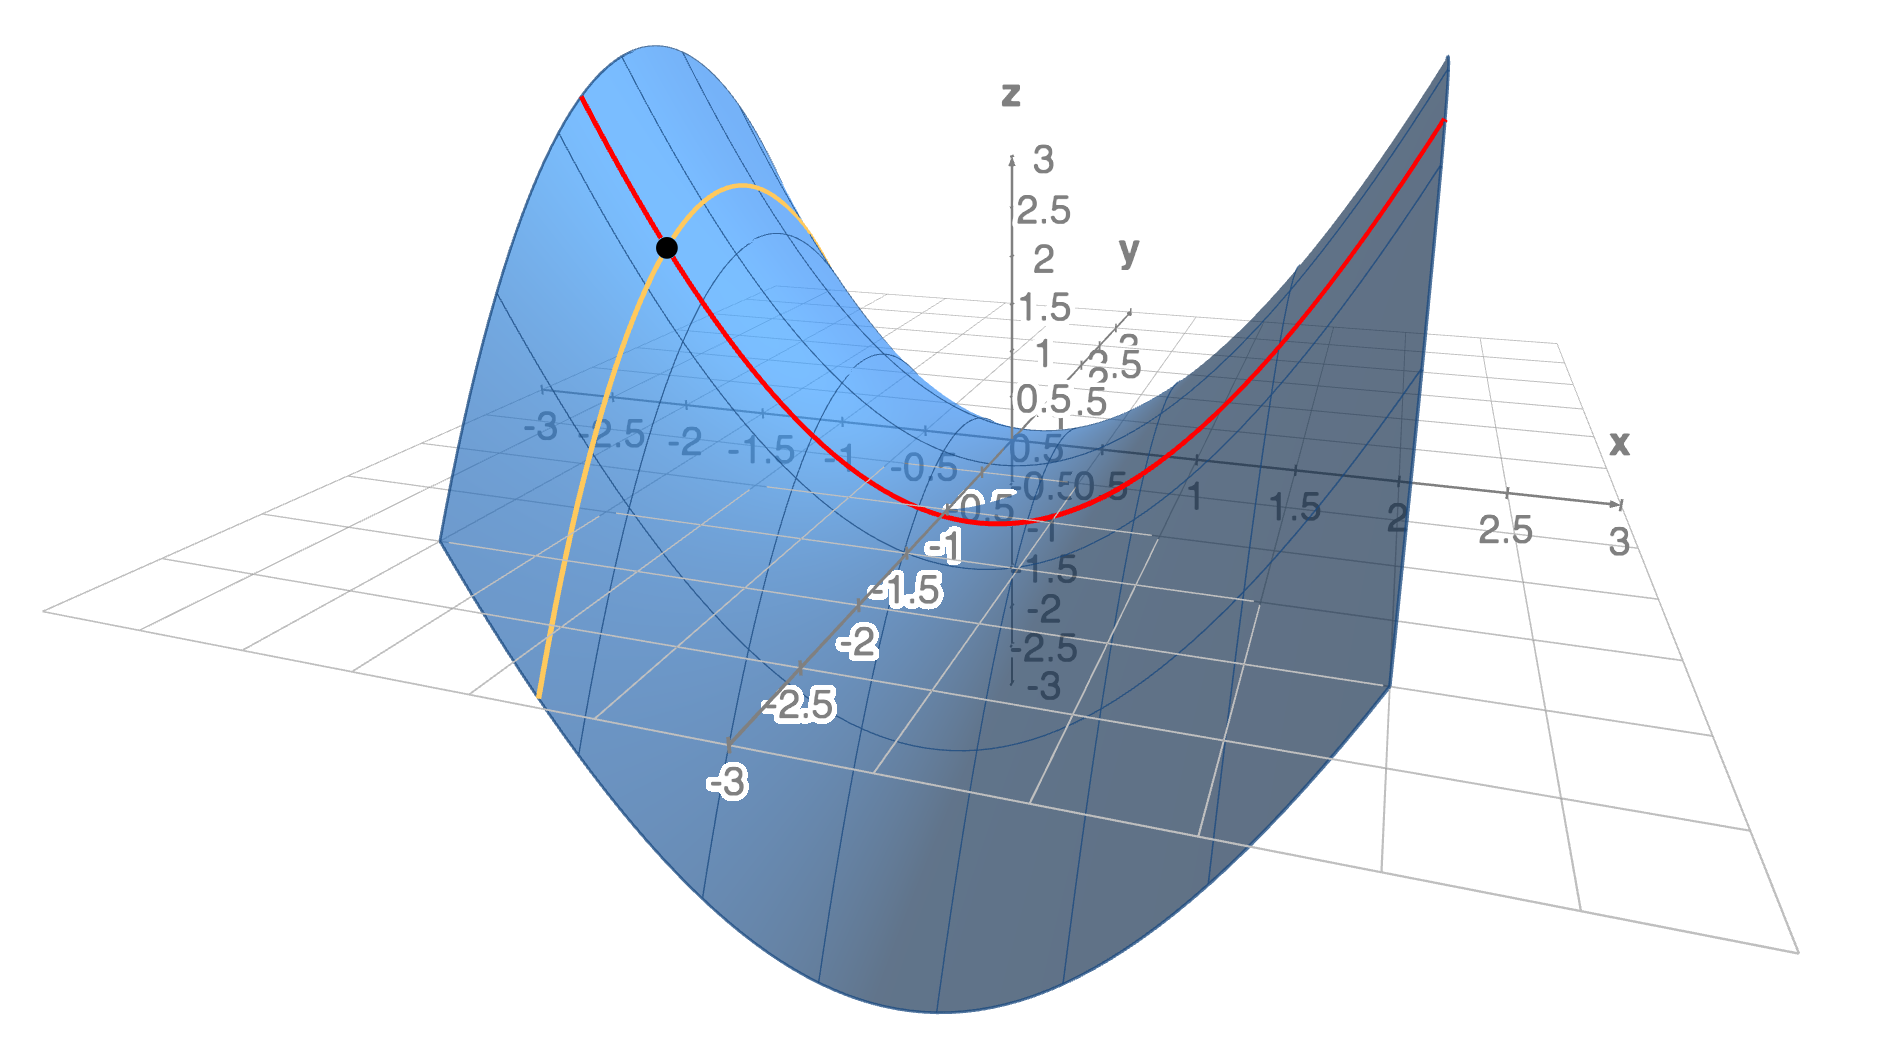
Let's make a partial derivative visualization
math3d live backup demo
Let's make a partial derivative visualization
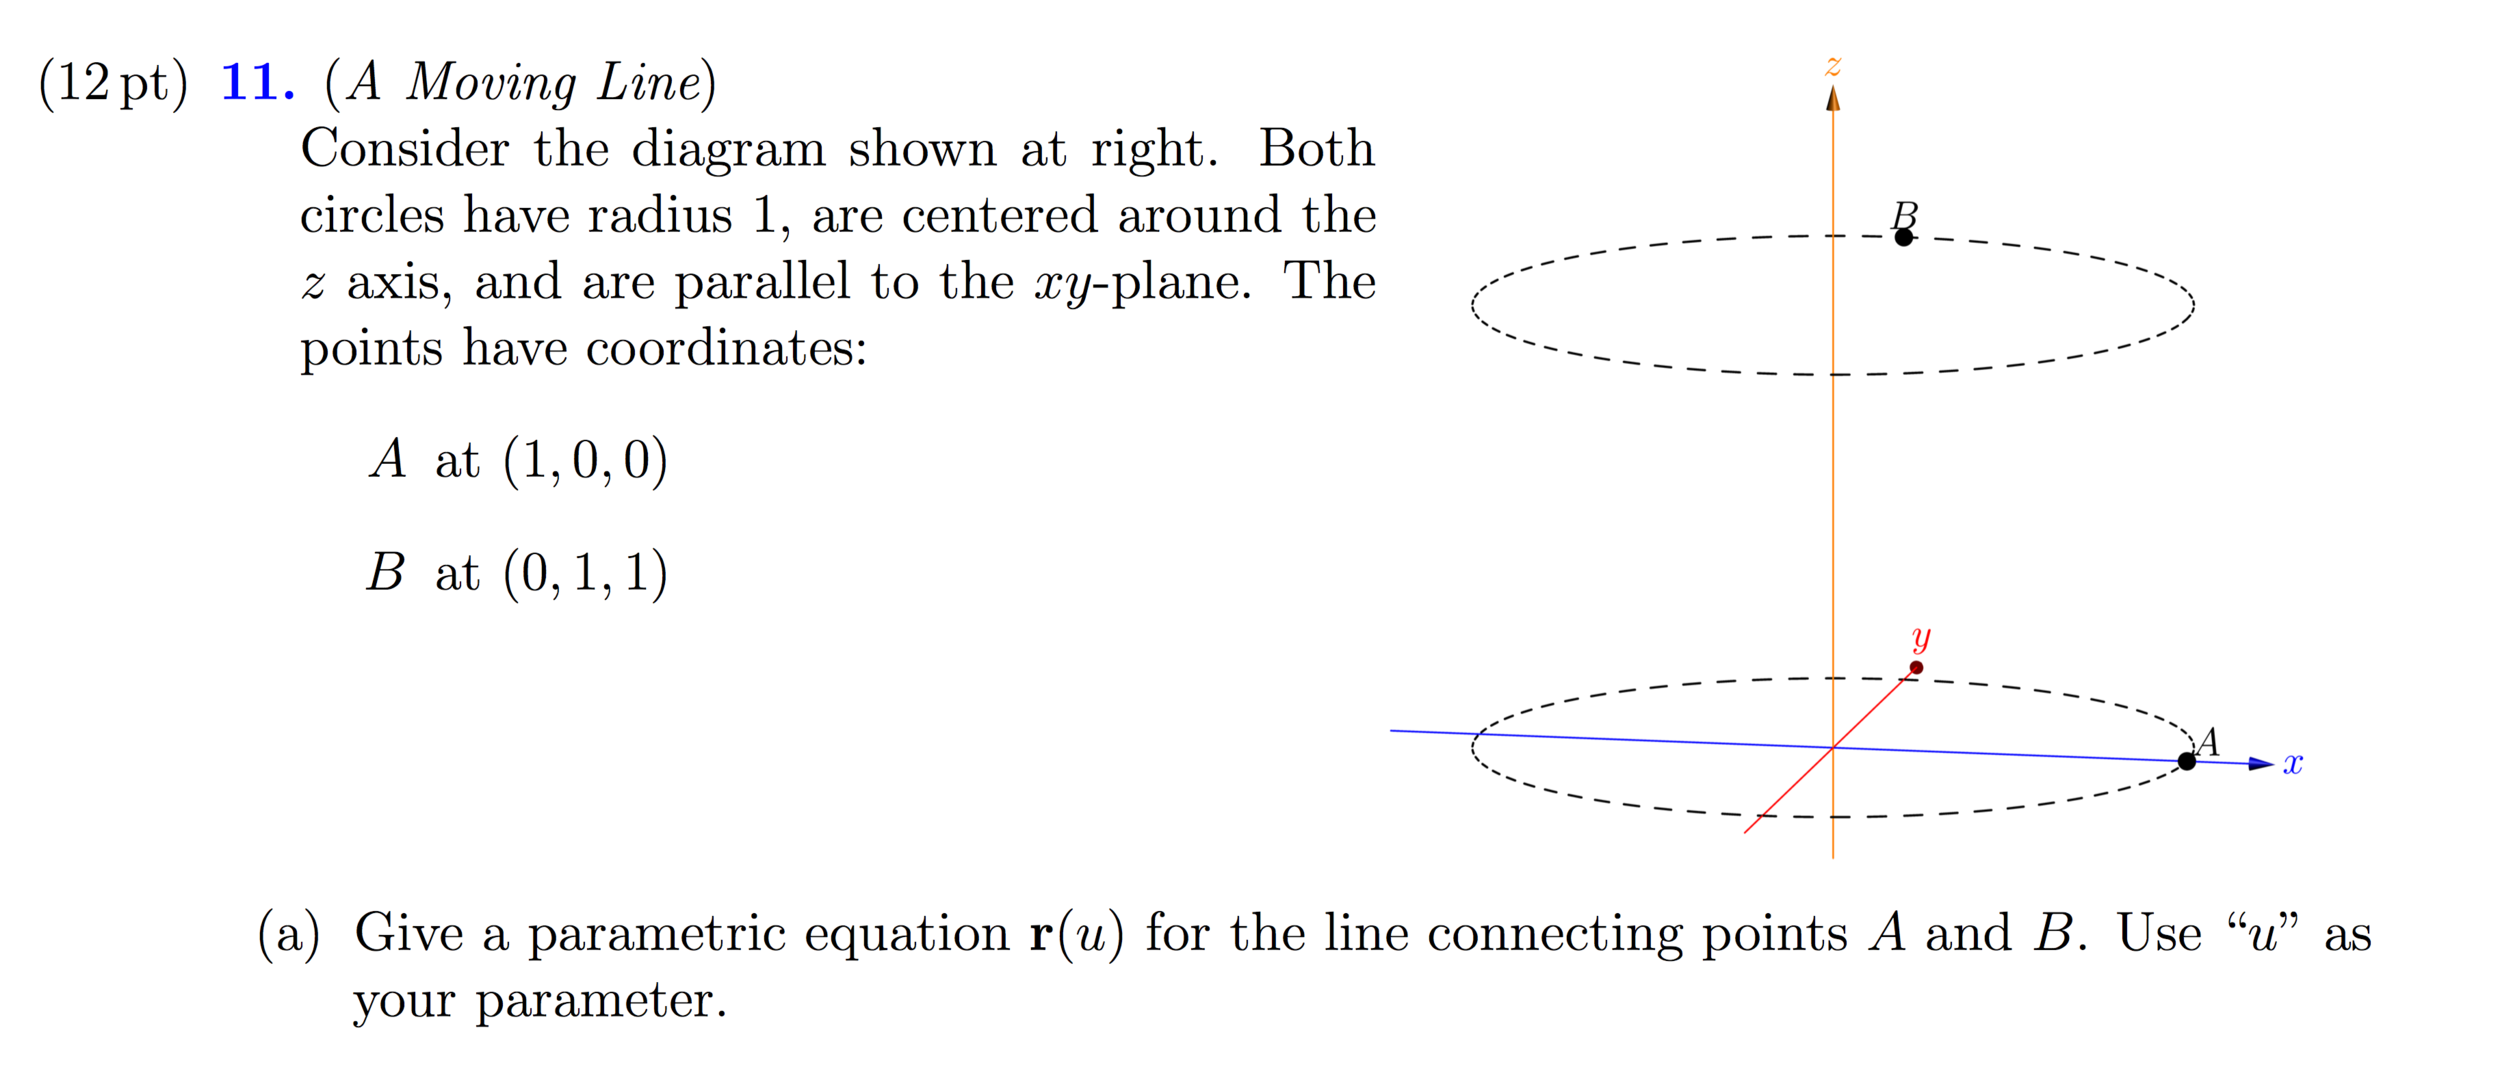
Animated Homework
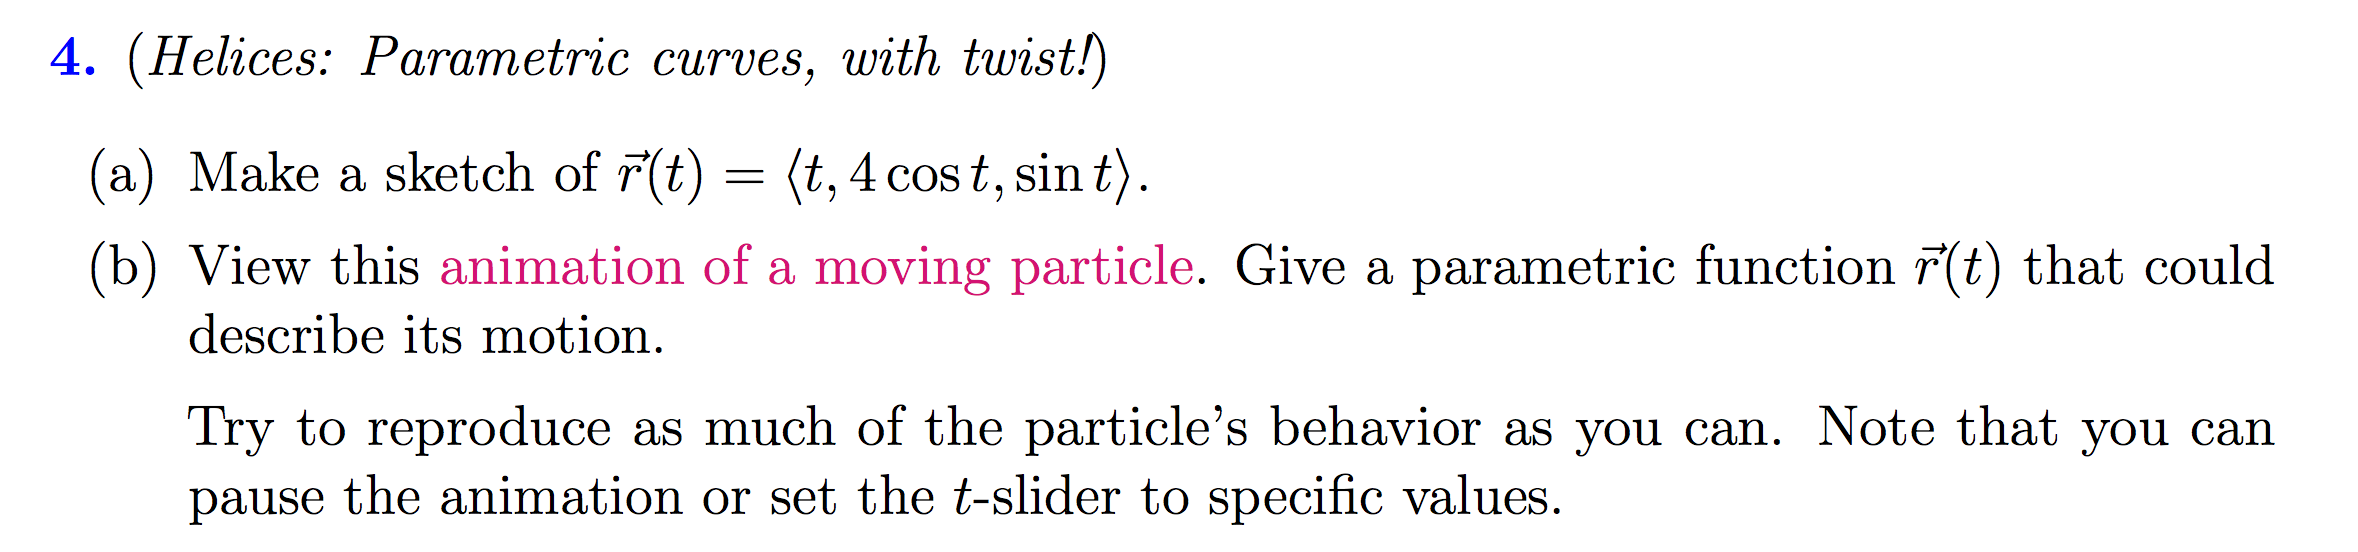
(From multivariable pset_03, 2016)
Animated Homework
In Class Projects
Not just for Multivariable Calculus
Aspiration:
High quality 3d visualizations that are
easy to share and easy to tweak
math3d.org
- Open source under
the MIT License - In active development!
Some goals:- Add user login & database to save shorter URLs
- improve usability (popover tips, more syntax visual feedback, ...)
- Make a nice showcase of existing demos
- Add more math! (vector fields, color maps, ...)
- Find a bug? Want a feature? Report it! (or implement it!)
https://github.com/ChristopherChudzicki/math3d
This presentation:
Presentation: https://goo.gl/dsX62X
Thanks for listening!
Active development on an academic schedule
progress over time
Interactive Row Reduction
an extra